
Over the past five years, all the Regional Internet Registries (RIRs), with the exception of AFRINIC, have exhausted their pool of available IPv4 addresses.
The Internet community anticipated this almost two decades ago and standardized IPv6 as a long-term solution. IPv6 uptake is, however, still lagging. Hence, affected businesses have actively started seeking stop-gap measures to prolong the lifetime of IPv4 addresses.
These measures include address space redistribution, deploying large scale NATs, and trading IPv4 blocks on the IPv4 transfer market. The emergence of this market has radically changed the nature of IPv4 addresses from a free resource to a commodity, which has raised many questions about market regulations.
This blog post explores the evolution of the IPv4 transfer market.
Editor’s note: No Internet resource is free. Members pay an administration fee to use resources that have been delegated to them, as per their membership.
The transfer of IPv4 addresses is carefully managed by the RIRs. Buyers and sellers need to submit a transfer request to their RIR. The RIR then checks if the transfer can go ahead based on policy set by the community. Also, these transactions can involve a third-party participant, known as an IPv4 broker, that facilitates the trading process. The first reported transactions occurred in 2009 within ARIN (the RIR for Canada, the United States, and many Caribbean and North Atlantic islands). Since then, the overall number of reported transferred blocks has consistently increased. Figure 1 shows the number of transactions over time per RIR and the total number of IP addresses that were exchanged in the market.
The most significant increase occurred in the RIPE NCC service region, which accounts for 70% of the reported transfers as of September 2015. However, counting the transferred IP addresses shows a different picture: half of the total address space that changed hands in the market came from organizations in the ARIN region.
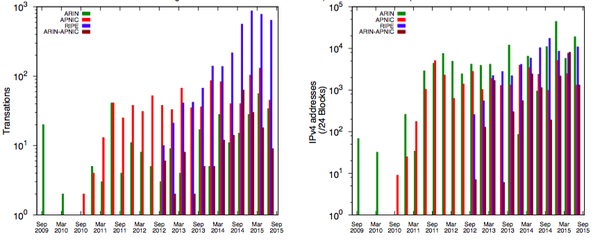
Figure 1: Evolution of the number of reported IPv4 transfers per RIR (on the left by transaction, on the right by number of IPv4 addresses).
What types of addresses are being exchanged?
Before the existence of the RIRs, the Internet Assigned Numbers Authority (IANA) directly allocated 35% of the IPv4 address space mostly to organizations in North America. These address blocks allocated by IANA in the pre-RIR days are known as legacy addresses.
Our analysis shows that legacy address space accounts for 63.82% of the total transferred address space.
As expected, most of the transferred legacy address space is sold by organizations in the ARIN region. This is a good sign as it indicates that the market is actually helping to redistribute the legacy allocations.
However, transferred legacy addresses represent only a small percentage (2.9%) of the total existing legacy address space. Most likely, in the future, we will see more legacy address holders selling their unused IPv4 addresses on the market.
Do organizations use the transferred address space?
We analyzed the transferred space usage by testing whether this address space is routed before and after the transfer date. To this end, we classified the transferred blocks into six visibility classes (see Figure 2).
About 94% of the transferred address space is routed after the transfer (that is, classes C-I, C-II and D). Moreover, 85% of the address space is either routed for the first time after the transfer (C-I) or was unrouted for two years prior to the transfer but is routed after the transfer (C-II). The large percentage of address space that is routed after the transfer shows that buyers actually use the address space they acquire on the market.
Breaking down the analysis per RIR shows some differences: in ARIN, 70% of the transferred address space is routed for the first time after the transfer, while the corresponding numbers for APNIC and the RIPE NCC service region are 30% and 6.6% respectively. The analysis of transferred address blocks in the ARIN region shows that most of them come from legacy allocations.
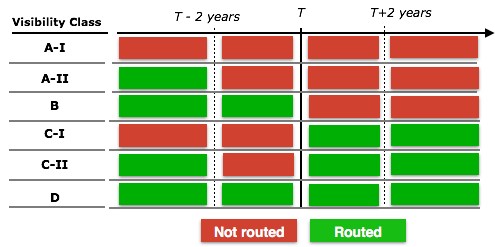
Figure 2: IPv4 visibility classes of the transferred address space.
We used IP census data to gain further understanding of the address usage. The IPv4 census data is collected by probing each IPv4 address in the allocated address space.
For our study, we used 39 snapshots collected from November 2009 until December 2015. From every snapshot, we extracted for each transferred block the fraction of addresses that responded to the probes.
Figure 3 shows for each RIR the median utilization fraction across all the blocks routed before and after the transfer date. We see a general decreasing trend in the use of address blocks before the transfer date and a general increasing trend after the transfer. This trend is more evident in the RIPE NCC service region than for other RIRs.
These results confirm our previous findings: buyers appear to use the acquired addresses, so the market seems to serve its intended purpose.
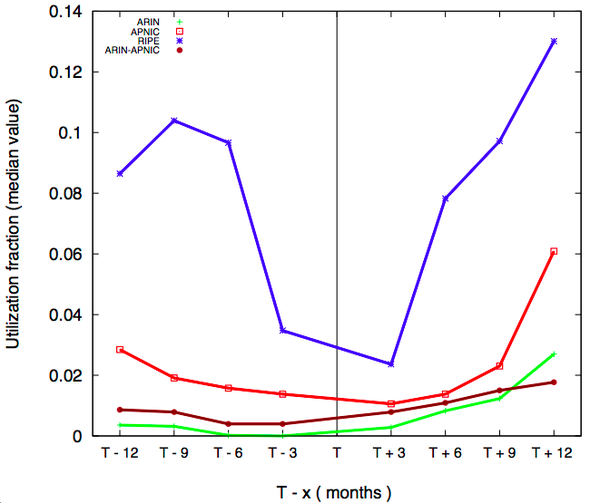
Figure 3: Reported transferred address space utilization.
What organizations are involved in the market?
Analyzing the IPv4 market means also understanding who is selling and buying addresses. We characterized the organizations in the market in terms of business type and country of origin.
We used the CAIDA AS classification scheme to determine the AS seller and buyer’s business type and grouped them into edge and transit networks.
We found that most of the transferred address space is exchanged between edge networks; in each region, more than 80% of the transferred address space is bought by such networks.
We further analyzed the origin country of sellers and buyers and found a large number of countries involved in the market: 56 in APNIC and 76 in the RIPE NCC service region.
The analysis of top sellers and buyers in terms of address space reveals differences between the two registries: in the Asia Pacific region, organizations from three economies (China, Japan, and Hong Kong) dominate the market; 81% and 77% of the total address space is exchanged (that is, sold and bought respectively) within these countries.
In the RIPE NCC service region, we find a more moderate dominance: 50% of the sold addresses comes from organizations registered in Romania and Germany, and 30% of the address space is bought by organizations registered in Iran and Saudi Arabia. This is consistent with the analysis Developments in IPv4 Transfer Markets published earlier on RIPE Labs.
To gain an intuition about the role of the IPv4 brokers, we analyzed the number of inter-country transactions. Our results show that a large percentage of the address blocks (35% in APNIC and 55% in the RIPE NCC service region) are exchanged between organizations registered in different countries.
What is the value of the IPv4 market?
One of the earliest and most well-known transactions in the transfer market took place in 2011 between Microsoft and Nortel. Back then, Microsoft bought 666,624 IP addresses from Nortel and paid USD 11.25 per address.
As of September 2015, the total number of IP addresses sold was 67,500,032. Using the Microsoft-Nortel reported price, we estimate the total value exchanged in the market until September 2015 at about USD 750 million. However, the price of an IP address usually varies in terms of available addresses in the region, the size of the block that is being transferred, and the IPv4 broker that facilitates the transaction. So, it is likely that we are underestimating the value of the market.
Is the market slowing down IPv6 adoption?
Strategies regarding IPv4 depletion and IPv6 adoption differ from organization to organization. So, finding a method to measure the impact of the markets on IPv6 adoption is not straightforward.
Our approach in measuring this impact is to study whether organizations that are currently purchasing addresses on the market will deploy IPv6 in the future (future adopters). We did this analysis using historical BGP data and the lists of published transfers.
At a given time (T), we used the published transfer data to select the networks that purchase addresses, and for these networks, we determined whether they are deploying IPv6 (based on that network advertising IPv6 prefixes in BGP) either at T or sometime after T (that is, it is a future adopter). We then computed the metric (fraction of future adopters) as the fraction of all buyers that originate IPv6 prefixes after T.
The evolution of this metric shows no clear negative impact on the IPv6 adoption process; moreover, up until 2012 we clearly observe an increase in the value of the fraction, which is an indicator of the fact that organizations do not choose to satisfy their address space need by only acquiring space from the markets.
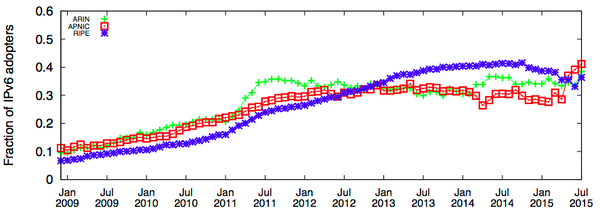
Figure 4: Fraction of future adopters per RIR.
Outlook
Since its inception, the IPv4 transfer market has been controversial due to its speculative nature and potential impact on the global routing system and IPv6 adoption (on this topic, please also see this recent study on RIPE Labs: Impact of IPv4 Transfers on Routing Table Fragmentation).
Our analysis shows that the market facilitates a healthy redistribution of the address space. We also did not find any evidence of a hoarding attitude, as organizations appear to use the address space they buy.
Although organizations have been exchanging address blocks for several years, the market is considered to be relatively young. As the available pool of address space is decreasing at a fast pace, it is most likely that the market will gain attention and have a higher impact on the evolution of the Internet. Thus, it will be very interesting to monitor the evolution of the IPv4 transfer market in the future.
Original post appeared on RIPE Labs. Contributors: Ahmed Elmokashfi, Amogh Dhamdhere.
Ioana Livadariu was a RIPE Academic Cooperation Initiative (RACI) fellow at RIPE 73 and presented this study during the plenary session (see here the slides and the video).
The views expressed by the authors of this blog are their own and do not necessarily reflect the views of APNIC. Please note a Code of Conduct applies to this blog.