

Low Earth Orbit (LEO) satellite constellations, such as Starlink, are reshaping how people connect to the Internet. Orbiting at altitudes of 400 to 600 kilometres, LEO satellites can deliver low-latency connectivity to remote regions and disaster zones that are inaccessible to traditional fibre networks. While these systems are becoming an integral part of the global Internet backbone, they remain vulnerable to extreme space weather conditions.
How do solar storms affect satellites?
Solar storms are bursts of energy and matter from the Sun that affect the Earth when they collide with the magnetosphere. The resulting geomagnetic disturbances heat and expand the upper atmosphere, increasing friction on satellites. This atmospheric drag leads to a loss of altitude for satellites. This impact is more pronounced in lower altitudes due to the increased atmospheric density.
Solar storms vary in their strength. The solar superstorm of May 2024, the largest solar storm in over two decades, offers us a unique opportunity to understand the impact of extreme space weather events on LEO network performance and stability. In our initial work, we identified a noticeable spike in packet loss and a sustained increase in round-trip time (RTT) on the Starlink network during that superstorm.
In our new paper, we conducted an in-depth investigation examining the impact across individual satellites, orbital planes, and geographic regions, as well as their correlation with network performance degradation.
Research methodology
To understand the impact of solar storms on LEO satellite networks, we analysed three datasets:
- Ping measurements from 76 RIPE Atlas probes connected to the Starlink Autonomous System (AS14593).
- The Disturbance Storm Time (DST) index captures the intensity of geomagnetic disturbance.
- Two-Line Element (TLE) sets from Space-Track, which include position and altitude information on satellites.
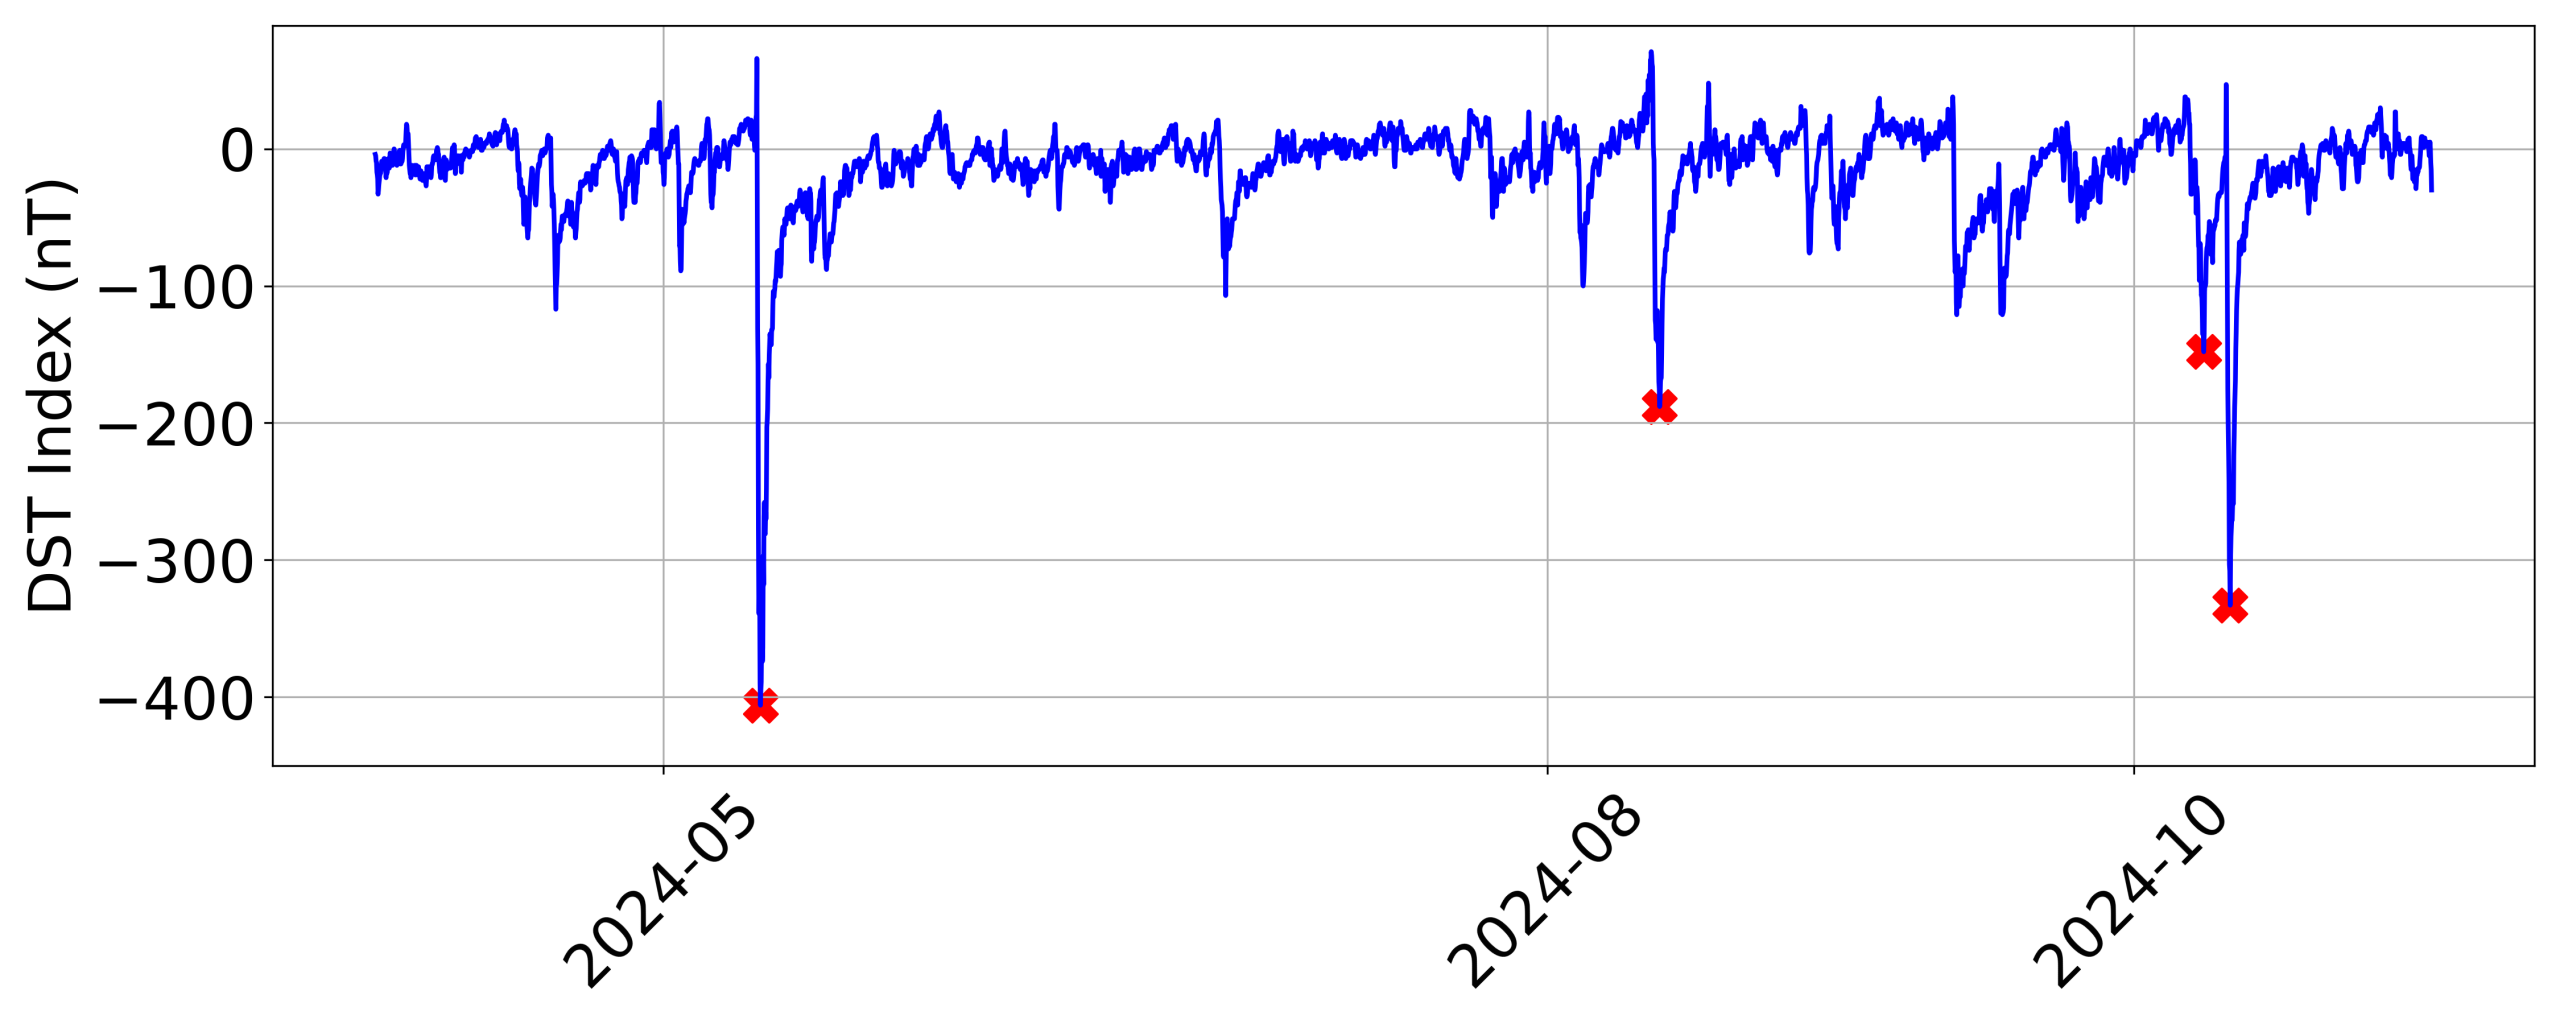
We analysed four major solar storms in 2024 (11 May, 12 August, 8 October, and 11 October). We grouped the RIPE Atlas probes into four geographic regions — Europe, US East, US Central, and US West — to track regional differences. For orbit-level analysis, we grouped over 4,700 Starlink satellites by inclination and orbital plane, and computed their altitude changes between consecutive TLEs.
Key findings and insights: Regional temporal progression
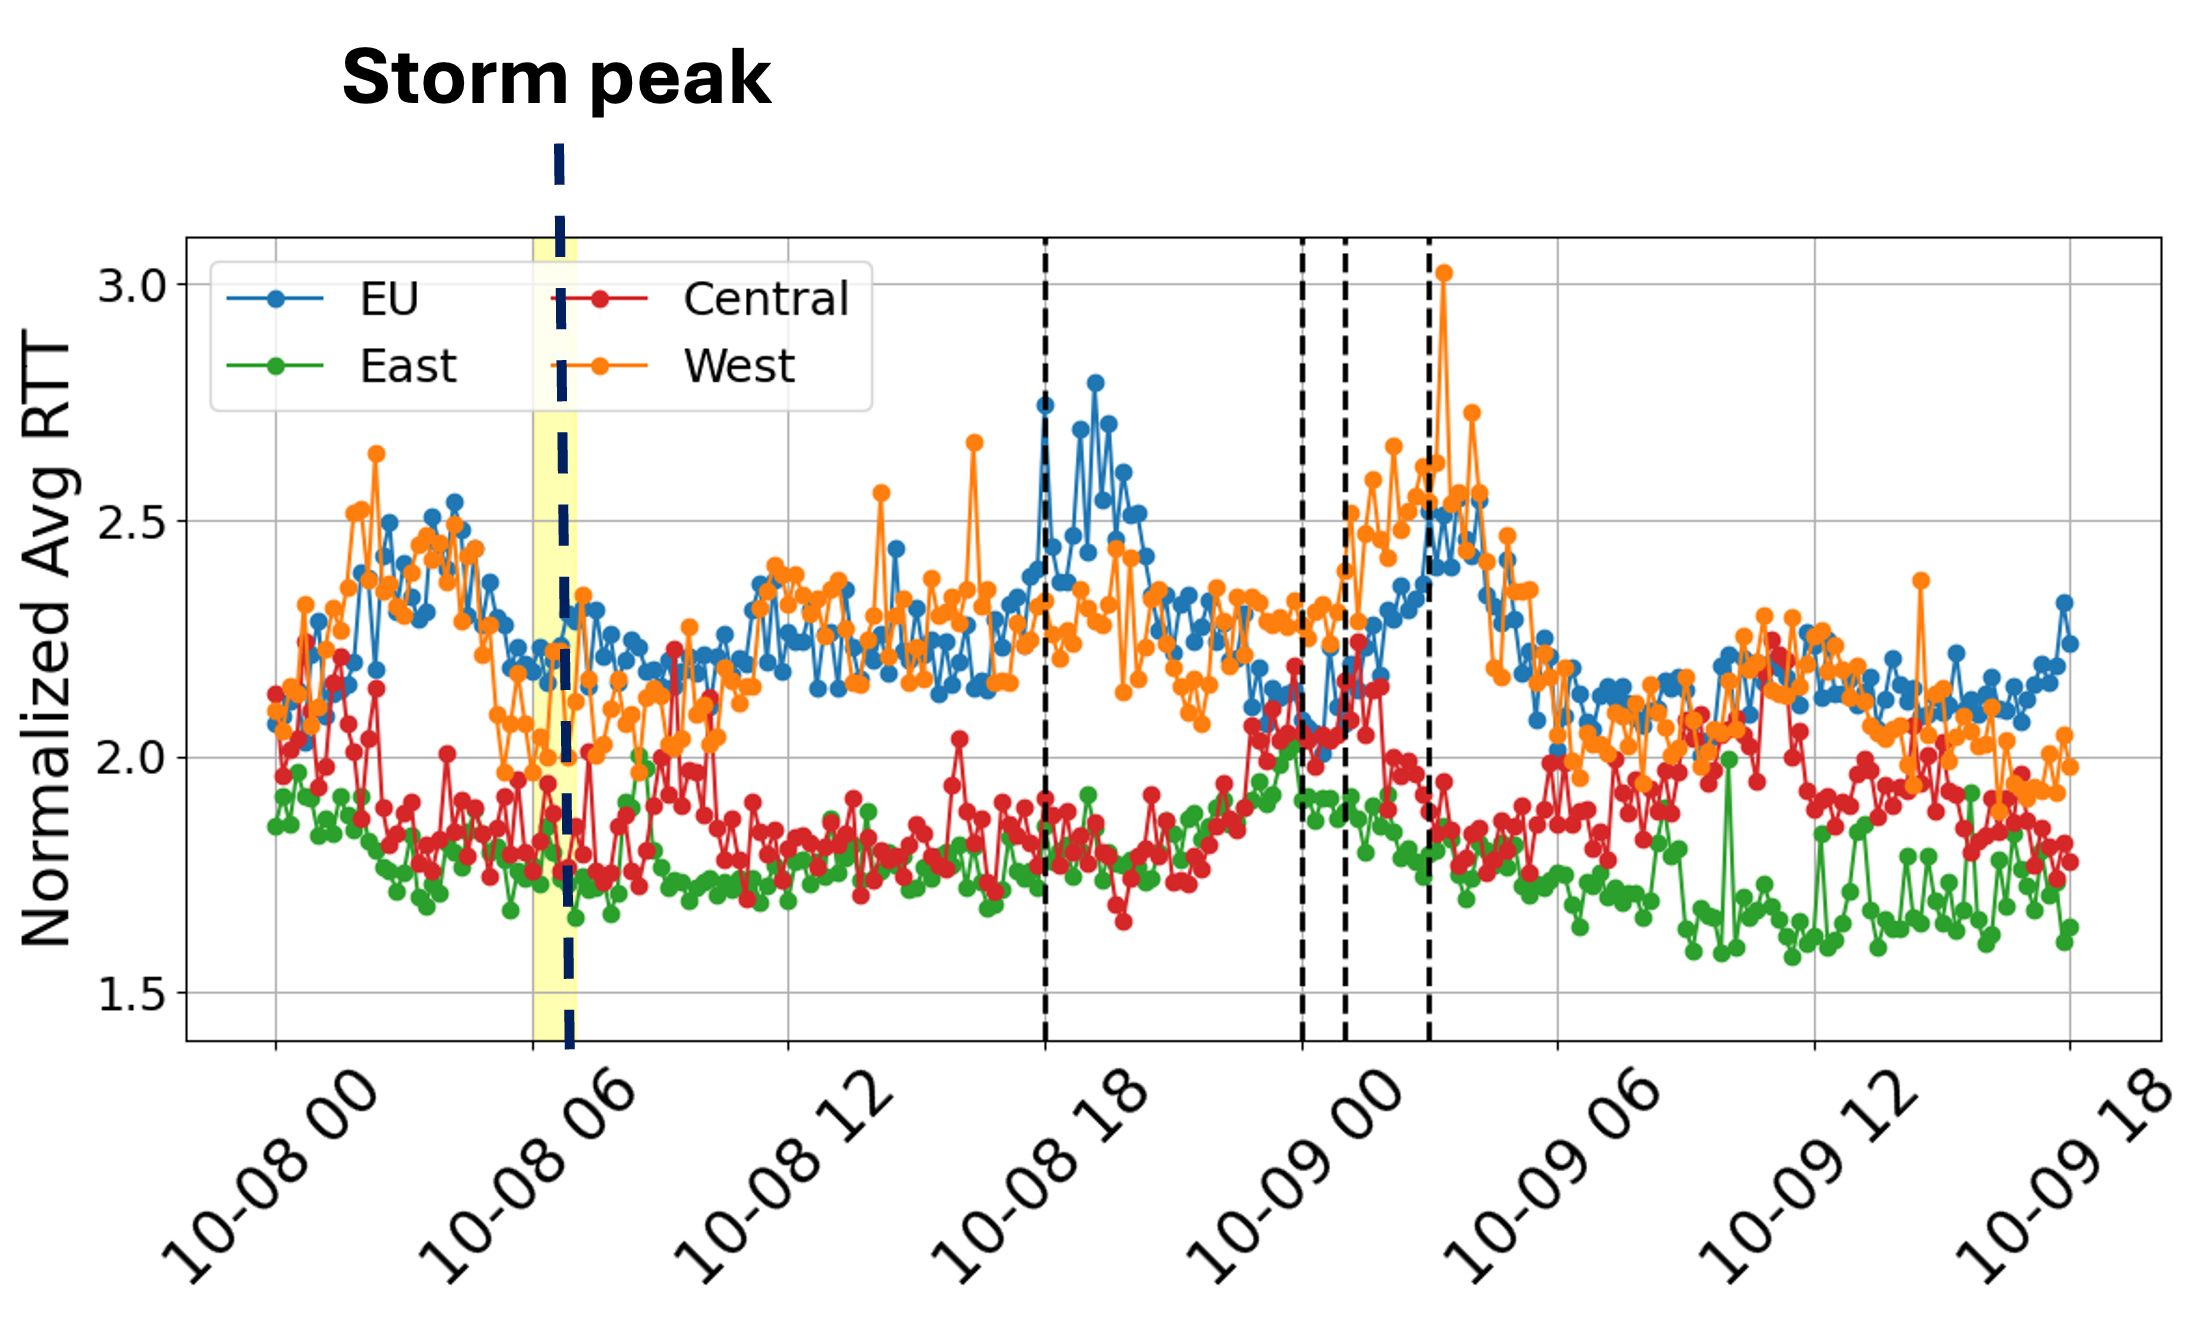
During storms, temporal patterns emerge in RTT spikes across various regions. During the 8 October storm, RTT peaks occurred first in Europe (approximately 18:00 UTC), then successively in US East, Central, and West (approximately 00:00 UTC to 03:00 UTC).
This five to eight-hour westward shift corresponds to the natural progression of satellite orbital planes with the Earth’s rotation, about 22.5° westward every 90 minutes. In essence, the storm’s network impact ‘moved’ with the constellation’s orbital shift.
The westward progression of RTT peaks aligns with the dynamics of satellite orbital motion. However, it is challenging to isolate the impact of the storm and diurnal variations from the noisy data. To cut through the noise, we conducted a more detailed analysis using orbital data.
Key findings and insights: Orbital impacts
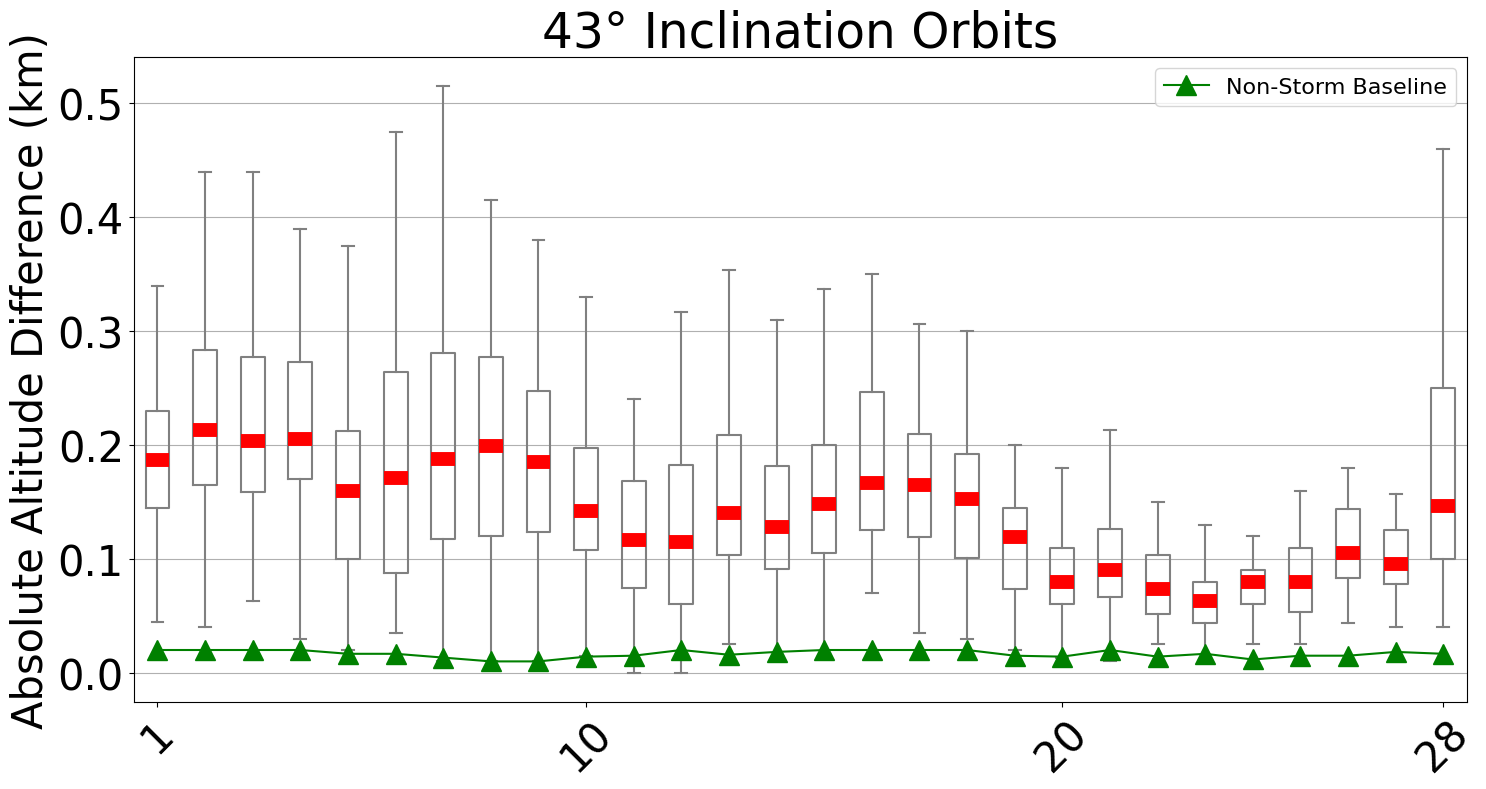
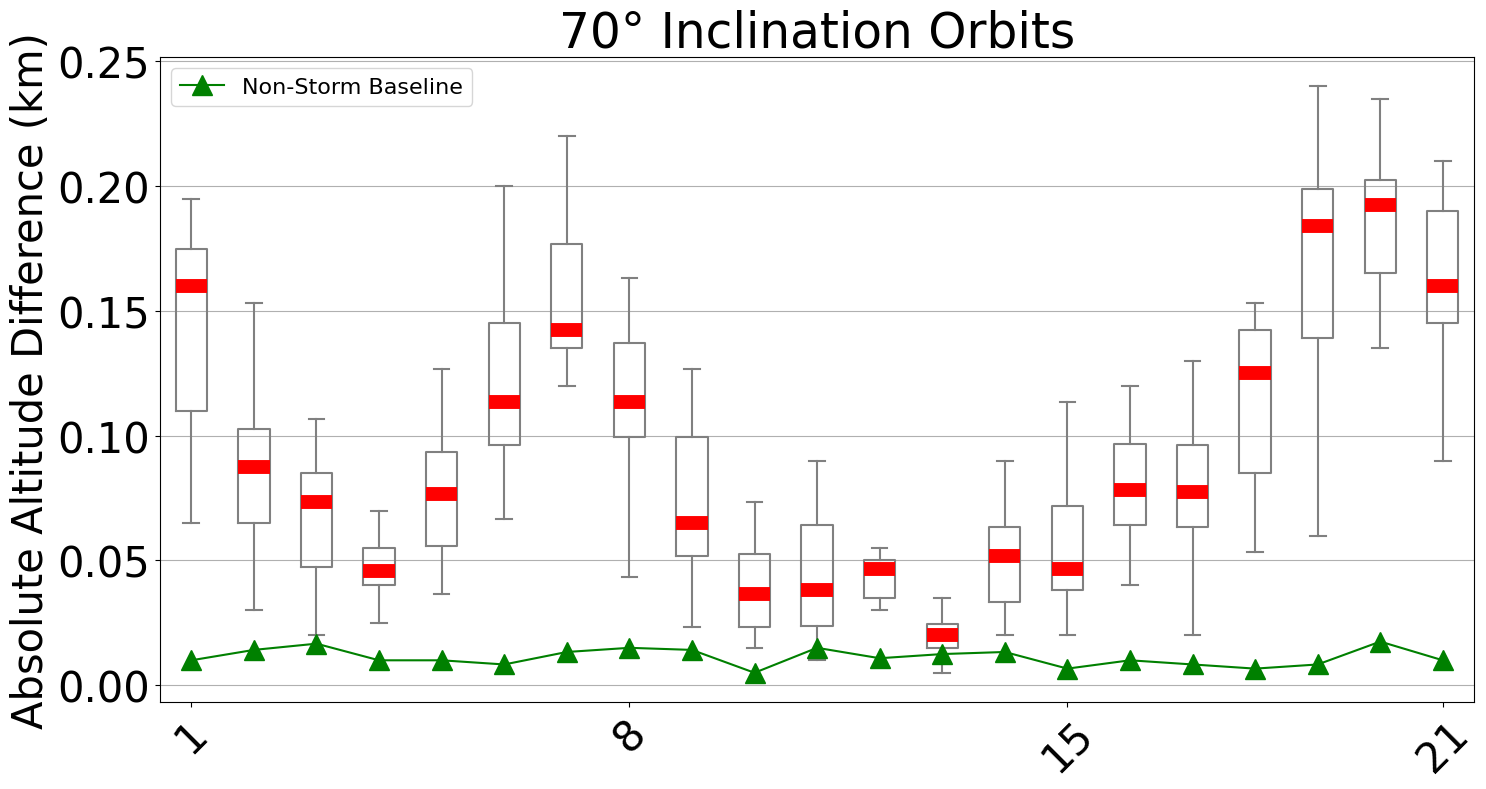
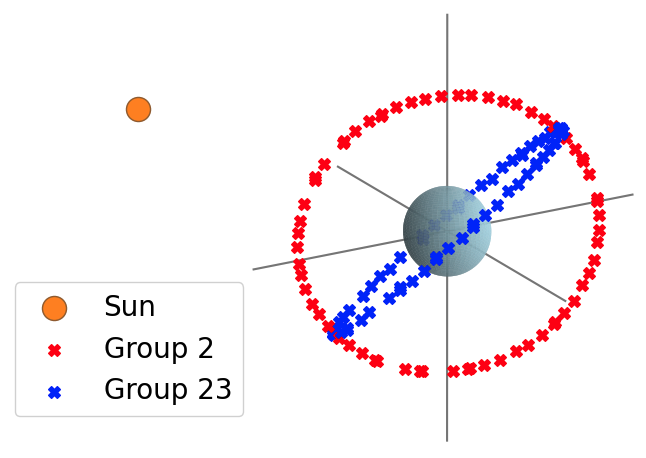
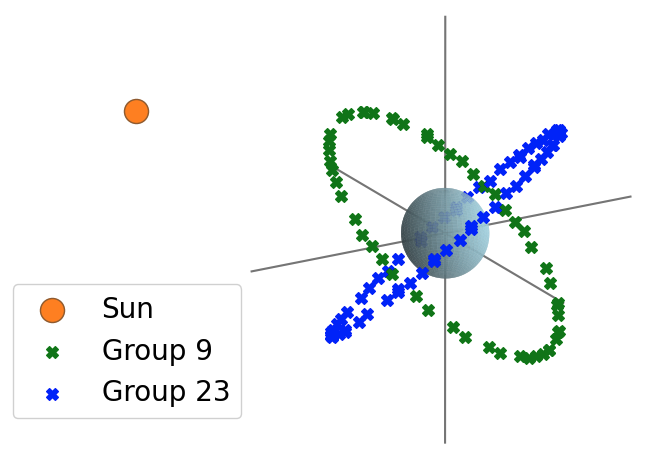
Analysis of altitude changes across orbits in the same shell reveals a distinctive ‘W-shaped’ pattern. We identified that the orientation of the orbit relative to the Sun during the time of impact determined the extent of altitude changes. Satellites directly facing incoming solar radiation suffered more substantial drag and, consequently, experienced more significant altitude changes. The most and least affected orbits were separated by roughly 90 degrees in orbital phase, confirming that solar-storm damage depends on Sun-facing orientation.
About Figures 3 and 4
In Figures 3a and 3b, the green line shows altitude changes of a non-storm day as a baseline. Box plots show significant variation within inclinations and distinctive ‘W’ patterns across orbits, indicating a systematic impact based on orbit orientation relative to solar storm direction.
In Figures 4a and 4b, the sizes of the Sun, the Earth, and the orbits are not to scale, but their relative orientations are accurate.
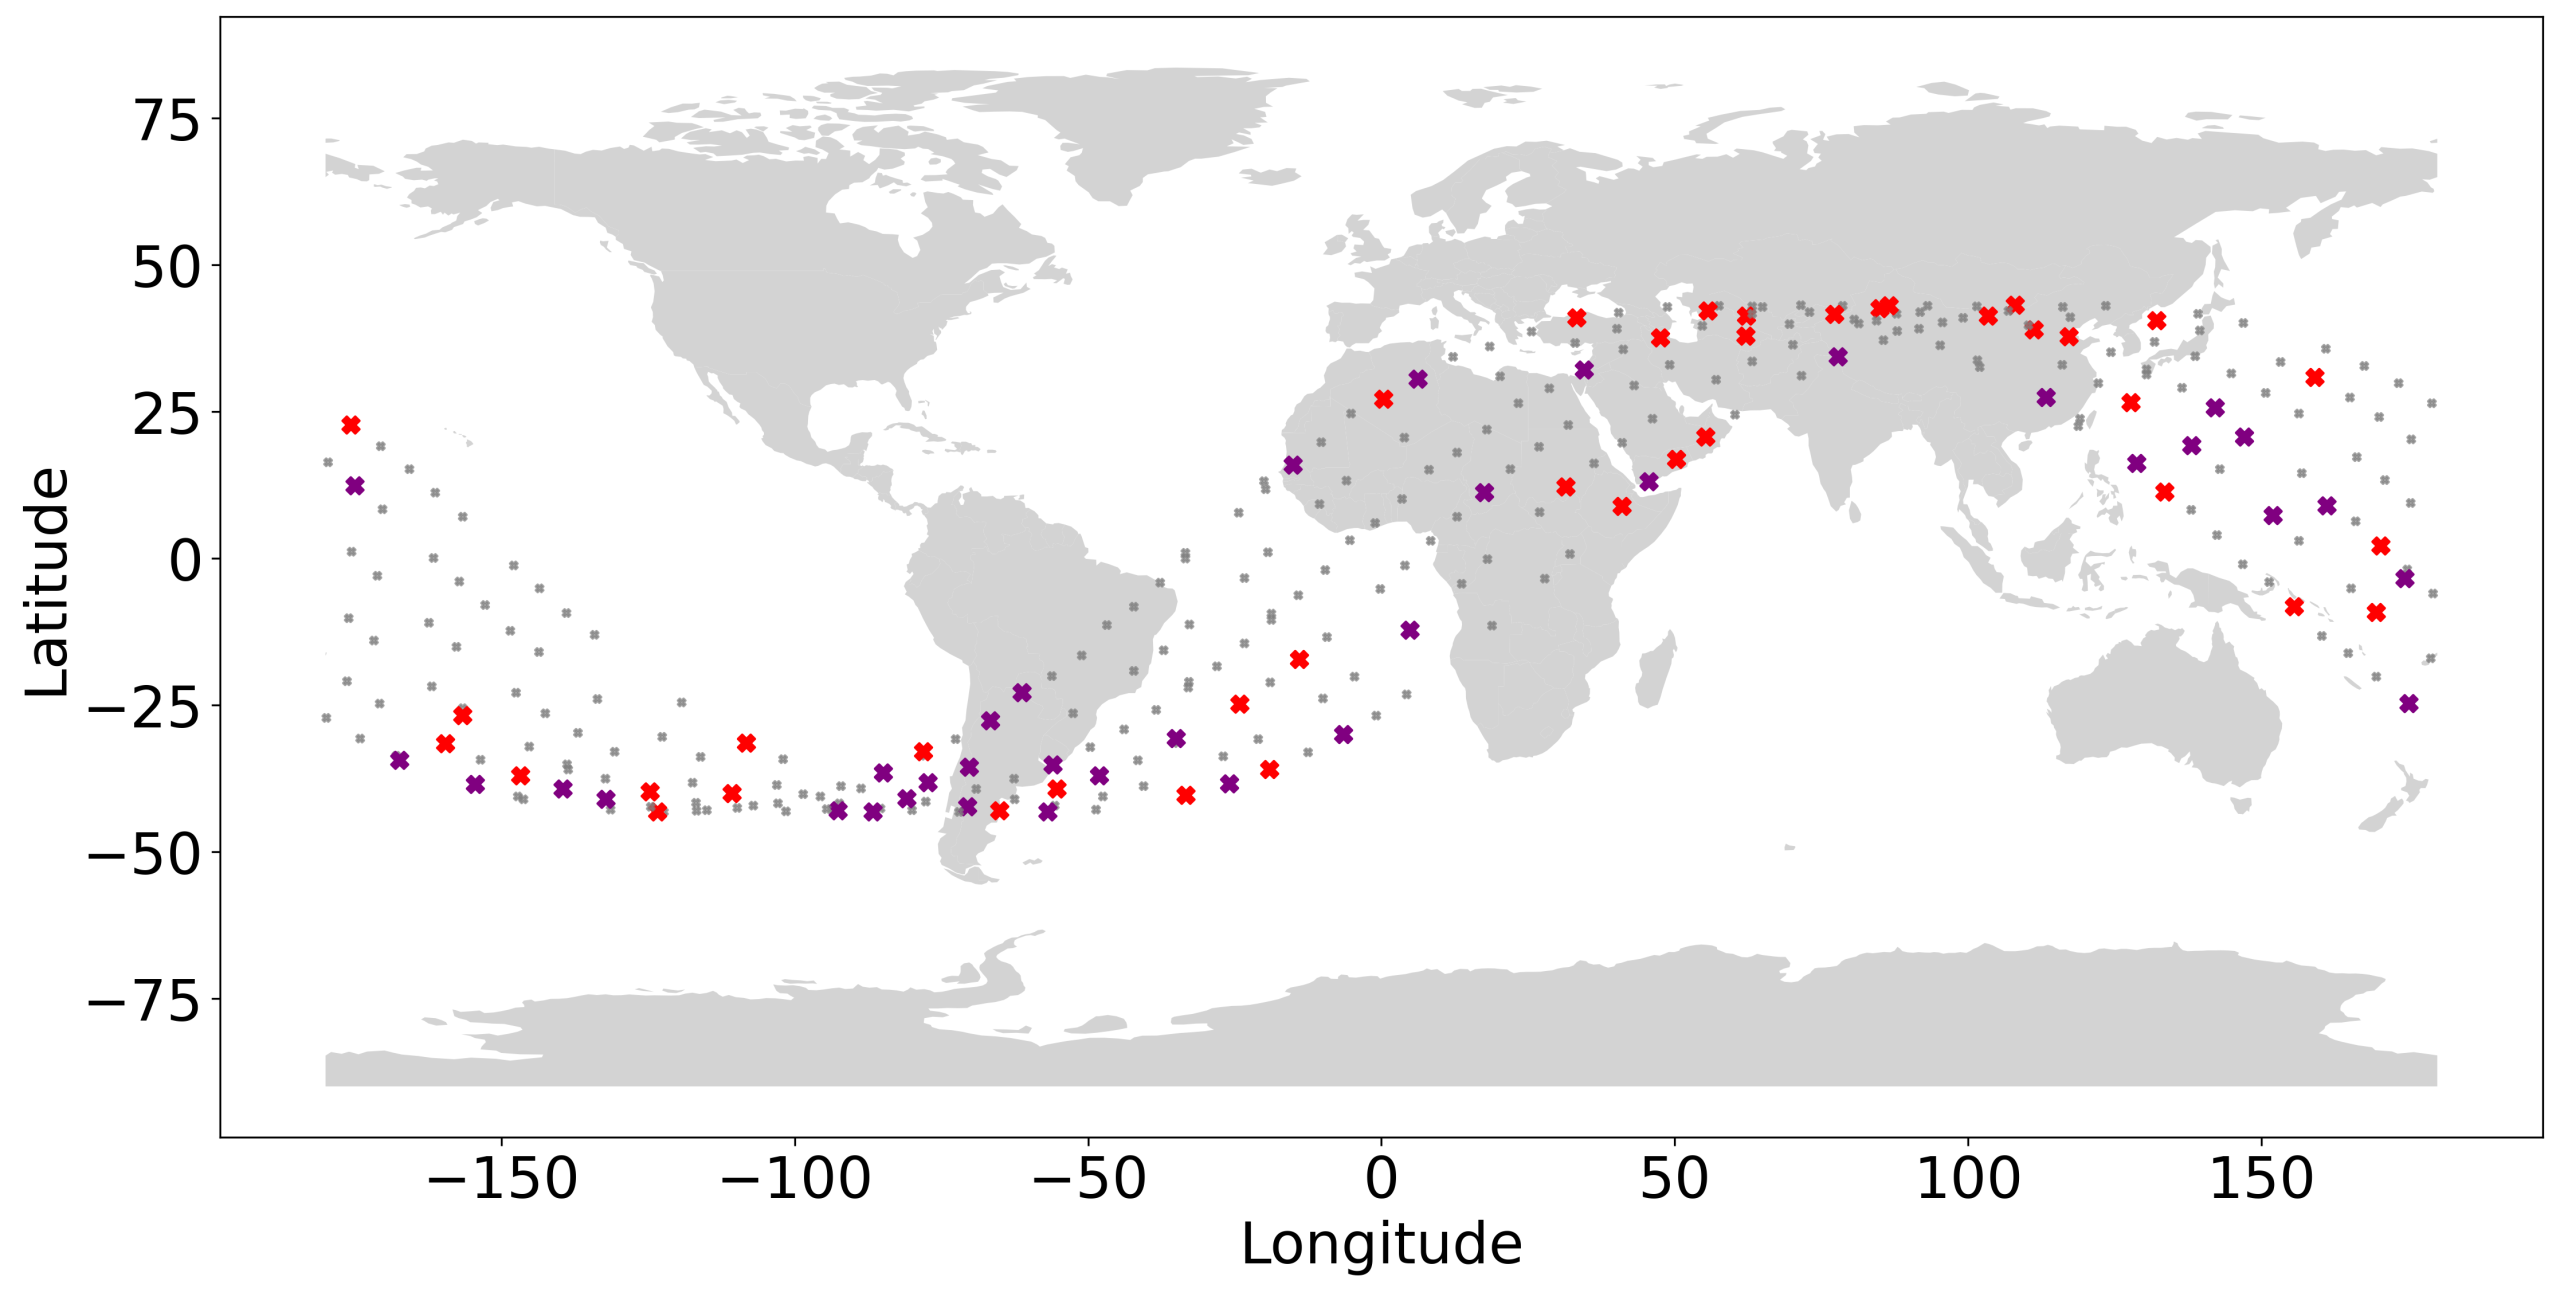
Furthermore, mapping the top 5% most-affected satellites reveals three geospatial risk zones. First, we observe a higher risk at higher latitudes due to enhanced atmospheric drag in polar regions. Second, there is an increased impact in the South Atlantic Anomaly region, a weak spot in the Earth’s magnetic field where radiation belts dip unusually close to Earth’s surface. Satellites and spacecraft flying through this region are exposed to much higher levels of radiation. Finally, the areas facing the Sun at storm peak experience a greater impact.
Key findings and insights: Cascading orbital effects
We compared highly affected satellites of 11 and 12 May, which revealed cascading patterns. We surmise that when one satellite decays, autonomous driving manoeuvres propagate through adjacent satellites, leading to increased impact on neighbouring satellites. These cascading adjustments can explain the prolonged network latency observed even after the peak of a solar storm.
Limitations, innovations, and contributions
Our study is the first to localize solar-storm impacts at per-orbit granularity and to link orbital physics with Internet measurement data. The ‘W-pattern’ discovery and the phase-shift correlation between orbits provide a physical basis for predicting which parts of a constellation will be vulnerable during future storms. By coupling solar-weather forecasts with this vulnerability map, operators could enable risk-aware routing that diverts traffic through low-impact orbits. Additionally, we can design storm-aware scheduling that anticipates temporary capacity loss or even autonomous mode switching, which suspends non-essential manoeuvres when drag spikes.
While our study reveals interesting insights, it suffers from two inherent limitations:
- The sparsity of TLE data on satellite locations.
- The lack of satellite-to-probe mapping.
As dependence on Starlink and future mega-constellations deepens, space weather resilience is emerging as a key issue for the resilience of satellite networks.
Read our paper for a deep dive into the impact of solar storms on LEO satellite networks.
Eunju Kang is a PhD Student at the University of California, Irvine, in the NETSAIL group. She researches satellite and network design.
The views expressed by the authors of this blog are their own and do not necessarily reflect the views of APNIC. Please note a Code of Conduct applies to this blog.