

Thanks to new Low Earth Orbit (LEO) satellite constellations such as Starlink, satellite-based Internet access is becoming a realistic alternative to traditional fixed and wireless technologies with promoted latencies as low as 20ms and bandwidth between 100 and 200Mbps.
Because promoted performance can vary greatly from real-world performance, my colleagues and I at UCLouvain, University of Trieste and Politecnico di Torino recently investigated if these figures are achievable using a Starlink device located in Belgium running a measurement campaign in the first months of 2022.
A 20ms-latency satellite link
We first measured the latency without load on the link, which is the best latency Starlink subscribers could achieve.
We measured it by probing a set of servers from the RIPE Atlas project. We measured the latency towards the anchors every five minutes by running three pings.
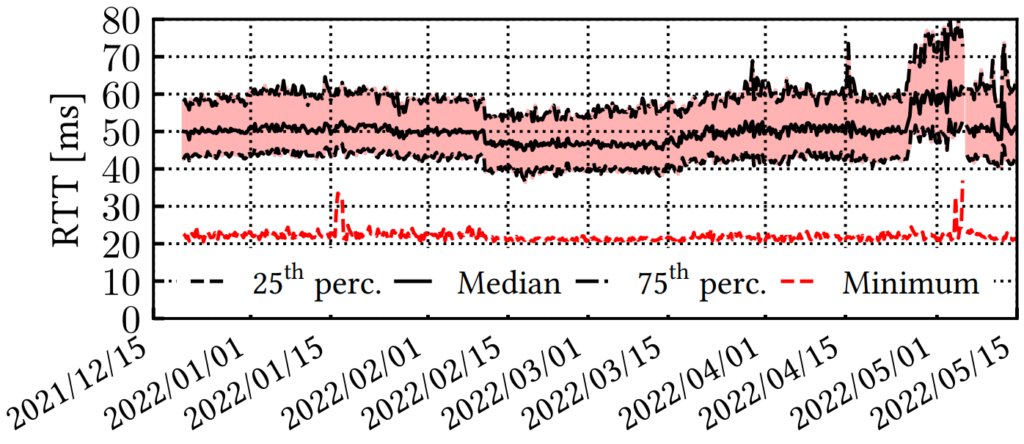
Figure 1 shows various percentiles and the minimum latency distribution over time. The picture is fairly flat, indicating stable performance and no particular changes in Starlink infrastructure over this period. The RTT to the European anchors remained constant — around 50ms median, ranging from 40ms (25th percentile) to 60ms (75th). The minimum measured latency was 20ms, as publicly advertised.
Throughput can exceed 300Mbit/s
We measured Starlink’s download and upload throughput every 30 minutes using the command line version of the Ookla SpeedTest service. For comparison, we ran the same measurements using classical (Geostationary) SatCom equipment with a 100Down/10Up Mbit/s subscription.
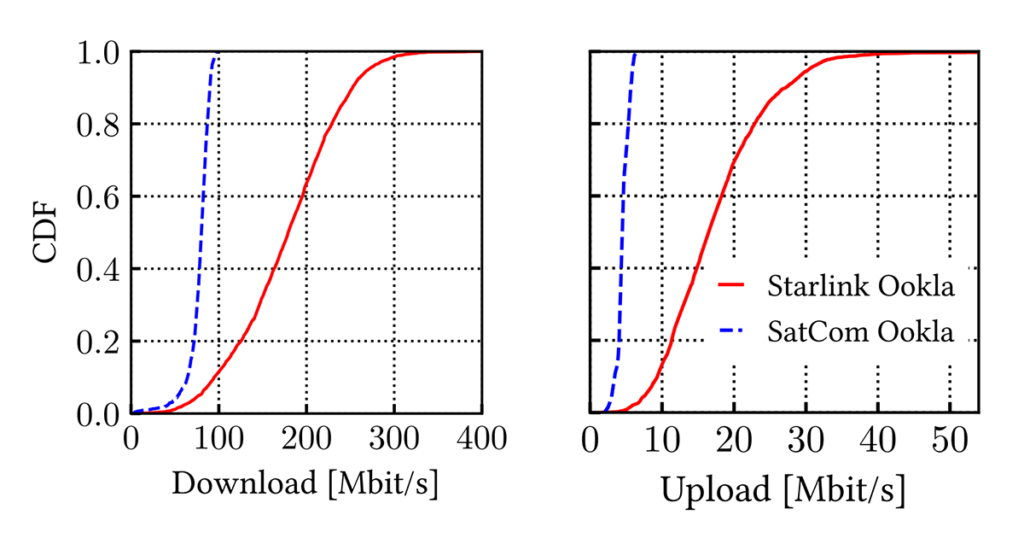
Figure 2 shows that Starlink’s download throughput ranges between 100 and 250Mbit/s. The median value was 178Mbit/s, while the maximum was 386Mbit/s.
This maximum is surprisingly high, given the company’s public statements of download speeds between 100 Mbit/s and 200 Mbit/s. We noted that this enables the use of bandwidth-intensive services, such as High-Definition video streaming. For example, Netflix’s and Disney+’s 4K videos require a download bandwidth of 15Mbit/s and 25Mbit/s, respectively.
The upload throughput was significantly lower, reaching a median of 17Mbit/s. Fewer than 5% of the cases exceed 30Mbit/s, and the highest observed rate was 64Mbit/s. Compared with traditional SatCom (dashed blue line), we found that Starlink provides higher throughput in both scenarios.
Browsing is like at home
To quantify Starlink’s performance for web browsing, we resorted to the onLoad (or Page Load Time) metric that has been shown to correlate with user Quality of Experience (QoE).
We continuously visited a set of 120 popular websites in Belgium, instrumenting Google Chrome using the BrowserTime toolset. Again, we compared the obtained metrics with those we measured using classical SatCom equipment with a 100Down/10Up Mbit/s subscription. We also used a PC connected to the Internet via a 1Gbit/s Ethernet cable to provide a golden standard for the browsing metrics.
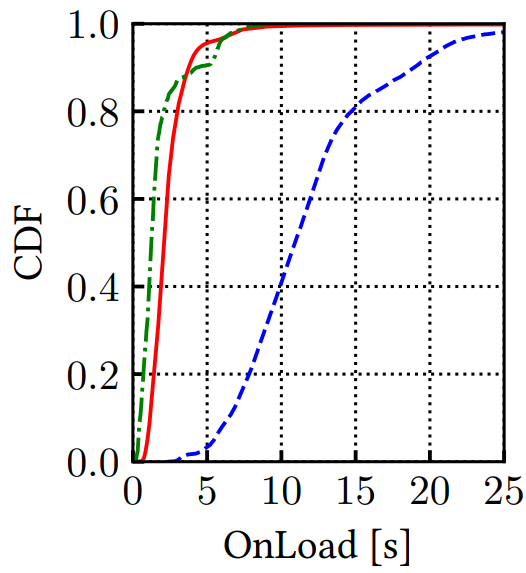
We found that onLoad generally ranges from a few to 15-20 seconds, depending on the website and conditions.
Starlink (solid red line), overall, provided a median onLoad of 2.12s and an interquartile range between 1.60s and 2.78s.
Experiments with SatCom equipment (blue dashed line) showed that onLoad was substantially larger, 10.91s in median. It is likely that this performance is due to the high latency of the SatCom connections (in the order of 600ms), which affects the operation of TCP and HTTP.
The green dashed line reports the baseline performance of a well-functioning 1Gbit/s wired network. The median onLoad was 1.24s, lower than the other two cases but comparable with Starlink’s performance.
We concluded that, for web browsing, Starlink outperforms SatCom and has a close performance to regular wired access. Looking at quantitative metrics, Starlink is 75 to 80% faster than traditional SatCom.
Packet losses
As satellite communications are a wireless technology, they are subject to interferences leading to packet losses. The dish also regularly needs to switch its focus from one satellite to another, potentially losing packets in the process. We, therefore, measured the loss rate during Starlink communications with two different kinds of network traffic on the link. Both scenarios used QUIC as it is more precise than TCP regarding the identification of lost packets during a transfer. The resulting loss rates are shown in Table 1.
| H3 ↓ | H3 ↑ | Messages ↓ | Messages ↑ |
| 1.56% | 1.96% | 0.40% | 0.45% |
The first scenario is an HTTP/3 bulk download of 100MB causing a heavy load on the link. In this scenario, packets can be lost due to both congestion and medium imperfection. We observed a 1.56% (responder 1.96%) loss rate for downloads (responder uploads).
The second scenario sends sporadic messages in QUIC at a low bitrate (3Mbit/s) to reduce the impact of losses due to congestion on the access point. For this second scenario, we observed a 0.40% (responder 0.45%) loss rate for downloads (responder uploads). We can, therefore, note that packet losses are still present even at a low bitrate, while we noted a nearly absolute 0% loss rate when repeating the experiments on the UCLouvain campus network contacting the same server.
We finally studied the number of consecutively dropped packets (loss bursts) in both scenarios. While the H3 scenario, which is subject more to congestion-induced losses, encountered mostly small loss bursts, more than 25% of the loss bursts for the Messages scenario concerned more than eight consecutive packets. Our experiments under light load, therefore, encountered fewer but longer loss events. We can speculate that those events were also present in the H3 scenario, but were outnumbered by the smaller congestion-induced loss events.
No evidence of middleboxes
SatCom operators widely adopt TCP Performance Enhancing Proxies (PEPs) to mitigate the impact of increased latency on TCP performance. We used Tracebox to detect whether StarLink deploys PEPs or other types of middleboxes.
Tracebox did not show the presence of any PEP; the TCP handshake is correctly performed in the destination network. Only the TCP and UDP checksums are altered by the carrier-grade NATs.
Some operators also apply Traffic Discrimination (TD) to control the bandwidth used by applications on their network. We employed Wehe, a state-of-the-art tool to detect Traffic Discrimination (TD). We launched ten times the complete Wehe tests but could not find any TD policy in place, at least for the most popular services.
Read our AMC IMC 2022 paper ‘A First Look at Starlink Performance’ to learn more.
Contributors: François Michel, Danilo Giordano, Olivier Bonaventure.
Martino Trevisan is an Assistant Professor at the University of Trieste. His interests are mainly focused on big data methodologies for web and Internet analysis.
The views expressed by the authors of this blog are their own and do not necessarily reflect the views of APNIC. Please note a Code of Conduct applies to this blog.
Very interesting…
But what is the performance if you have two or three end users in the same geographical area? The bandwidth of the Starlink downlink is not that great, so will multiple users significantly downgrade the performance?
Dear Kevin,
We suppose that having many users connected to the same satellite causes somewhat performance degradation. However, our measurements cannot give any figure in that sense, and we believe that StarLink was largely underutilized in Belgium during the measurement period.
I think the implications of congestion in StarLink are emerging during these last months of high utilization in Ukraine.