

Now in its seventh year, the National Internet Segment Reliability Research report by Qrator Labs provides insight into the critical nature of certain Autonomous Systems (ASes) and how their outage might affect the connectivity of an economy.
Using a model that we have fine-tuned over the past seven years (refer to our methodology for more information on this) we seek to understand how many ASes in the same region would lose connectivity with Tier-1 operators and their global availability along with it as a basis of an economy’s reliability via IPv4 and IPv6.
This post provides a snapshot of our findings from 2021 to 2022.
What’s changed in the past 12 months?
Every year exciting movements happen in the reliability rating, often corresponding to what is happening with the telecommunications industry inside the respective regions. Compared with 2021, in 2022:
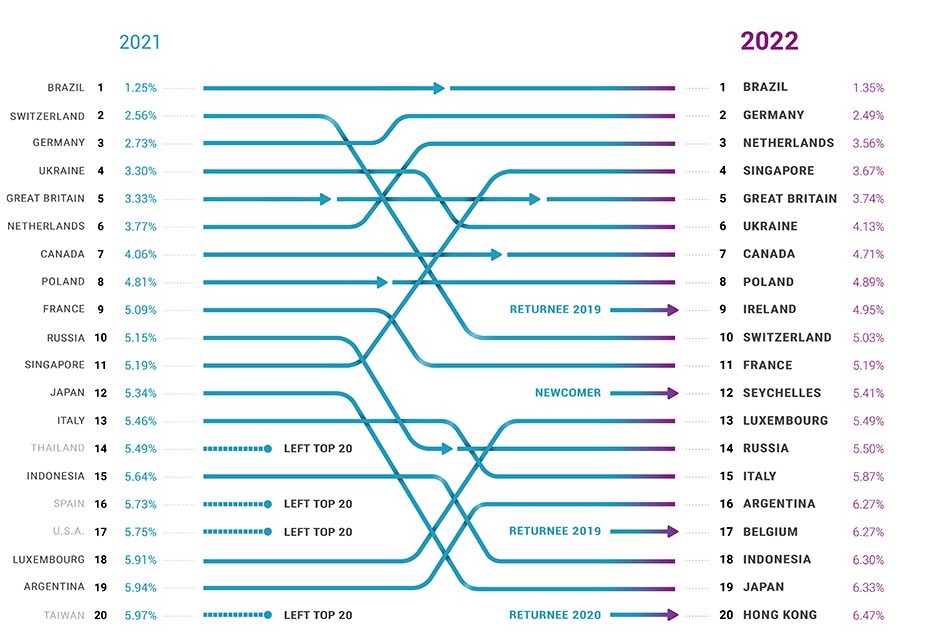
- Four economies have dropped out of the IPv4 reliability top-20 (Figure 1): Thailand, Taiwan, Spain and, surprisingly, the United States, which now resides at position 28 with a score of 7.45%.
- Switzerland dropped eight places to 10 in the IPv4 reliability rating, with AS6830 deemed its most critical AS in 2022 whereas previously it was AS3303.
- Japan dropped seven places to 19.
- Singapore and Luxembourg went up seven places and five places respectively.
- Ireland is back in the top 20 of the IPv4 reliability rating after leaving in 2019.
IPv6 reliability
As of September 2022, approximately 37% of Google users use IPv6, which effectively translates to their ISPs supporting IPv6. Although the main issue with IPv6, partial connectivity, persists.
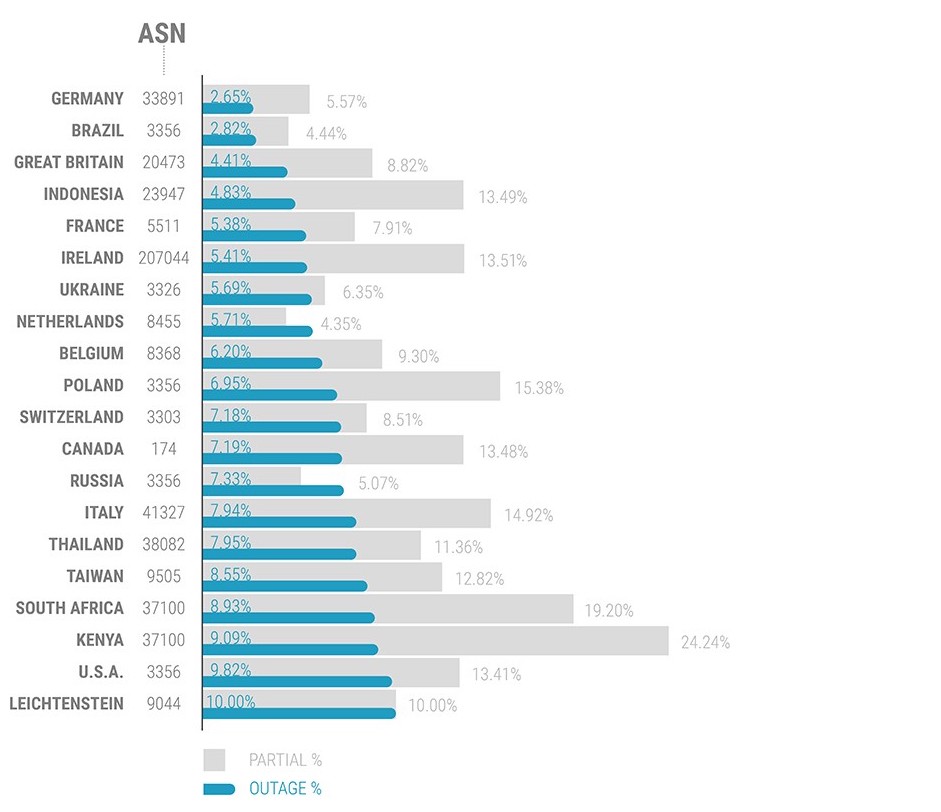
However, due to peering wars, non-universal IPv6 adoption and other matters, IPv6 still has limited network visibility as demonstrated in Figure 2, which shows IPv6 reliability versus the partial connectivity rate for the top 20 economies.
In 2022, the global average IPv6 reliability score was 27.4%, which compares well to the IPv4 reliability score of 26.7%.
There are several economies in the top 20 where partial connectivity exceeds 10%: Indonesia, Ireland, Poland, Canada, Italy, Thailand, Taiwan, South Africa, Kenya and the United States. Liechtenstein has precisely 10% partial connectivity and 10% IPv6 reliability.
China, which ranked 7th for IPv6 reliability in 2021, is now ranked 111th due to having 18% partial connectivity, and 44.03% reliability.
When combining the partial connectivity percentage with the ‘classic’ reliability percentage (outage), the best performing economies among the top 20 for IPv6 reliability are Brazil (7.26%), Germany (8.22%) and the Netherlands (10.06%). The worst performing economies were Taiwan (21.37%), Poland (22.33%) and Italy (22.86%).
According to Google’s data on per-economy IPv6 adoption, in September 2022, the leaders were France — with a 73.12% adoption rate — India (69.16%) and Germany (64.29%). Every other economy, according to Google, is below 60% IPv6 adoption.
And while France and Germany rank in our top five for IPv6 reliability in 2022, India ranks 83rd, with 23.80% reliability for AS6453 and 7.38% partial connectivity, a slight improvement in 2021.
Broadband Internet and PTR records
Another important question that we’ve tried to answer each year since 2019 is “Does an economy’s leading ISP always influence regional reliability more than everyone else?”. This is based on our hypothesis that the most significant (by user base or customer base) ISP in a region is not necessarily the most critical for the region’s network connectivity.
To answer this we analyse the pointer (PTR) records, which are used for Reverse DNS lookup — using the IP address to identify the associated hostname or domain name. Since we know the critical AS for every economy in the world, we can count the PTR records within their network and determine their share of overall PTR records for the corresponding region. We counted only PTR records and did not calculate the ratio of IP addresses without PTR records to IP address with them.
In the PTR-based rating (Figure 3), we look at what part of PTR-enabled IP addresses would go offline with an outage of each economy’s AS and the percentage representing the relevant region.
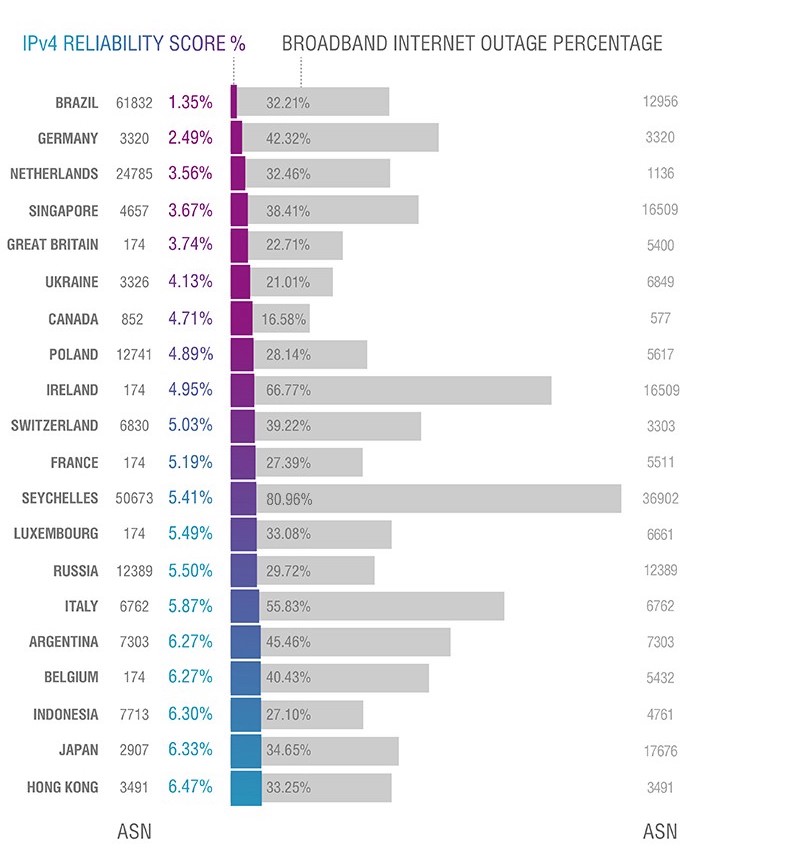
In most cases, not only does the primary regional AS change, but the percentage is entirely different. In all of the generally reliable (from the global availability point of view) regions, the number of PTR-enabled IP addresses that shut down following an outage of one AS is dozens of times higher. That could mean that the leading national ISP always handles end users at one point or another.
Thus, we should assume that this percentage represents the part of the ISP’s user base and customer base that would go offline (if switching to a second ISP were not possible) in the event of an outage. From this perspective, economies appear less reliable than they look from the transit point of view.
ISPs with only one upstream (stub networks) and their reliability
This year, we found a peculiar detail in 10 of the top 20 IPv4 reliability rating economies. Suppose we look for the critical provider for stub networks, which are essentially networks with only one upstream provider. In these cases, we will find another AS and ISP different from the one responsible for the current classical reliability metric for the corresponding national segment.
Interestingly, in the past, a critical AS for stub networks would rarely not be the classical global critical AS simultaneously. That changed in 2022. Let’s look at the most visible differences between the critical AS in global transit versus the primary upstream choice in a specific region (Table 1).

This year, almost all IPv6 critical ASNs for stub networks differ from the classical ones, and in IPv4, the contrast is increasing too. Last year we wrote about the three ‘whales’: AS174 Cogent, AS6939 Hurricane Electric, and AS3356 Level3 (Lumen).
In 2022, Cogent (AS174) is still a critical AS in many national segments but not so much for the clear stubs in IPv4. In IPv6, AS174 is no longer a critical AS for clear stubs in Belgium (where it is now AS8368). Notably, critical ASes for clear stubs in the US changed from last year’s Cogent (AS174) to Hurricane Electric (AS6939).
The AS3356 Level3 (Lumen) in 2022 is almost invisible in the clear stubs statistics. Still, it has been a classic (transit) critical AS in IPv6 for Great Britain, Poland and the US, and this year to Russia, Cyprus, Argentina, Peru and Tunisia.
Those are big fish, but not too big to fail in terms of reliability. Moreover, continuing centralization of networks in the larger economies poses a particular challenge to the region’s reliability score, which we see, especially in the case of the US.
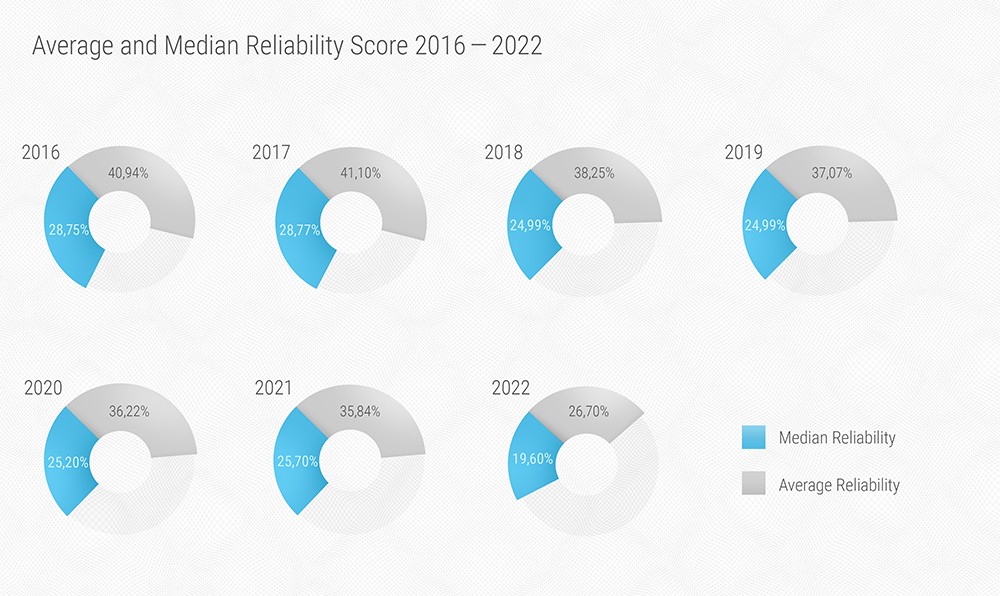
Regarding the US national segment leaving the top 20 of IPv4 rating — it’s probably not Lumen’s fault, as the increasing reliance on big telecommunication companies is typical for almost every economy in the world. We think that the US segment drop happened because other economies within the top 20 and the critical ASes related to them improved their connectivity faster and, maybe, more effectively. This thesis is further supported by the average and median reliability dynamics in 2022 (Figure 4).
AS20473 Choopa (The Constant Company) is a clear stub critical in IPv6 for four economies: Great Britain, The Netherlands, Switzerland and Cyprus. Last year, it was critical only in Switzerland. In 2022, AS20473 is also an IPv6 transit critical AS for Great Britain.
Improve reliability by having two upstream providers
As always, our closing recommendation is that for any national segment (economy), city, business and even end user to have an acceptable level of reliability, it is necessary to have at least two upstream providers.
If you have any questions, feel free to contact us at radar@qrator.net.
Adapted from the original post that first appeared on Medium.
Alexander Kozlov is a writer at Qrator Labs.
The views expressed by the authors of this blog are their own and do not necessarily reflect the views of APNIC. Please note a Code of Conduct applies to this blog.