

Monitoring advanced networks connecting multiple distributed resources requires a tool to perform regular tests and provide ways to set network expectations as well as being easy to use and analyse.
perfSONAR is one such worldwide network performance monitoring tool developed by ESnet, GÉANT, Indiana University, Internet2, University Michigan, and RNP. It focuses on delivering multi-domain network performance measurement and monitoring with a particular emphasis on research and education networks (NRENs) and international data transfers.
Monitoring for user experience is important
As multi-domain applications have become increasingly popular, monitoring the network characteristics that determine the users’ quality of experience becomes important. The availability of measurement infrastructure within a particular domain automates and makes the troubleshooting process faster.
perfSONAR provides the tools to continually collect, archive and set alerts for active measurement test results. It also allows users to describe and configure a topology of tasks (how tests are interrelated and arranged), and define and publish the configuration of meshes (as a set of tests performed with other hosts) as visualizations, making for easy use and accessibility.
The major factor in why perfSONAR is so well suited as a distributed performance monitoring tool lies in the answer to the following questions and its open, modular, and extensible architecture.
- What key metrics are required to give us an idea of the network state?
- Do we have an easy way to manage the coordination, execution, and storage of network measurements?
- Is there an appropriate archival method?
- Do we have in-built visualization and an API to the stored data for easy integration with external visualization tools?
- And finally, is the infrastructure already deployed in various places?
Understanding the layers
perfSONAR comprises a set of components designed to measure, schedule, collect, store, and visualize data.
The layered structure starts at the bottom with different utilities responsible for carrying out the network measurements (tools to measure packet loss and one-way delay, throughput, network paths, DNS, and HTTP response time).
The scheduling layer consists of software, called pScheduler, which is responsible for:
- Finding time slots to run the measurements while avoiding scheduling conflicts
- Executing the tools
- Gathering results and sending these to the archivers
Community-developed plug-ins for tests, tools, archivers, or contexts (measurement environments) can be added. And the well-documented REST API allows easy integration of perfSONAR key functionality into new or already existing monitoring infrastructure.
The next archiving layer is a component named esmond, which stores measurement information as time-series data. It can be integrated into the measurement host or deployed as a single central instance for multiple measurement hosts.
The latest developments to perfSONAR will introduce storing data into the well-known OpenSearch suite adding even more data exploration, analysis, and correlation possibilities.
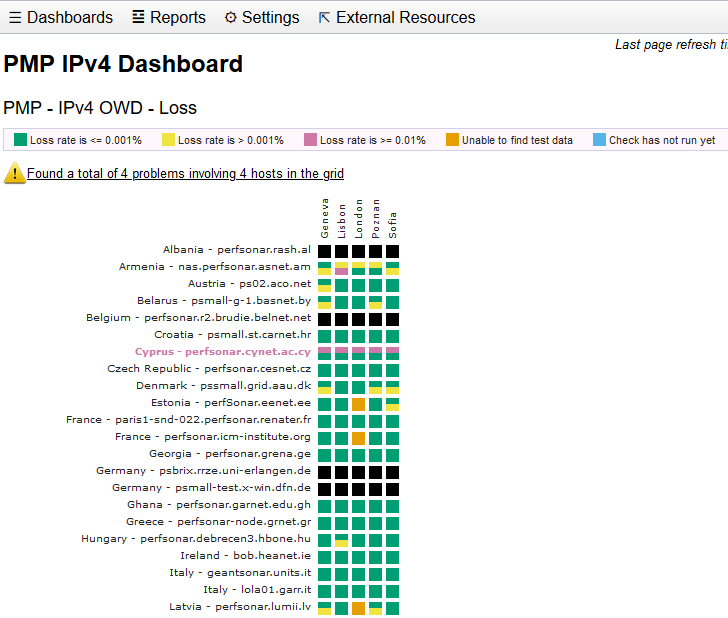
The configuration layer is where desired measurements are defined along with instructions on where to store them. This element, called pSConfig, provides agents to automate the configuration of multiple tasks defined in pScheduler in the form of various meshes and to maintain visualization components to display results of the measurements as a set of colour-coded grids (Figure 1), for example, showing a certain throughput level as green in the mesh.
Capturing current and historical data regardless of faults
Many network problems do not exhibit themselves as hard failures. For example, with the standard versions of TCP, only a very small packet loss rate is needed to dramatically reduce the throughput achieved, particularly for higher round trip times (as is the case with intercontinental data transfers). While a researcher’s data transfers may still work, such subtle faults will affect their ability to transfer data in a timely fashion.
By running perfSONAR measurement points alongside the endpoints between which data is transferred, the underlying behaviour of the network is captured, persistently, which provides insight into current and, importantly, historical evidence of network problems. Such evidence is important to assist engineers in isolating issues in a multidomain environment. Visibility of the results of network measurement tests and the constant availability of the perfSONAR measurements improve and speed up the process of debugging and fixing problems.
More than two thousand perfSONAR installations are currently available in the world, placed in various administrative domains as components of NRENs or virtual organizations (such as the WLCG infrastructure supporting the CERN experiments), many of which are available for open testing.
Deploying perfSONAR is easy
Installing and configuring perfSONAR is easy.
The most common installation type encountered will be the full Toolkit instance, which is a packaging of the perfSONAR measurement infrastructure and protocols, available as CentOS ISO, RPMs, or DEBs.
A default installation of the full perfSONAR Toolkit stack takes only a few minutes and provides all the necessary components to make the first step towards effective troubleshooting of network performance problems and easy access to the collected measurement data.
The GÉANT Project participates in this open-source software development. It delivers the Performance Measurement Platform (PMP) service based on low-cost hardware nodes with preinstalled perfSONAR software and is deployed in GÉANT-collaborating organizations in Europe and Africa. The project also contributes to global training and documentation efforts and provides users support and expert consultancy.
Problem troubleshooting
The following is an example of how perfSONAR helped to troubleshoot a performance problem in the UK.
In 2020, a Pan-STARRS astronomy researcher reported a backlog on their long-distance data transfers from Hawaii to Queens University Belfast due to poor throughput. Thanks to regular perfSONAR tests over time, the MaDDash historical data clearly showed poor throughput to these hosts — sometimes throughput would be multiple-Gbps, then it would fall below 10Mbps. Researchers also observed fractional loss, which given the high latency of this path, could have drastic effects on the performance.
Janet engineers used several perfSONAR hosts around the world to diagnose the problem and narrow down the faulty network segments. From this, they discovered an undersized buffer in Janet and a lag with errors on it.
Upon increasing the buffer and removing the faulty optics from this lag the graphs immediately improved. As a result, researchers were quickly able to resume timely copying of data from Hawaii to Belfast.
For more information see the website.
Szymon Trocha is a Head of the Network Management Unit in the Poznań Supercomputing and Networking Center, Poland.
The views expressed by the authors of this blog are their own and do not necessarily reflect the views of APNIC. Please note a Code of Conduct applies to this blog.