

When there is a problem in the network and the performance is lower than expected, it is good to have access to a tool that can provide network measurements between the endpoints involved. This why perfSONAR, a performance Service-Oriented Network monitoring architecture was developed — to monitor network characteristics that can give answers to users and researchers about what they can really expect and get from the network.
However, this is not going to be a typical presentation of the perfSONAR tool, because that story has been told many times. Instead, this post will focus on some other aspects of this monitoring infrastructure, as well as its community. The architecture, associated community, services, software components, technical infrastructure, and physical nodes and appliances comprise a unique endeavour with a wide outreach and users and stakeholders around the globe. There are about 2,400 publicly registered perfSONAR instances deployed worldwide, many of which are available to be used by anyone for open testing of key measures of network performance. For that reason, the perfSONAR developers and strategists want to learn more about the end users, their needs, and common settings and usage patterns.
When our developers started working on the new perfSONAR release, this information, collected and provided by the Lookup Service (LS), helped them choose which new measurement archive they would be using in the future. The obvious choice was Elasticsearch because it is a proven stable and efficient storage backend widely used and well-known in the research and education community. Well, we wrote Elasticsearch, but because of licensing incompatibilities, in the end, our developers decided to use OpenSearch, which is an open-source fork of ELK. It will be used as the default backend in the 5.0 perfSONAR release.
The LS itself has been moved to ElasticSearch recently rendering its API easier to use. Thanks to that and Grafana’s versatility we built new dashboards that report and visualize the perfSONAR community and the tool’s usage around the world.
When a new perfSONAR node is installed, the administrator of the node is asked for consent to publish some information about the node into the perfSONAR LS. The LS keeps the information about hosts, interfaces and instances of perfSONAR services. It registers collections of key-value pairs, ‘records’, which describe the perfSONAR ‘node’ elements. The records remain in the LS for as long as the corresponding perfSONAR instance is up. The LS can be queried using one or more key values in order to locate, examine and potentially interact with perfSONAR hosts, interfaces, and other related entities.
In Figure 1, you can see the hierarchy and the types of information that exist in the LS.
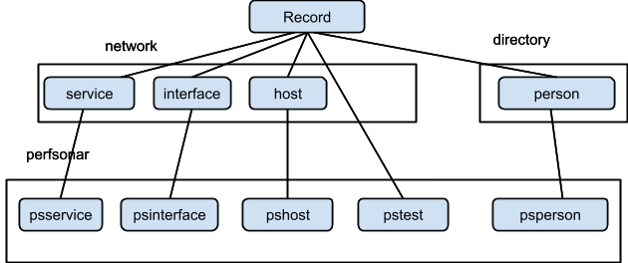
The LS defines a base ‘record’, and follows records of four different types that inherit the base ‘record’. Records of the second level are organized into two sets — network and directory. Records that are in the network set are further classified into three types — service, host, and interface, while the directory contains records of the ‘person’ type.
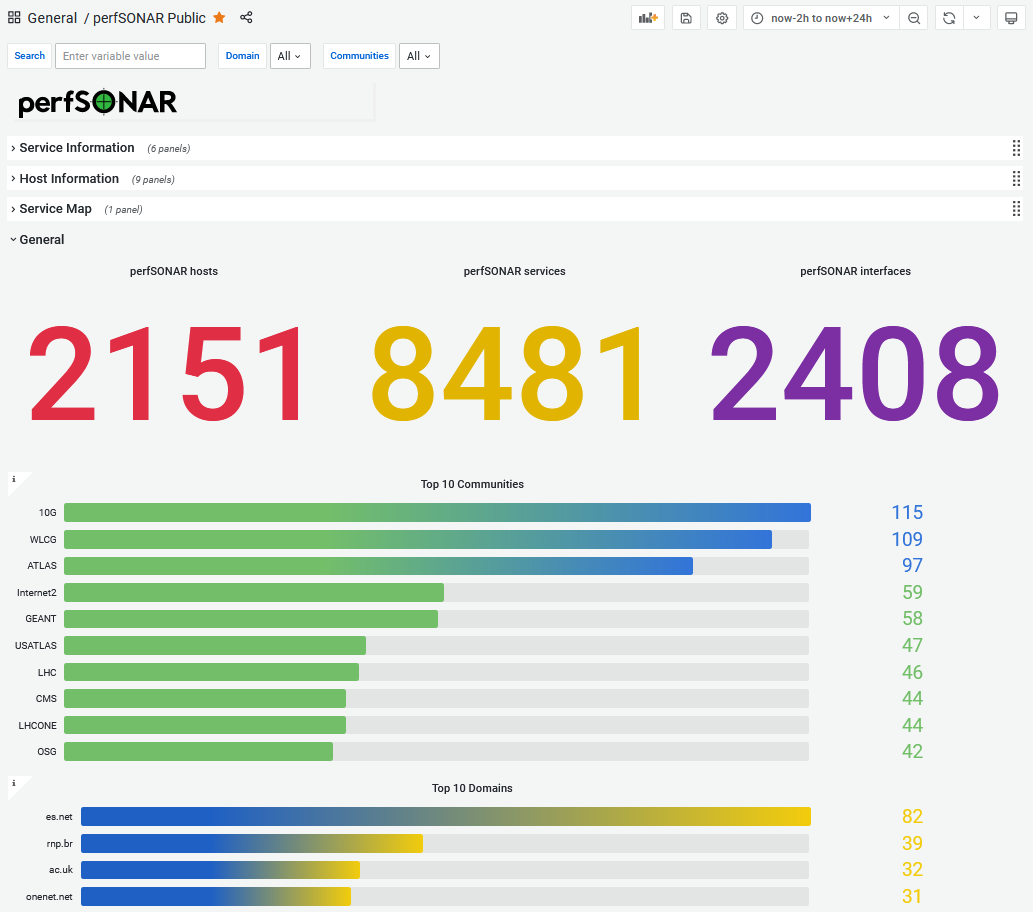
Figure 2 presents a part of the new public perfSONAR dashboard that has been built on top of the above-mentioned LS records logic. In this dashboard, you can search and find out about some general statistics regarding hosts, services, communities, measurement tests, and so on. We implemented a few filters to help you search for the specific information you need.
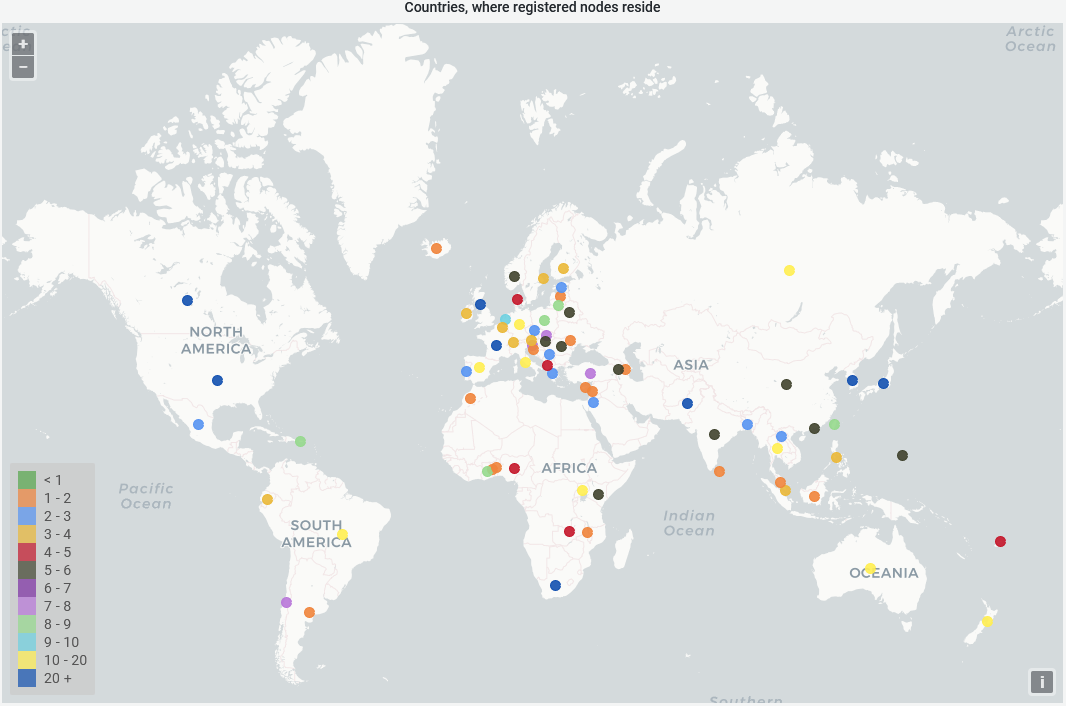
Maps are probably the best thing that we have implemented in our perfSONAR dashboard. There you can see how large the perfSONAR community is. Figure 3 shows a world map where the registered nodes reside and the number of nodes per economy.
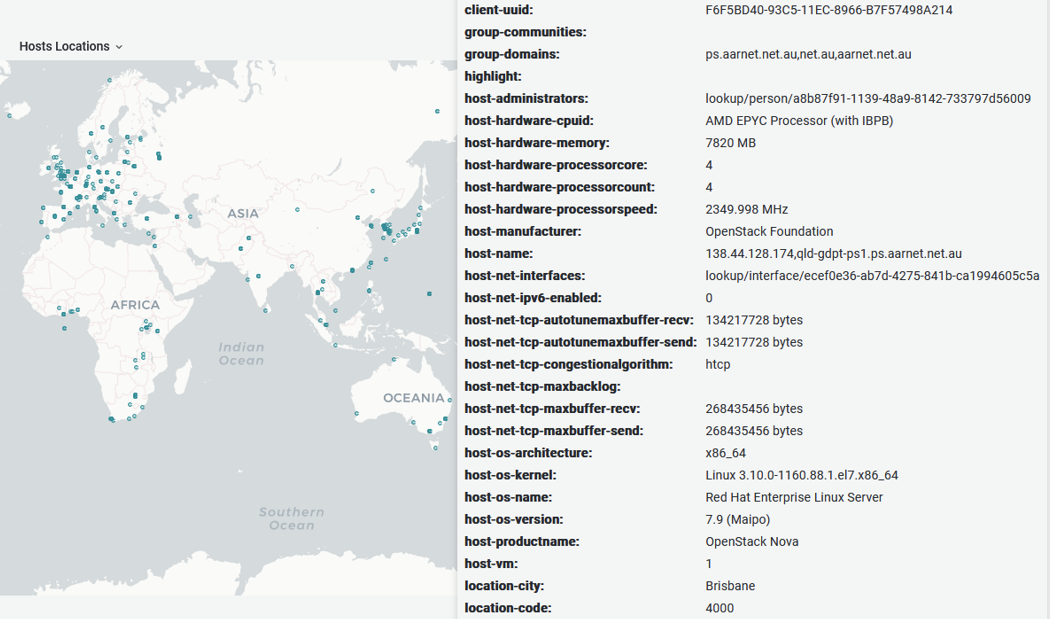
You can dig deeper by a node on the map. This will bring up all the information in the LS about that particular node.
You can now explore the public perfSONAR dashboard and its functionalities at stats.perfsonar.net.
If you have any comments or suggestions, or you want to see additional information in the dashboard, please contact us — we are always open and looking for new ideas to improve perfSONAR usage and help the community.
Andrijana Todosijević is the head of the user services department at the Academic Network of the Republic of Serbia — AMRES.
Katarina Simonović is a user services engineer at the Academic Network of the Republic of Serbia — AMRES.”
The views expressed by the authors of this blog are their own and do not necessarily reflect the views of APNIC. Please note a Code of Conduct applies to this blog.