

Segment Routing (SR) is widely used in Traffic Engineering (TE) because of its simplicity, scalability and resilience. However, like most things, there are drawbacks when it comes to balancing all these benefits, in this case, a reduction in network efficiency to compensate for network failure.
We at Tsinghua University, Fuzhou University and Shanxi University, recently investigated using novel probabilistic failure approaches to focus more on handling severe network failures instead of less severe failures to minimize the overall maximum link utilization.
As per our CNSM 2021 paper, our model (2SRPF) performs well with one threshold setting for different topologies consistently and gets close to optimal results when networks fail.
- Probabilistic risk management techniques may help decide the failure state set instead of including trivial failures, such as single link or double-link failures.
- The 2SRPF model takes both failure probability and network failure severity into consideration to improve efficiency without reducing resilience.
- The objective of using such models is to find the best routing configuration to minimize the expectation of Maximum Link Utilization of all severe states.
Considering network failure in SR-TE
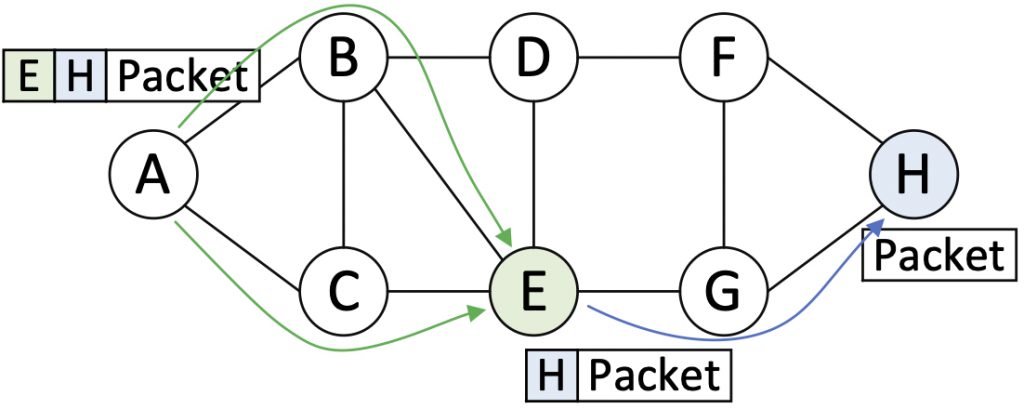
Traffic Engineering with Segment Routing (SR-TE) algorithms aim to compute suitable routing paths, that is, segment lists for each traffic demand to achieve some TE objective, for example, minimizing the Maximum Link Utilization (MLU). SR-TE usually uses a node segment that acts as a middle point in the packet header.
In Figure 1, node A inserts a segment list [E, H] in the packet header, indicating a middle point, E, and the destination, H.
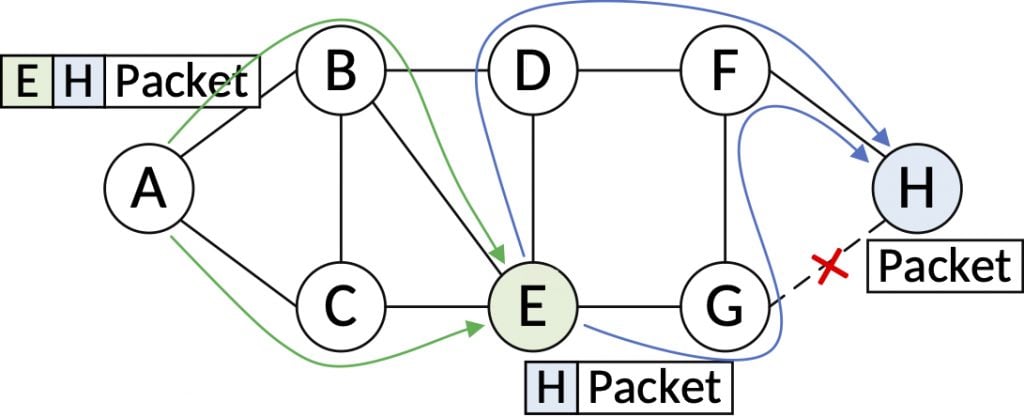
When facing network failure, SR resiliency can be achieved through Interior Gateway Protocol (IGP) failure recovery without additional configuration. This feature saves us from designing additional failure recovery mechanisms. Thus, SR is quite suitable for TE with network failure, especially when using proactive approaches.
For example, in figure 2, say link G-H fails and the original shortest path, E-G-H, no longer exists. IGP detects the failure and updates the link-state database, and the packet is still sent to node H along the shortest path(s) between E and H, that is E-D- F-H and E-G-F-H.
Taking a proactive approach to network failure
Proactive approaches usually choose to optimize the TE metric of the severe failure states. For example, Segment Routing with Restoration (SRR) minimizes the biggest MLU overall failures, while PCA2SR proposes that failure states with MLUs larger than a deterministic threshold Φ are severe and minimize their average MLUs. Effectively distinguishing severe failure scenarios may be a prerequisite for good TE performance.
TeaVaR, published at SIGCOMM’19, draws inspiration from probabilistic risk management techniques, including Value-at-Risk (VaR) and Conditional Value-at-Risk (CVaR). These originated from the financial industry to consider link failure probabilities based on historical data and uses probability as a measure of availability.
It’s thought that failure probability may help decide the failure state set instead of trivially including all single link failures, double-link failures and so forth, whereby probability can be used as an indication of failure importance. Intuitively, failures with higher probabilities are more important and noteworthy.
Distinguishing severe failures with a probabilistic threshold
Our research group proposed a method called 2SRPF, which takes both failure probability and severity into consideration. We think the severity of a failure comes from its comparison with the others.
If we sort all failure states according to their MLU, the ones with larger MLUs are severer and more noteworthy, and should be optimized for. As part of our approach we propose using a probabilistic severity threshold β to make the following decision: failure states with smaller MLUs with probability sums approximate to β are considered non-severe, and states with larger MLUs with probability sums approximate to 1-β are severe.
Figure 3 illustrates the deterministic threshold Φ proposed by PCA2SR. For a specific routing configuration (x), the horizontal axis represents the MLU of a network state q, that is, MLU(x, q), and each point represents a network state. Setting Φ to 0.8 means that states with an MLU lower than 0.8 (the green points) are non-severe, and states with an MLU larger than 0.8 (the red points) are severe. The objective is to find the best routing configuration (x) to minimize the average MLU of all severe states.
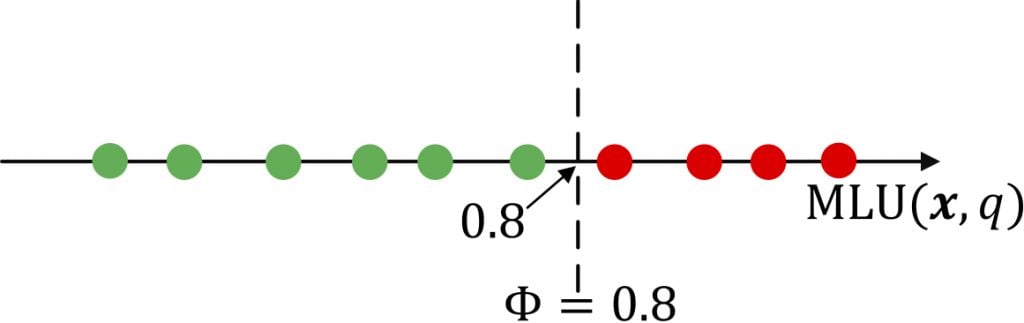
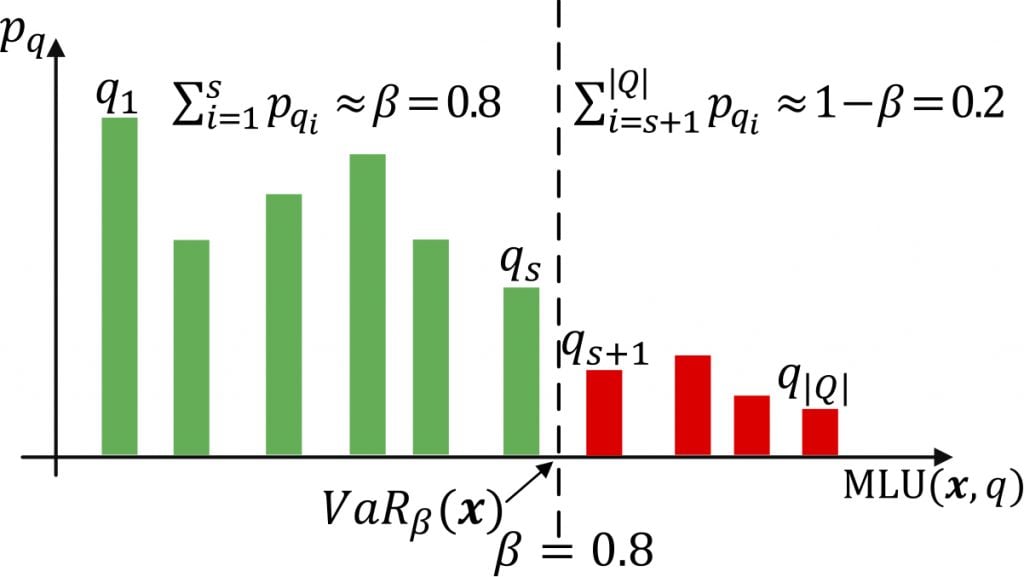
Figure 4 illustrates the probabilistic threshold (β) used by our method 2SRPF. The vertical axis represents the probability of a state (pq), and each column represents a network state.
Setting β to 0.8 means that states with MLUs that have a probability sum approximately equal to or greater than 0.8 are not severe, and states with an MLU that have a probability sum approximately equal to 0.2 are severe. The objective is to find the best routing configuration (x) to minimize the expectation of MLU of all severe states.
The appropriate deterministic severity threshold (Φ) is highly dependent on specific topologies and Traffic Matrices and relies on empirical knowledge. But our probabilistic threshold (β) is a probability value indicating the proportion of failure states to be considered severe. It depends on the optimization intentions of operators, not the topologies and TMs.
For more details and evaluations, please read our CNSM 2021 paper.
Ying Tian is currently a PhD candidate at the Department of Computer Science and Technology, Tsinghua University.
The views expressed by the authors of this blog are their own and do not necessarily reflect the views of APNIC. Please note a Code of Conduct applies to this blog.