

The Transmission Control Protocol (TCP) congestion control algorithm (CCA) governs how much data should be sent between clients and servers to maximize the use of available bandwidth and avoid congestion. Since its inception, other CCAs have been developed, such as Bottleneck Bandwidth and Round-trip propagation time (TCP BBR), and CUBIC. While TCP BBR and CUBIC aim to achieve congestion avoidance, understanding their effectiveness has been an ongoing mission for the engineering and research teams at Edgecast — the global multi-tenant Content Delivery Network (CDN) that I work for.
TCP BBR aims to achieve higher throughput by using packet delay as an indicator instead of packet loss. However, our previous research reported that BBR does not perform well in all cases. Specifically, our evaluation concluded there was little to no benefit in the throughput for small files (<100KB).
Read: BBR evaluation at a large CDN
Moreover, we observed BBR performance for flows with low round-trip time (RTT) and low retransmits was worse than CUBIC. Finally, the BBR benefits were only seen for client-facing traffic, while back-office connections (low RTT and negligible retransmits) performed better with CUBIC.
Edgecast delivers web traffic for many large (VOD and live) video streaming customers. Given that congestion control tunings using BBR for one customer can adversely affect another customer’s performance, and blanket enablement might result in degradation of performance in some scenarios, we implemented a mechanism to detect cases where BBR provides improved performance and can dynamically enable it for all CDN customers.
How it works
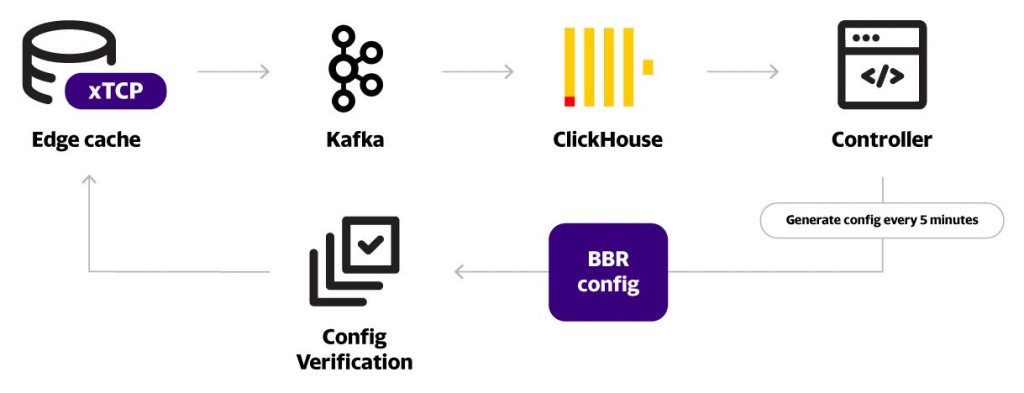
Perhaps the most important input to such a dynamic system is the data that powers it. Our dynamic congestion control tuning mechanism sits on top of our large-scale socket data collection, which exports TCP (xTCP) socket performance data from all the edge caches. Specifically, it extracts information from the Linux Kernel’s tcp_info structure via netlink and streams it via Kafka into a ClickHouse cluster.
Having this socket performance data at scale allows us to monitor the performance of the connections to our cache servers at very high granularity. xTCP has proven to be a powerful tool for many CDN optimizations. For example, we recently tuned our IPv6 initial congestion window and monitored the performance of gains using xTCP.
xTCP is similar to work done by Google Measurement Lab’s (M-Lab) tcp-info tool with significant differences coming from optimizations needed to manage the large number of sockets seen by our edge caches (compared to M-Lab servers) and the ability to export the data in protobuf format. Stay tuned — we plan to open-source xTCP soon.
Figure 1 provides an overview of our system. xTCP data is collected at scale from all our edge caches streamed into Kafka. This is then collected in a ClickHouse cluster, which powers our network data analytics, including the BBR controller, which detects the underperforming prefixes at each edge PoP.
While we want to maintain the dynamic nature of our workflow, we also need to make sure we select consistently under-performing prefixes at each edge point of presence (PoP) to avoid flip-flopping between CUBIC and BBR over short durations. And, as previously noted, we selectively activate BBR for requests where the file size is greater than 100KB. A fine-tuned CUBIC flow performs better for small files.
The BBR controller uses two metrics to assess the health of every observed client prefix:
- Duty cycle: How long was a prefix (/24 or /56) in the bottom 20th percentile performance group?
- Flap rate: How often does the prefix appear and disappear from the bottom 20th percentile performance group, that is, change of state?
The algorithm then consistently detects worse-performing prefixes over the past few hours. This detection runs every five minutes.
While the total number of prefixes selected per edge PoP could be in the hundreds, we observed that prefix performance remains relatively consistent. The same prefixes are regularly selected, and new additions in each round (as shown in the following figure from the Chicago PoP) are very few.
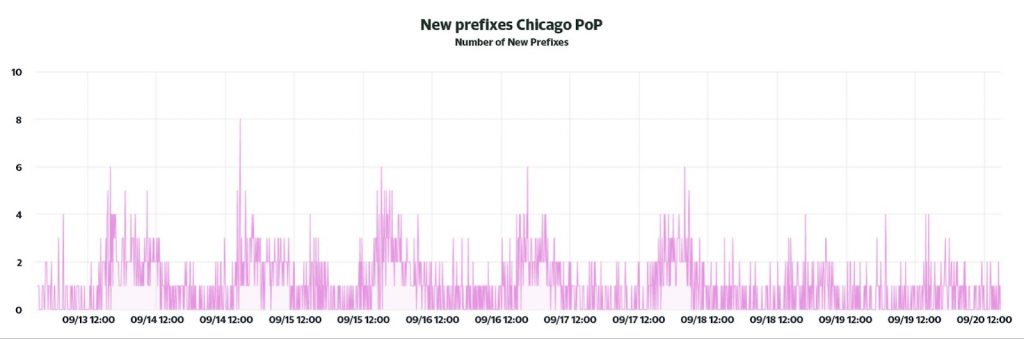
New prefixes, if any, are selected to enable BBR, and a configuration is generated that is passed through a validation step and pushed out to our edge caches globally.
Performance gains
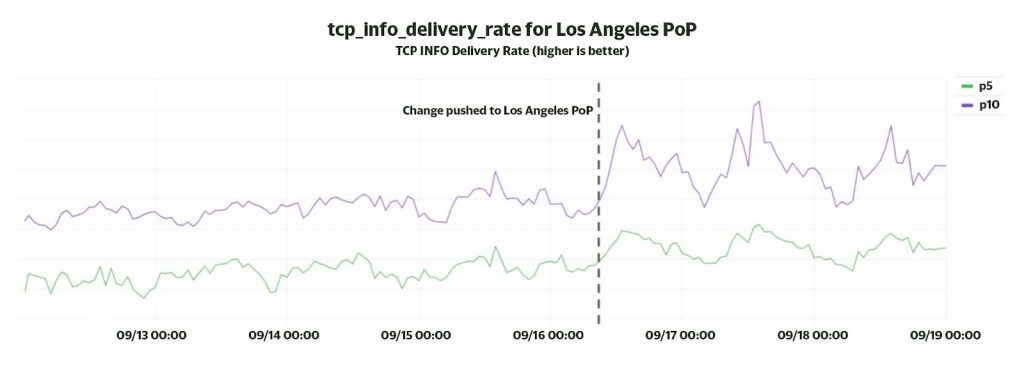
Enabling BBR across our edge worldwide has provided us with considerable performance improvements. A key metric we track from the xTCP socket data is the delivery rate reported in TCP_INFO. Since we dynamically enable BBR for the most underperforming prefixes, we expect our lower percentile (worst case) delivery rate to improve.
Figure 3 shows the improvement in the 5th and 10th percentile delivery rate at our Los Angeles PoP as soon as the BBR change was enabled.
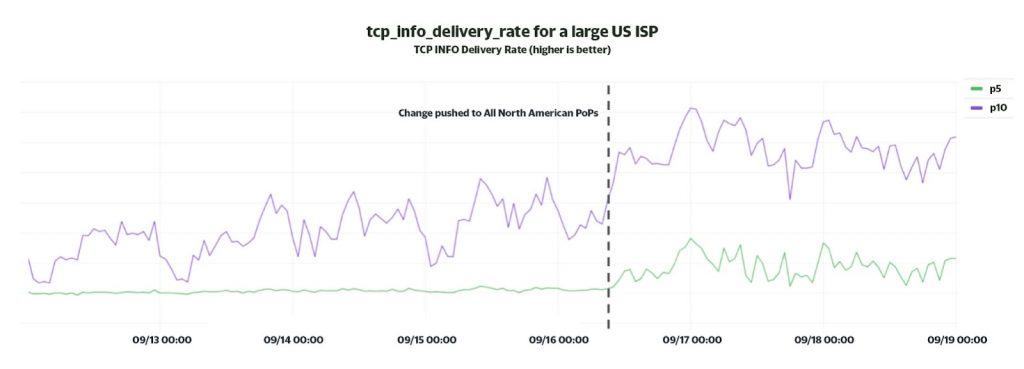
Similarly, Figure 4 shows considerable improvement (~2x) in the lower percentile delivery rate for a large residential ISP in the US as soon as we dynamically enabled BBR at all of our North American PoPs.
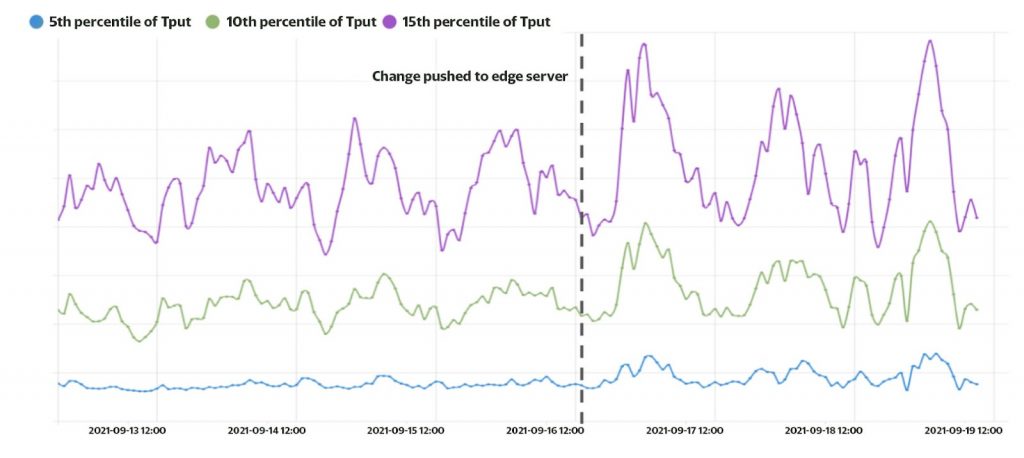
The delivery rate extracted from tcp-info provides a good estimate of performance seen by the client. However, the most accurate indicator of performance is the throughput seen in the HTTP access logs for the client connection, that is, goodput.
We measure the goodput from an edge cache server. As shown in Figure 5, the change resulted in increased goodput. Overall, the 10th percentile goodput increased by 12%.
Special thanks to the BBR development team at Google for their amazing work on BBRv1 and their continued effort on BBRv2. We look forward to BBRv2 and will continue to push relevant changes to our platform shortly.
Kudos to Sergio Ruiz, Joseph Korkames, Joe Lahoud, Juan Bran, Daniel Lockhart, Ben Lovett, Colin Rasor, Mohnish Lad, Muhammad Bashir, Zach Jones, and Dave Andrews at Edgecast for supporting this change during development, testing and rollout. Our engineering team would especially like to thank Dave Seddon for his contributions to the development of the xTCP tool that powered much of this analysis.
Leave a comment if you’d like to know more about this project and stay tuned for open-source xTCP.
Contributors: Kenji Noguchi (Edgecast)
Adapted from original post which appeared on the Edgecast Blog.
Anant Shah is Principal Architect at Edgecast.
The views expressed by the authors of this blog are their own and do not necessarily reflect the views of APNIC. Please note a Code of Conduct applies to this blog.