

For the past 25 years, network engineers have had one simple answer for home users who want to improve the quality of their Internet experience (QoE): increase your connection throughput (speed). But in recent years, some of us have recognized there is another important factor at play — latency.
This has been put into stark relief during the COVID-19 pandemic and goes some way at explaining why users with a connection that is hundreds of megabits per second or even one gigabit per second still experience problems whilst video conferencing.
Network engineers have long recognized the importance of latency, chiefly measured by Round Trip Time (RTT) between a user and a destination server. It is a key element to the rise of Content Delivery Networks (CDNs) to push content closer to users and reduce RTT, among other advances to improve user QoE. But in most cases, this has been measured by pinging from a client to a server while a connection is not being used, which can be thought of as ‘idle latency’.
A solution to this problem is to deploy Active Queue Management (AQM), which will dramatically improve user QoE, as I’ll explain in this post.
Idle latency isn’t the main performance challenge facing users today
Latency is a simple concept — it’s another word for delay — typically measured in milliseconds. This is the time lag between when you ask for something on the Internet, such as clicking a web link, and how long it takes to respond to your request.
Idle latency reflects primarily differences in ISP access network technologies and path distance between a user and a destination. For example, fibre to the home will likely have the lowest idle latency while geostationary satellite will have much higher idle latency. And the RTT between a user in Chicago and a destination in Denver will be far shorter than to a destination in Tokyo. But for most users right now, the differences between the idle latency of one access network type to another are largely inconsequential as compared to the dramatic impact of working latency on their day-to-day user experience.
Of course, some aspects of idle latency are interesting when working to reduce path distance as networks are optimized. ISP networks are evolving to more localized interconnection (for example, in larger numbers of cities rather than a few points nationally) to reduce the length of internetwork paths and thus lower RTT to popular destinations. But for the day-to-day experience of end users, idle latency does not explain why they sometimes experience moments of poor application-layer QoE.
For example, looking at the June 2021 Measuring Broadband Australia report (Figure 1), Aussie Broadband had an average idle latency of 9.9 milliseconds. The average for all providers was roughly 13 milliseconds according to that report, which is similar to data derived from RIPE Atlas.
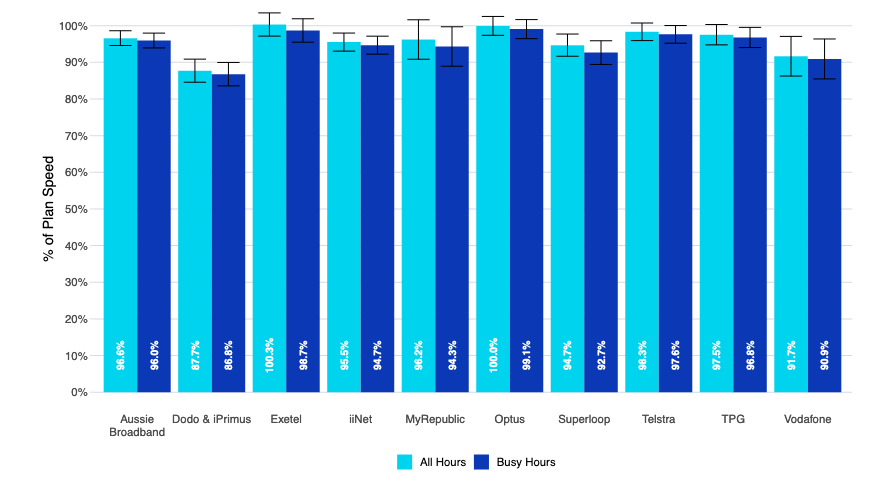
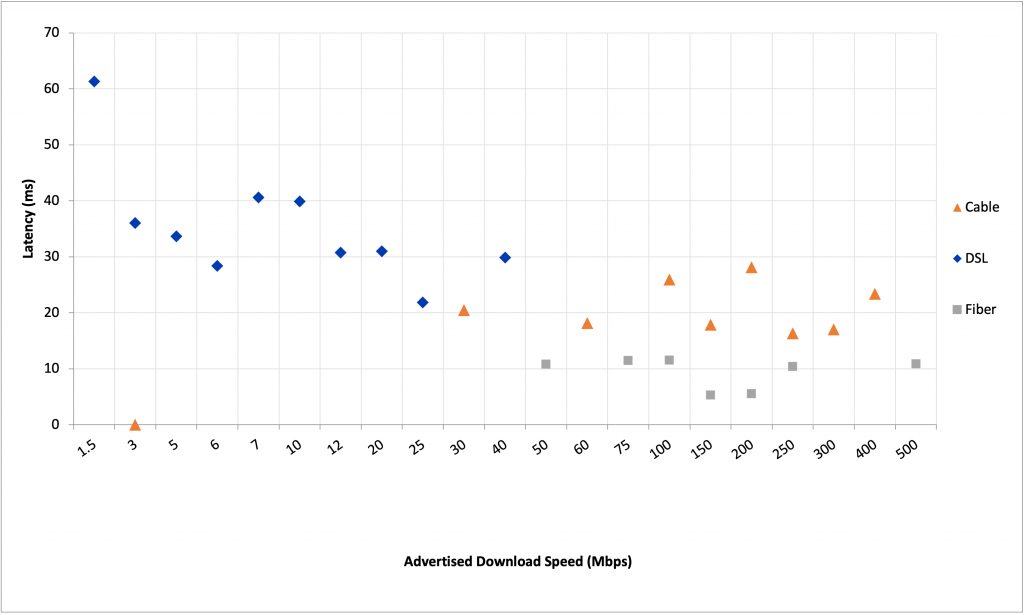
Having an idle latency one-third less than the average might suggest a comparatively better QoE, but that is not the case in the real world when we consider that working latencies vary by hundreds to thousands of milliseconds! As well, looking at the January 2021 Measuring Broadband America report (Figure 2), we see a similar pattern of slight differences between idle latencies of fixed networks.
This is not to say that idle latency isn’t interesting — it is. But for users in the real world, the differences between the idle latencies of various fixed-line Internet access services just don’t matter all that much.
Shifting the focus to ‘working latency’
A new way to measure real-world latency — referred to as working latency — is to look at what happens to latency as a connection is used. But contrary to what you may think, you needn’t fully use your connection’s capacity to see potentially dramatic increases in working latency, as this can happen under normal usage conditions! Your idle latency may start at 15 milliseconds and hit hundreds of milliseconds or even several seconds of delay. And the more variable that working latency is, the harder it is for applications to adapt.
Confusingly, to end users, this ends up feeling like everything is working well most of the time but every so often there’s an odd performance problem that soon goes away before you think much about it. As a result, we’ve been conditioned to simply accept ‘that’s just how the Internet works’. For example, I am sure you can recall when you were in a Zoom call and for a few seconds the video quality declines, and/or the audio goes out of sync or drops, but before you know it everything is back to normal. What the heck happened? You probably experienced a working latency problem but didn’t know it.
Network buffers got bloated
For a very long time, the whole networking industry got buffer sizes wrong. The assumption was that to provide good QoE, network buffer sizes should increase as connection speeds increased.
The industry also consistently created fixed-sized buffers to handle the maximum throughput a device could handle in the lab, rather than right-sizing them for the actual range of deployed speeds. Oops!
Finally, the industry thought you could choose either high throughput or low latency but you couldn’t have both. Guess what? That’s also wrong!
As buffers got too large, they became bloated, which we now call buffer bloat. In short, every network link along the path from end-user to destination site has a buffer. The only buffers that matter are those where there’s a difference between how much traffic is coming into a device or link, versus how much can go out. For most end users with a wired connection that will usually be the link to the ISP access network (traffic from the home to the ISP), to the home (traffic from the Internet into the home), or within their in-home Wi-Fi network (bi-directional traffic flows over Wi-Fi).
You can imagine this point in the network as a funnel that is wide at the top and narrower at the bottom. Historically the top of the funnel was made ever larger so that no water spilt over the top (no packet loss). Unfortunately, as buffers grew this meant that the time when water entered the top of the funnel until it went out the bottom grew longer. Latency — or delay — increased. This often meant several seconds of delay for some applications. That perhaps matters little to large file downloads, but it is frustrating when you want to start streaming a video, skip ahead in a video, or make a FaceTime or Zoom call.
Part of the misunderstanding over buffer sizes was due to the belief that packet loss was bad and must be avoided. Unfortunately, moderate amounts of packet loss are critical to maximizing QoE because this allows protocols to constantly try to send at greater rates. As soon as packet loss occurs this is a critical control signal back to the sender that the maximum rate has been reached. This acts as a bit of back pressure to the sender. The sender can then keep sending at that high rate, making the most of the available capacity. Subsequent packet loss may indicate new flows have started to demand access to network capacity and so this loss is once again a control signal back to the sender to further moderate their send rate.
So, a little packet loss helps you maximize the full use of your connection and helps ensure your network quickly adapts as you use different applications.
In practice, you can imagine that if your only current use of the network was to download a new game, then you’d want that to maximize the full capacity of your connection. The download server will keep trying to send more and more data at the same time until you start to lose a bit (which will be resent), essentially saying ‘you are now maxing out my connection’ to the server. But then you may begin a Zoom meeting, make a FaceTime call, or start watching a video stream, and as those applications begin using the network, the game download should back off a bit to provide capacity for Zoom, FaceTime, or streaming. All of that occurs because packet loss is used as a control signal between the end user and the destination server.
Unfortunately, while that signalling certainly works, there are challenges in mixing delay-sensitive and delay-tolerant flows, and there are ways the network can work better for all end users. More on that later…
Network latency budgets
In the earlier video conferencing example, an end user experienced a periodic issue. What likely happened was that the application had an end-to-end latency budget of 580 milliseconds. But the application itself, including the client and server interactions and processing, may need half or more of that budget. One firm has suggested that for video conferencing applications, this leaves a resulting budget of 130-340 milliseconds (ms) of round-trip delay for the network, shown here in Table 1.
| Application | Audio Processing Delay (ms) | Network RTT Allowance (ms) |
| Zoom | 360 | 220 |
| Slack | 300 | 280 |
| Google Meet | 450 | 130 |
| WebEx | 240 | 340 |
| Teams | 340 | 240 |
Table 1 — Average audio processing delay and network RTT allowance per application (NetForecast report).
Given that most fixed network idle latencies are below 30 milliseconds you may think all is well. But working latency may range from 15 milliseconds to 700 milliseconds or even much more. When that working latency is below the network latency budget, all is well, but periodic spikes in working latency above this network latency budget explain the periodic QoE problems users experience with these applications.
Application protocols adapt well to changes in bitrate, not latency
Applications like video streaming use what are called ‘adaptive bitrate’ streaming protocols. This means they can, for example, provide a good streaming experience on your mobile phone while you are travelling in a vehicle at a relatively modest and variable bitrate. And, when you are using fixed Wi-Fi or your network at home, it can provide a great high bitrate 4K video experience. Similarly, real-time communications protocols that underlie applications such as Zoom and FaceTime, enable you to communicate across a wide range of network types and conditions, often working well over very low bit rate wireless connections. The fact that these applications work over low-bitrate mobile wireless connections as well as high bitrate fixed connections, yet still suffer QoE problems is strong evidence that the key to application QoE here is not bitrate.
Looking into it further, we can see that these applications don’t do as well at adapting to dramatic changes in latency. The result is easily perceptible to users — a ‘buffering’ message when watching a video, or frozen video or dropped audio in a video conference. Video streamers create application buffers on your client and send you chunks of video data before it is needed but skipping ahead in the video will usually cause a perceptible delay for users (two or three seconds to skip ahead and start streaming again). And in a conference call, usually, something like Forward Error Correction (FEC) is used to ensure data is sent reliably; this often consumes a lot more bandwidth than would be necessary with a more responsive network.
To use a different example of online video games, First-Person Shooter (FPS) games are sensitive to latency due to the real-time nature of the gameplay. Some games use lag compensation to equalize the delay of all players in a game so that certain players are not advantaged (or disadvantage). But if that lag (latency) is highly variable, this works less effectively. Lag compensation is also used in other applications, so this observation is not necessarily limited to gaming.
Many of today’s popular applications can be designed to handle a wide range of bitrates — but struggle when working latency becomes too high or too variable.
The 99th percentile matters, not mean or median
It is also worth noting that in many performance measures such as idle latency or speed tests we focus on mean or medians. While that can be useful for those measurements, when it comes to working latency, we need to throw mean and median out the window so to speak and focus instead on the 99th percentile (whether to use the 98th, 99th, or 100th percentile is still in debate, as noted in a recent paper for the Internet Architecture Board’s Measuring Network Quality for End Users workshop). That is because this shows the near worst case working latency and because latency does not tend to follow a normal distribution as some of those other network measures do. Therefore, since the distribution of performance is so very different (often multimodal), looking at the 99th percentile can be informative.
Thinking back to the network latency budget for video conferencing described in Table 1, it will tell us whether we can be sure that the connection will always be able to work within that budget if there are changes in traffic patterns. If you wanted to use Zoom and your median working latency was 200 milliseconds, you may think all is well given that is within the network latency budget of 220 milliseconds. But if your 99th percentile working latency was 750 milliseconds, this far exceeds the network latency budget for that application and you could anticipate having inconsistent and periodically poor application QoE.
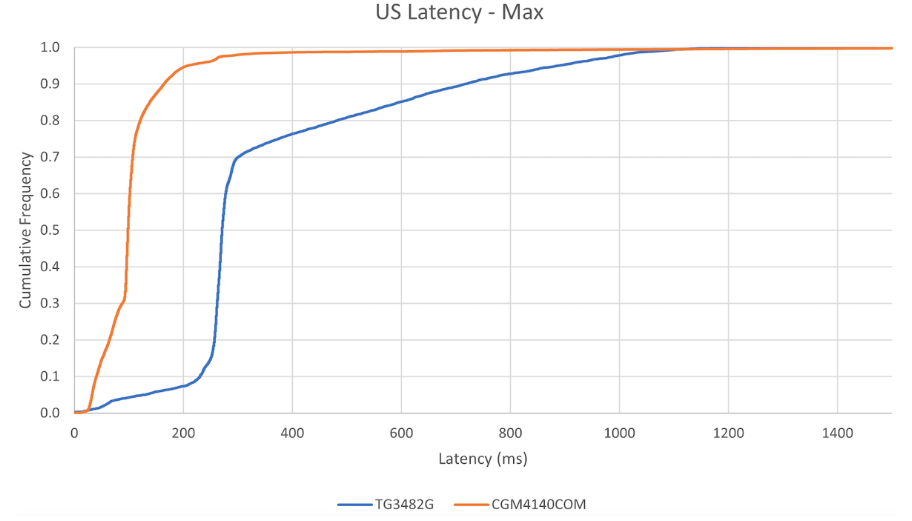
A good way to visually represent this is through a Cumulative Distribution Function (CDF) chart so you can better understand the range of performance across a population of devices, especially since latency is not typically normally distributed. A CDF also helps you spot outliers in the data, which is especially useful for latency where there may be clusters of high latency at the far tail of the distribution. For example, Figure 3 shows the maximum working latency of two different equivalent cable modems, one with AQM and one with an older method of managing buffers (both now have AQM).
For those unfamiliar with reading a CDF chart, the chart line shows you the percent on the vertical Y-axis, from 0% (0.0) to 100% (1.0). On the horizontal X-axis, you have the latency measured in milliseconds. In this case, we can see that the device represented by the orange line will experience working latency of 200 milliseconds or less roughly 95% of the time. In contrast, the device represented by the blue line will experience a working latency of 200 milliseconds or less 8% of the time and 10% of the time its working latency will reach 700 milliseconds or higher. That the orange line is more vertical also suggests more consistent latency (less jitter) than the blue line.
It is also important that working latency is consistently low, which means it shouldn’t vary dramatically from moment to moment (that is, there should be low jitter and low working latency). As a result, the network provides applications with consistently good working latency.
Enter AQM
There are a variety of things users can do to improve their working latency. But one thing that home network equipment developers and ISPs can do right now is to implement AQM. This technology improves the queue behaviour on a given interface by monitoring the depth of a queue (delay) and then using small amounts of packet loss or Explicit Congestion Notification (ECN) to signal back to a sender about network conditions, in order to maintain high throughput as well as low delay. There are a variety of AQMs available depending upon the operating system or what type of chipset is used.
I recently co-wrote a paper about the performance of AQM on Comcast’s network in the United States during the COVID-19 pandemic. I presented this in a lightning talk at the Internet Research Task Force (IRTF) Measurement and Analysis for Protocols Research Group (MAPRG) meeting session at the 111th meeting of the Internet Engineering Task Force (IETF).
To sum up, the paper simply, turning on the AQM functionality within the Data Over Cable Service Interface Specification (DOCSIS) 3.1 standards reduced upstream working latency by roughly 90%, from upwards of 250 milliseconds to between 15-30 milliseconds (and this is for all ‘best efforts’ Internet traffic, not a subset of traffic and not relying on DiffServ prioritization). Importantly, this also improves latency — we found the most critical negative factor on our users’ QoE and reduced that by a jaw-dropping 90%. Wow!!
In short, AQMs are available now; they work well and will markedly improve user QoE.
But Wi-Fi is the next bottleneck
As ISPs and home network equipment vendors improve their devices and networks with AQM, the next area to improve will be the working latency of the Wi-Fi home network. There is much work to be done here, as research has shown, due to the underlying wireless protocol used by different types of Wi-Fi potentially having extensive queuing that is outside of the queue that AQM can control higher up in the protocol stack.
Thankfully, it appears that the newest Wi-Fi 6E standard will improve working latency performance.
Beyond current AQMs to very low latency
Moving from the status quo to AQM is a huge improvement in user QoE, with many network latencies improving to 15 to 30 milliseconds. Currently under discussion at the IETF in the Transport Area Working Group (TSVWG) is a proposal for Low Latency, Low Loss Scalable Throughput (L4S). This potential approach to achieve very low latency may result in working latencies of roughly one millisecond (though perhaps 1-5 milliseconds initially).
As the IETF sorts out the best technical path forward through experimentation and consensus-building (including debate of alternatives), in a few years we may see the beginning of a shift to sub-5 millisecond working latency. This seems likely to not only improve the QoE of existing applications but also create a network foundation on which entirely new classes of applications will be built.
While we can certainly think of usable augmented and virtual reality (AR and VR), these are applications we know about today. But what happens when the time to access resources on the Internet is the same, or close to the time to access local compute or storage resources? What if the core assumption that developers make about networks — that there is an unpredictable and variable delay — goes away? This is a central assumption embedded into the design of more or less all existing applications. So, if that assumption changes, then we can potentially rethink the design of many applications and all sorts of new applications will become possible. That is a big deal and exciting to think about the possibilities!
Your future Internet connection
In a few years, when most people have 1 Gbps, 10 Gbps, or eventually 100 Gbps connections in their home, it is perhaps easy to imagine that connection speed is not the only key factor in your performance. We’re perhaps entering an era where consistently low working latency will become the next big thing that differentiates various Internet access services and application services/platforms. Beyond that, factors likely exceptionally high uptime, proactive/adaptive security, dynamic privacy protection, and other new things will likely also play a role. But keep an eye on working latency — there’s a lot of exciting things happening!
Jason Livingood is Vice President of Technology Policy and Standards at Comcast.
Discuss on Hacker NewsThe views expressed by the authors of this blog are their own and do not necessarily reflect the views of APNIC. Please note a Code of Conduct applies to this blog.
We used to address this: My first video conference over the Internet was in January 1988. It used ST-II at the “IP” layer.
I have a 10 MBPS modem connection over a phone line from my local telephone company that costs $45/month. A 1 GIG connection is perhaps 100,000 times faster. The cost in that arena would be astronomical. Us poor slobs in the rural areas will never see such speeds and if we do, the cost will be prohibitive.
Latency is getting attention only recently?
Back in 1996, Stuart Cheshire posted his now famous rant – “It’s the Latency, Stupid”
http://www.stuartcheshire.org/rants/latency.html
Serious attention with the rise of covid and videoconferencing.
Stuart Cheshire is widely regarded as the “Godfather” of the bufferbloat movement, and is still in the game, recently getting apple to release a networkQuality test in the latest iOS and OSX release.
The point of the new AQM tech, to me, is low latency at any, even variable, bandwidth. Pie and fq-codel reduce induced latency by 10-100x. This is what we accomplished for wifi, 5 years back (code is now mainline linux kernel)
https://blog.cerowrt.org/post/real_results/