

The year 2020 has been like no other for the Internet. Thanks to governments across the world enforcing extensive work-from-home orders, often concentrated workforces have been spread to the edge of residential and rural networks.
This has provided researchers with a chance to study the performance of last-mile connectivity, which is often used to gauge the quality of experience of regional and national broadband networks. One such study, led by IIJ Research Lab, in collaboration with Verizon Digital Media Services, investigated last-mile latency using traceroute data from RIPE Atlas probes located in 646 Autonomous Systems (ASes) and looked for recurrent performance degradation.
As we reported at the Internet Measurement Conference (IMC 2020) in November, we found that in normal times Atlas probes in only 10% of ASes experience persistent last-mile congestion but we recorded 55% more congested ASes during the COVID-19 outbreak. This deterioration caused by stay-at-home measures is particularly marked in large eyeball networks and certain parts of the world.
Last-mile congestion in large eyeball networks
Figure 1 depicts measured last-mile queuing delay for two major ISPs, Comcast in the US (AS7922) and NTT OCN in Japan (AS4713). The x-axis shows the time of the day (UTC) and the y-axis is the median last-mile queuing delay in milliseconds. Here, we selected four measurement periods, three are in 2019, to understand the usual last-mile latency for these networks before the pandemic, and one in April 2020, to measure the impact of the COVID-19 outbreak on last-mile latency.

In 2019, both networks showed consistent daily patterns with a small delay increase during evening peak hours. For Comcast, the last-mile latency in 2020 has moderately increased. The pattern has also changed: higher latencies are observed during both daytime and evening.
Read: TCP congestion signatures
For NTT OCN, the pattern has also changed, but more importantly for this network, the last-mile queuing delays have significantly increased, indicating potential last-mile congestion in this network. This is not unique to NTT OCN; we made similar observations for several Japanese networks, including IIJ (AS2497), and found that Japan was the most impacted economy in our study.
Last-mile congestion in Japan
With the help of MLab NDT data, we confirmed the presence of performance degradation during stay-at-home measures. Figure 2 shows the median throughput for clients in AS4713, before (January 2020), during (April 2020), and after (June 2020) the first wave of the COVID-19 pandemic in Japan.
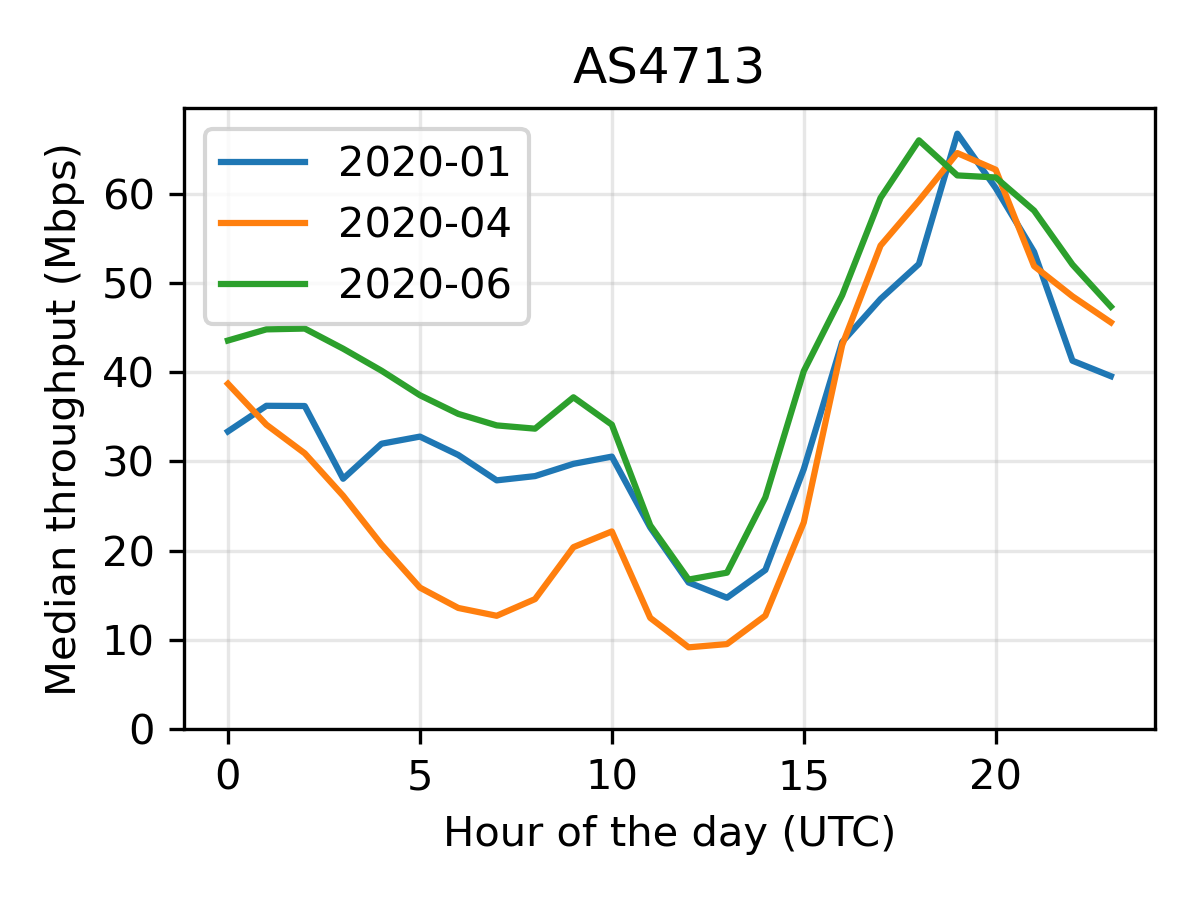
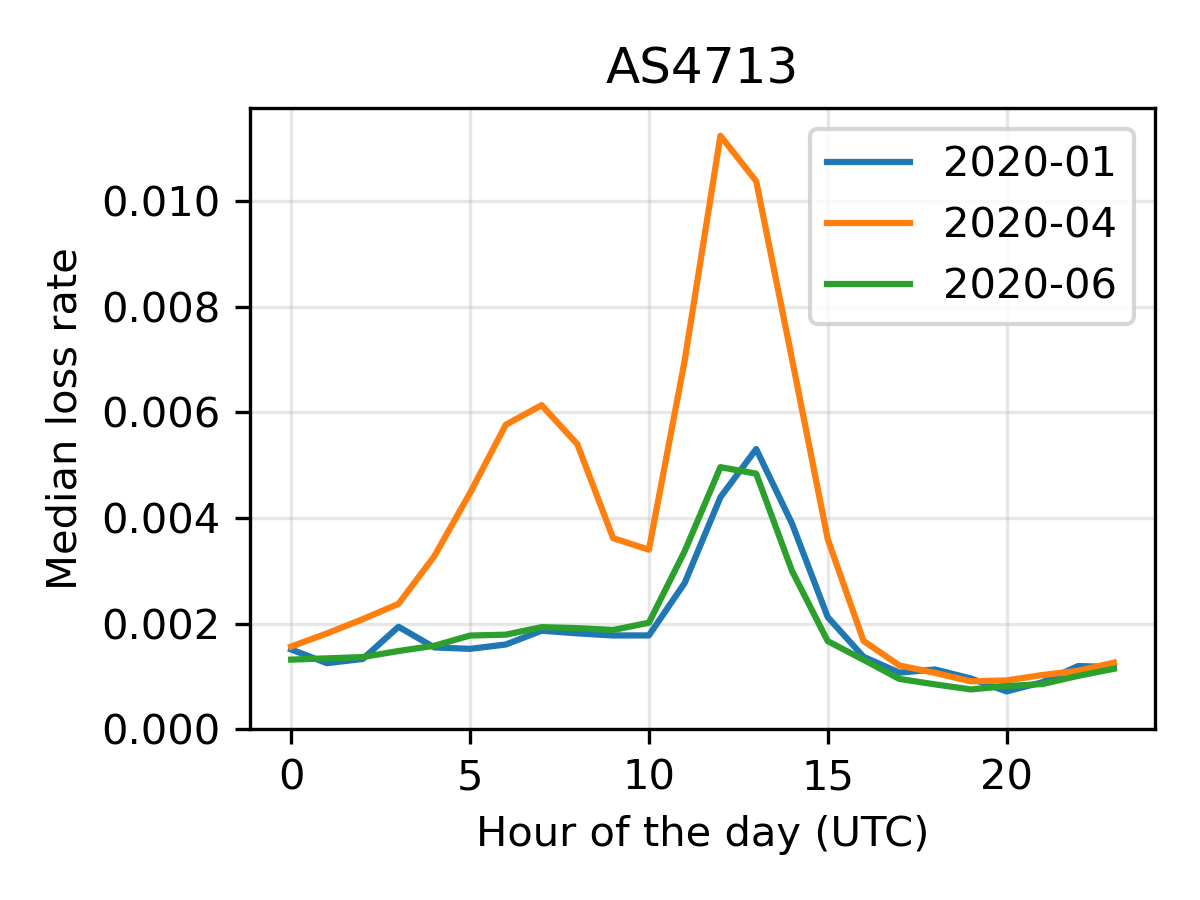
The most striking difference is the throughput drop at daytime during the pandemic (the orange line from 5:00 to 9:00 (UTC)). This change coincides with the last-mile delay increases observed with Atlas (Figure 1 right plot) and packet loss surges observed in MLab data (Figure 2b right plot). Notice that these three quantities at that time are at the same level as what we usually observe during evening peak hours before the pandemic.
Interested readers can refer to our research paper for further investigations on Japanese networks. Using CDN log data we compared different access technologies and narrowed down the problem to the extensive use of the shared legacy infrastructure over Point-to-Point Protocol over Ethernet (PPPoE). We also found that wired broadband throughput for some ISPs is consistently lower than LTE during peak hours.
The new normal
Perhaps the most telling outcome of the study demonstrates the true robustness of the Internet to handle the excessive load with performances exceeding those before the pandemic (green lines in Figure 2a). In Japan, we’ve theorized that this is partly due to the deployments originally planned for accommodating the Tokyo Olympics, and more generally, it reflects the efforts of network operators to cope with these exceptional circumstances.
The pandemic has demonstrated that its adaptive design and proficient community can keep the Internet operational during such unprecedented events. Also, from the numerous research and operational reports recently published, the pandemic is apparently shaping a more resilient Internet.
More details about this work are available in our IMC publication and presentation video. All results and source code are available for download.
Romain Fontugne is a senior researcher at IIJ Research Lab, Japan, who focuses on Internet measurements, traffic analysis, and network security.
The views expressed by the authors of this blog are their own and do not necessarily reflect the views of APNIC. Please note a Code of Conduct applies to this blog.
Thanks Romain, this is a great post.
It’d be very interesting too see relative performance of private IPv4 (NATted) vs public IPv4 vs IPv6 in the last-mile/first-hop.
Is that data available, for a possible follow-up post here?
Paul.
Thanks Paul, that’s an interesting question. We haven’t looked at that.
For private/public IPv4, that’s something we can definitely do. But I am afraid most of the Atlas probes with a public IP are setup by operators in the ISP premises so it may not really be representative of the typical residential connection (we did filter some of the atlas probes for that purpose).
For IPv6, it is a bit more tricky to find the last-mile in the traceroute, we haven’t done that yet. That’s surely part of the next steps for this work.