

The Quality of Experience (QoE) level for an Internet Service Provider (ISP) is the client’s level of satisfaction using the Internet for a variety of applications.
From a client’s point of view, this indicates the overall Internet quality, based on which the service provider is judged. Clients may decide to either renew or cancel service contracts based on the QoE they have.
It sounds simple, but it’s actually quite difficult for ISPs to measure QoE. Usually, they monitor Quality of Service (QoS) by using the ICMP protocol to measure delay, or they try to measure download rates to check the supported bandwidth rate of their services.
These types of measurements are mostly carried out from a network engineer’s point of view, or from the monitoring server’s side, and don’t actually reflect the quality that the clients or users have experienced.
For example, a client might call customer support and say, “Everything seems fine, except for WhatsApp. It’s taking longer than usual to download videos.” At the ISP end, the technician might check the user’s line quality, and try to check the delay to WhatsApp by using an ICMP ping, and might not find any problem.
So who’s right? The non-technical client? Or the network engineer in the network operation centre? The answer? Well, both of them. However, the network technician can’t get to the root of the issue easily and also has no means to proactively detect the issue, even if many clients are experiencing the same problem at the same time.
TCP RTT Analyser
I’ve created a traffic analyser to help network engineers detect these kinds of issues related to QoE. It works by analysing the TCP establishment delay time for top applications and websites on the Internet and shows the results in a GUI. This can provide an overview of network status quality for top applications and websites that affect the user’s QoE.
I’m using TCP sessions for analysis as it’s the transport protocol, and changes in network quality could affect it.
TCP RTT
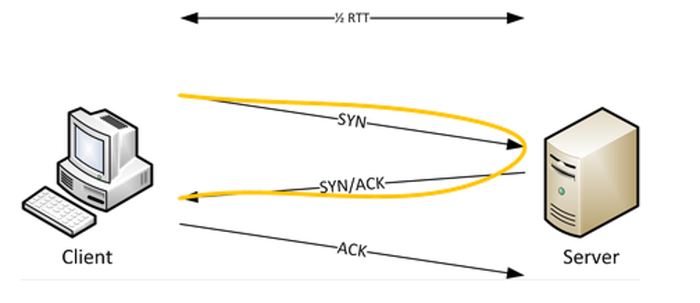
TCP Round Trip Time (RTT) is the length of time it takes for a signal like SYN to be sent plus the length of time it takes for an acknowledgement of that signal to be received. In Figure 1, the orange line shows the RTT for sending the packet SYN from the client to the server plus the time it takes for the client to receive the acknowledgement sent by the server in reply.
Capturing sample traffic and analysing TCP RTT
The software captures and stores live traffic to find the TCP RTT of new sessions in the network and then analyses this using the RTT Analyser tool. Since the capture point is somewhere in the middle of the path from the client to the Internet, the RTT analysis returns the time from the point of capture to the server and back to the capturing server.
The analyser tool then starts to open captured traffic files, analyses them and returns the RTT plus information to specify the destination of that session. This helps to find the RTT of heavily used applications like WhatsApp or Instagram. It calculates the RTT using the difference between the timestamp of the first packet forwarded to the Internet and the related reply packet. Using these two timestamps, the analyser can record the session’s delay.
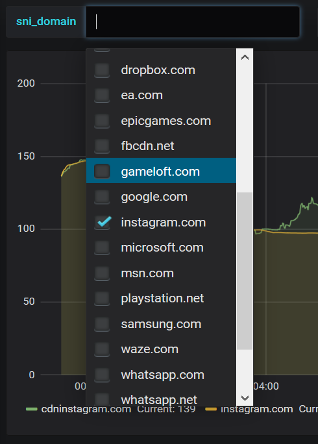
The software also uses the SSL server name or HTTP hostname field in each flow and compares them with a dictionary developed specifically for this to find the relevant website or application. A group of twenty top destinations has been selected to be monitored using this system. This list is flexible and can be changed at any point in time. For the test phase, the list below was used:
By linking all of this data like the TCP RTT, the destination of sessions plus top-rated apps and websites together in a database and running some statistical formulae, a handy summary of network quality for a sample group of clients is ready!
By visualizing them as graphs in a GUI, a useful dashboard of favourite apps and websites has been created. Now, this graph shows almost exactly the delay time of select apps and websites in this specific network.
Figure 3 shows the result of sample traffic in a service provider in the Middle East. It shows that most of the times, the RTT is 100 milliseconds, but sometimes it extends to 150 milliseconds.
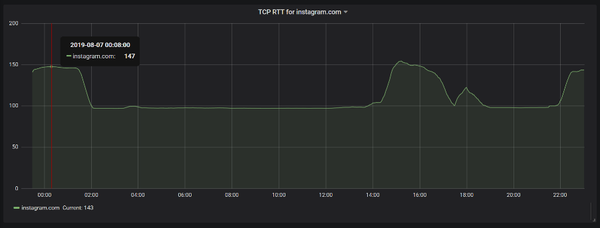
Since these graphs are created based on the median of data available in the database, it means that a majority of the clients are experiencing a 50-millisecond delay in getting Instagram content.
Now a network engineer can detect such anomalies and try to find the root cause or solve it temporarily, for example, by changing BGP settings to switch to other ISPs. And this can be done before getting any calls or customer complaints.
Linking to BGP table
It’s possible to add another factor to the graphs (upstream provider) to help network engineers to go deeper in their analysis and speed up finding the root cause.
The source IP addresses of TCP sessions (so the IP addresses of clients) are helpful here. Now the graphs are based on source IP addresses grouped by each active upstream provider of specific IP address groups.
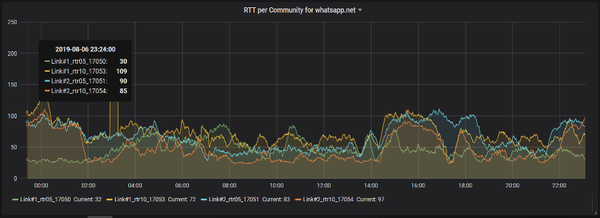
The software gets data from BGP tables and links to RTT results to make the last report per link. This makes it possible to detect QoE for each upstream provider. A network engineer can now see which upstream provider works best for specific applications or top-rated websites.
Improving QoE proactively
In the next phase, I intend to add anomaly detection and machine learning to the system to automatically find anomalies in reports. Then an alert could be generated and sent to the network operation centre. The goal remains to find issues proactively and to improve the overall QoE of customers. After all, the customer is king!
Adapted from original post which appeared on RIPE Labs Blog.
Ali Norouzi is a network quality and performance researcher working in the Middle East.
The views expressed by the authors of this blog are their own and do not necessarily reflect the views of APNIC. Please note a Code of Conduct applies to this blog.
Interesting approach, can you share a link to the project source so we can have a play with it ?
This is an interesting way, it would be great if you share the project so that we can have the test of it.
This is interesting. Can you share more details on this and link to the project source?
I will share the code soon as it need some cleanup for better understanding. I’ll put project links here asap.
Any update for link to project source code?
Any update for link to project source code? Thanks
Hi.
Any news about releasing the project code?
Thanks.