

SPAM (or more specifically phishing) email has become one of the most popular and effective weapons used by cyber attackers. As such, it can be a useful artefact for security enthusiasts to analyze.
There are some cool commercial tools on the market to do this, but as I’m about to show you, it’s easy to set up your own analysis platform with open source tools.
What you’ll need
In this post, I’m going to explain how you can build a Security Orchestration Automation and Response (SOAR) platform from scratch, for free. You’ll need:
TheHive, a scalable, open source and free security incident response platform, designed to make life easier for SOCs, CSIRTs, CERTs and any information security practitioner dealing with security incidents that need to be investigated and acted upon swiftly.
Cortex, a powerful observable analysis and active response engine.
imap2thehive, a python script for collecting SPAM email from an IMAP server. Thanks to Xavier Mertens aka ‘xme’ for writing the wonderful script.
Using these, I’ll show you how to get a SPAM email from a predefined mailbox using a python script and create a case in TheHive automatically. Based on the email observables, you can do some investigation/analysis using Cortex and respond accordingly. In the following examples, I’ve used an Ubuntu 18.04 LTS server with 8GB of RAM and 200GB of disk space.
Step 1: Installing Elasticsearch
TheHive uses Elasticsearch for storing its data, so it is mandatory for building TheHive system. Follow the procedure below to install Elasticsearch:
sudo apt-key adv --keyserver hkp://keyserver.ubuntu.com:80 --recv-key D88E42B4

echo "deb https://artifacts.elastic.co/packages/5.x/apt stable main" | sudo tee -a /etc/apt/sources.list.d/elastic-5.x.list

sudo apt install apt-transport-https

sudo apt update && sudo apt install elasticsearch
Do not start the service now, we will do it later.
Step 2: Configuring Elasticsearch
After installation, you’ll need to complete the following configuration on Elasticsearch. Open the file elasticsearch.yml and paste the lines below at the end of the file:
sudo vim /etc/elasticsearch/elasticsearch.yml

network.host: 127.0.0.1
script.inline: true
cluster.name: hive
thread_pool.index.queue_size: 100000
thread_pool.search.queue_size: 100000
thread_pool.bulk.queue_size: 100000
Step 3: Installing TheHive
It’s time to install TheHive in your server:
echo 'deb https://dl.bintray.com/thehive-project/debian-stable any main' | sudo tee -a /etc/apt/sources.list.d/thehive-project.list

curl https://raw.githubusercontent.com/thehive-Project/thehive/master/PGP-PUBLIC-KEY | sudo apt-key add -

sudo apt-get update

sudo apt-get install thehive
TheHive will not start after the installation. We will start it later.
Step 4: Installing Cortex
Perform the following steps to install Cortex on your server:
echo 'deb https://dl.bintray.com/thehive-project/debian-stable any main' | sudo tee -a /etc/apt/sources.list.d/thehive-project.list

curl https://raw.githubusercontent.com/thehive-Project/Cortex/master/PGP-PUBLIC-KEY | sudo apt-key add -

sudo apt-get update

sudo apt install cortex
Like TheHive, Cortex will not start after the installation. We will do it later.
Step 5: Configuring TheHive
The only required parameter in order to start TheHive is the key of the server (play.http.secret.key). This key is used to authenticate cookies that contain data. If TheHive runs in cluster mode, all instances must share the same key. Type the command below to generate the key:
cat /dev/urandom | tr -dc 'a-zA-Z0-9' | fold -w 64 | head -n 1
A random number will be printed in your terminal. Copy that key and open the /etc/thehive/application.conf file with your favourite editor and add the following line at the bottom of the file.
play.http.secret.key="YOUR_SECRET_KEY"
Step 6: Configuring Cortex
The only required parameter to start Cortex is the key of the server (play.http.secret.key). This key is used to authenticate cookies that contain data. If Cortex runs in cluster mode, all instances must share the same key. Type the below command to generate the key:
cat /dev/urandom | tr -dc 'a-zA-Z0-9' | fold -w 64 | head -n 1
A random number will be printed in your terminal. Copy that key and open the /etc/cortex/application.conffile with your favourite editor and add the following line at the bottom of the file.
play.http.secret.key="YOUR_SECRET_KEY"
Step 7: Starting services
Now that the TheHive and Cortex installation and configuration is complete, it’s time to start the service. Perform the steps below to enable and start the service of Elasticsearch, TheHive and Cortex.
sudo systemctl enable elasticsearch.service
sudo systemctl enable thehive.service
sudo systemctl enable cortex.service

sudo systemctl start elasticsearch.service
sudo systemctl start thehive.service
sudo systemctl start cortex.service

sudo systemctl status elasticsearch.service
sudo systemctl status thehive.service
sudo systemctl status cortex.service
It may take some time to start the services. By default TheHive will use port 9000 and Cortex will use port 9001. Wait until the ports come up.
Step 8: Logging in to TheHive
Now it’s time to log in to the TheHive. Open a browser and go to http://<YOUR_SERVER>:9000 to access the TheHive’s interface. For the first time you will see an image like the one below.

Click Update Database. It will redirect you to the admin user creation page, which looks like the below image.
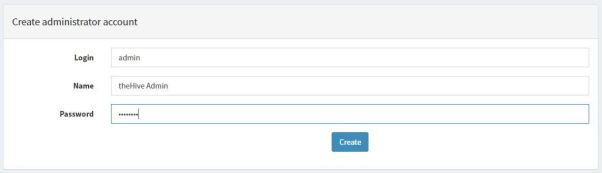
Now create an admin user, which we will use to login to TheHive. After creating the user, you will be redirected to TheHive’s login page, which is similar to the image below.

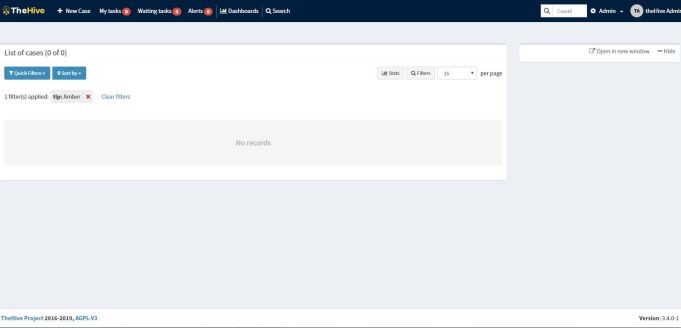
Enter your username and password and click Sign In. You will see a dashboard like the below image which means you have successfully installed and configured TheHive.
Step 9: Logging in to Cortex
The process for logging into Cortex is similar to the TheHive, except for the port number.
Open a browser and go to http://<YOUR_SERVER>:9001 to access the Cortex interface. The first time you log in you’ll see an image like the one below.

Click Update Database. It will redirect you to the admin user creation page, which looks like the image below.
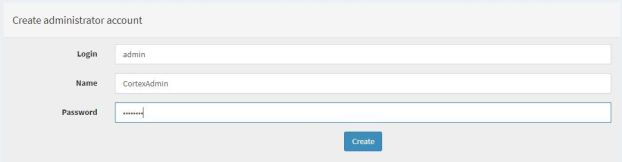
Create an admin user, which you’ll use to login to Cortex. After creating the user, you will be redirected to the Cortex login page, which is similar to the image below.

Enter your username and password and click Sign In. You will see a dashboard like the image below, which means you have successfully installed and configured Cortex.
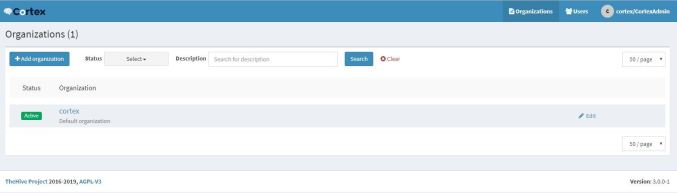
Step 10: Add organization to Cortex
The Cortex system is tenant-based, which means you can create organizations. The default organization is Cortex but we will create our own organization.
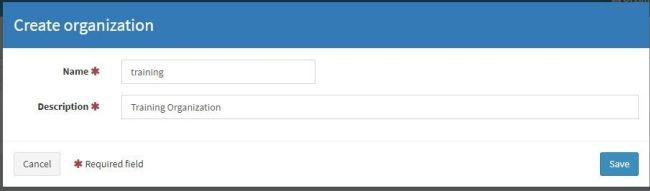
Click Add Organization and add your organization’s name and description. In my case, I named the organization training and description training organization.
After creating the organization, it will show up in the organization window. Now let’s create users under this newly created organization.
Step 11: User management in Cortex
Cortex has four different rules for its users: read, analyze, orgAdmin and superAdmin.
Users who have the read role can only read the reports. Users who have an analyze role can read reports and run jobs. Those who have an orgadmin role can run jobs, view reports, and enable/disable the analyzer, but they cannot create another organization nor delete the organization. superAdmin can perform all activities except run jobs, view reports, enable/disable the analyzer and configure the analyzer.
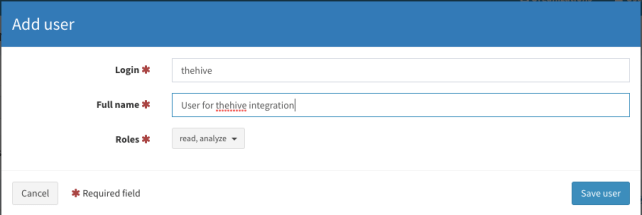
Let’s create two users in Cortex with different roles. We will create one user with the read, analyze, and orgadmin roles enabled, which we will use for configuring the analyzer and the responders. For the other user, we’ll give them read, analyze roles, which will be used for integration with TheHive.
Click the training organization. On the left side of the screen you will see the Add user button. Click that button to create our first user with the read, analyze and orgadmin roles selected.
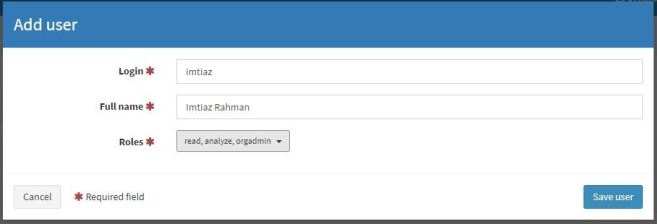
After entering all the information click the Save user button. Like the first one, let’s create the second user but this time we will only select the read, analyze role.
Let’s log out from the system and login again with the orgadmin role user. In my case the username is imtiaz.
Step 12: Logging in to Cortex with orgadmin role user
After logging in with the orgadmin role user you will notice that the dashboard is different, as in the image below:
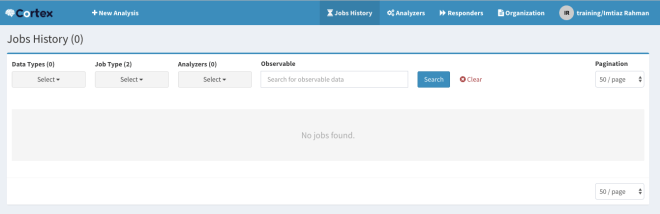
It has different tabs like Job history, Analyzer, Responders, Organization. Click the Organization tab. Under this tab, click the Analyzers and Responders tab. The list will be empty now. We will load the analyzer and the responders.
Step 13: Running analyzer and responders
To run the analyzer, you will need to install the following software:
sudo apt-get install -y --no-install-recommends python-pip python2.7-dev python3-pip python3-dev ssdeep libfuzzy-dev libfuzzy2 libimage-exiftool-perl libmagic1 build-essential git libssl-dev

sudo pip install -U pip setuptools && sudo pip3 install -U pip setuptools
Download the repository below for Cortex analyzer and responders.
cd /opt

sudo git clone https://github.com/TheHive-Project/Cortex-Analyzers.git
Each analyzer and responder has some dependencies, which we can install from the requirements.txt file. Instead of installing them one by one you can use the command below to install them all.
for I in $(find Cortex-Analyzers -name 'requirements.txt'); do sudo -H pip2 install -r $I; done && \
for I in $(find Cortex-Analyzers -name 'requirements.txt'); do sudo -H pip3 install -r $I || true; done
It will take some time. Wait for the installation to finish.
After the installation, edit the /etc/cortex/application.conf file. Open the file and search for the word analyzer. You need to update the location of the analyzer. Edit the file and change the path value under analyzer (as below):
analyzer {
   # Absolute path where you have pulled the Cortex-Analyzers repository.
   path = ["/opt/Cortex-Analyzers/analyzers"]
   fork-join-executor {
 # Min number of threads available for analysis.
   parallelism-min = 2
 # Parallelism (threads) … ceil(available processors * factor).
   parallelism-factor = 2.0
 # Max number of threads available for analysis.
   parallelism-max = 4
  }
 }
Restart the Cortex service.
sudo systemctl restart cortex.service
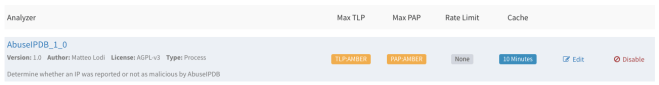
Be patient — Cortex will take some time to restart the service. After the service comes up, log in with the orgadmin role user and go to the Organization->Analyzers tab. You will see all your analyzers in a list similar to that shown below:
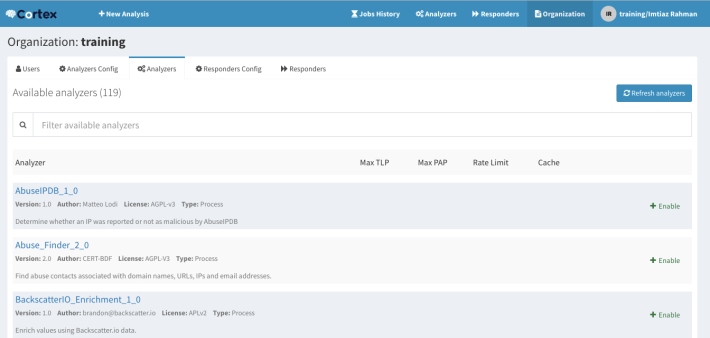
Go back to your terminal and open the /etc/cortex/application.conf file. Paste the following lines after the analyzer section.
responder {
   # Absolute path where you have pulled the Cortex-Analyzers repository.
   path = ["/opt/Cortex-Analyzers/responders"]
   fork-join-executor {
 # Min number of threads available for analysis.
   parallelism-min = 2
 # Parallelism (threads) … ceil(available processors * factor).
   parallelism-factor = 2.0
 # Max number of threads available for analysis.
   parallelism-max = 4
  }
 }
Restart the Cortex service.
sudo systemctl restart cortex.service
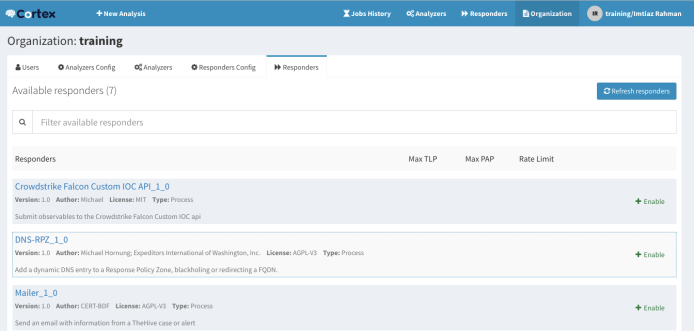
Again, be patient. Cortex will take some time to restart the service. After the service comes up, log in with the orgadmin role user and go to the Organization->Responders tab. You will see all your responders in the list similar to that shown below:
Step 14: The integration
Login to Cortex with an orgadmin role user and go to the Organization tab. You will see a page like the one shown below:
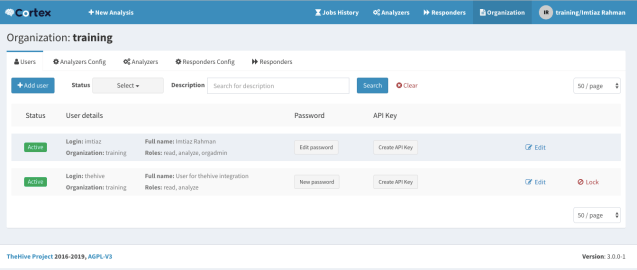
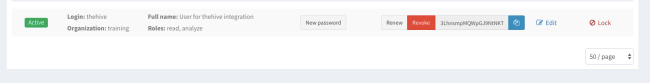
Remember we created a user called thehive earlier. We will use this user for doing the integration. Click the Create API Key button for thehive user. Your API key will be generated. You will now have three buttons beside your username (as below).
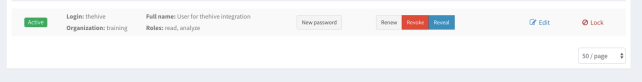
Click the Reveal button. Your API key will be displayed. Copy the API key.
Go back to your server terminal and open /etc/thehive/application.conf file. Search for the text ‘cortex’ and uncomment the below line.
play.modules.enabled += connectors.cortex.CortexConnector
Change your Cortex configuration like below:
cortex {
   "CORTEX-SERVER-1" {
     url = "http://YOUR_CORTEX_SERVER_IP:9001"
     key = "PASTE_YOUR_API_KEY_HERE"
   # # HTTP client configuration (SSL and proxy)
     ws {}
   }
 }
After making the change, restart TheHive service. Type the below command to restart the service:
sudo systemctl restart thehive.service
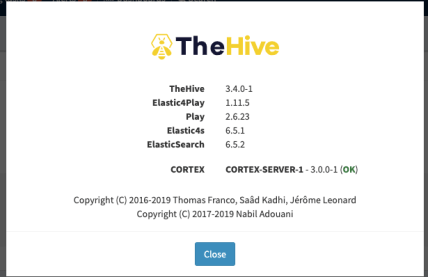
Log in to TheHive. Click your username (top right corner of your screen) — in my case it is theHive Admin — then click About. A box will appear and if everything is OK, you will see the version of Cortex along with the server name you just configured with a green OK displayed in the box similar to the image below.
Step 15: Enabling analyzer in Cortex
After integration it’s time to test the full system. Before this we need to configure and enable analyzer in Cortex.
Login to Cortex as the orgadmin role user. Go to Organization and click Analyzer. You will see all installed/loaded analyzers available in your system. Some of them are paid, some of them are free, some of them have both. For this lab we will use AbuseIPDB and VirusTotal analyzers.
To enable the analyzer we need an API key. I’m not going to cover how to create the key but if you create an account on VirusTotal or AbuseIPDB you will get your API key for free.
Let’s enable the AbuseIPDB analyzer first.
Click Analyzers config and find the AbuseIPDB analyzer. By default it will be disabled.
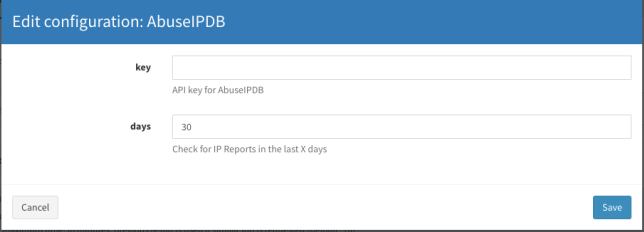
Click Edit. A window will appear like the below image:

Insert your AbuseIPDB API key here and leave the days field as it is or you can choose your own value. Click Save.
Go to the Analyzers tab and find the AbuseIPDB analyzer and click Enable. A window will appear where you can change the value or you can leave it with the default value. Click Save.
Your AbuseIPDB analyzer is now ready for analysis.
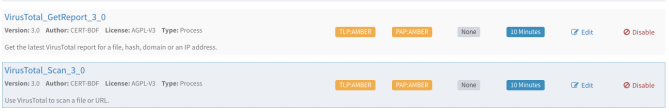
You can enable the other analyzer, VirusTotal in the same way. Provide the VirusTotal API key from Analyzer config and Enable the analyzer from the Analyzers tab. Enable both VirusTotal_GetReport_3_0 and VirusTotal_Scan_3_0.
Step 16: Analyzing from Cortex
You can now use Cortex to perform some analysis.
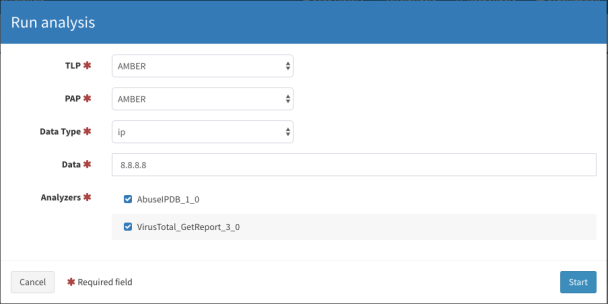
Click New Analysis from the left corner of your screen. A window will appear. Leave the TLP and PAP value as AMBER. Choose the datatype as ip. Provide an IP address, for example 8.8.8.8 (but you can choose other addresses also). The purpose of this analysis is to check whether the system is working or not. I leave the TLP and PAP value as AMBER (it is the default option) — you can change it if you like. Check the Analyzers that you want to perform the analysis.
Click Start to start the analysis. You will see the analysis appear in the Job History tab.
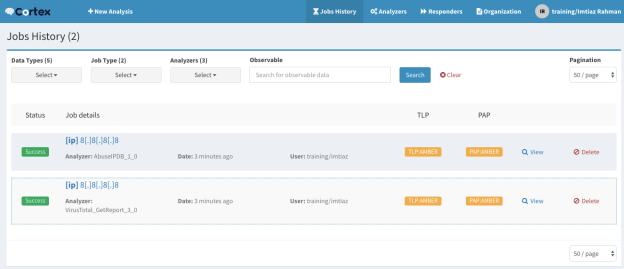
After completing the analysis, the Status column will show the success (or failure) status. Click View to see the detailed report of the analysis.
Step 17: Testing the integration
So far we have set up our TheHive and Cortex systems. Using these, let’s test the integration by creating a case in TheHive and doing the analysis.
Before doing this, create a user with read, write permissions in TheHive. After creating the user, logout from your current user and log in again with the newly created user.
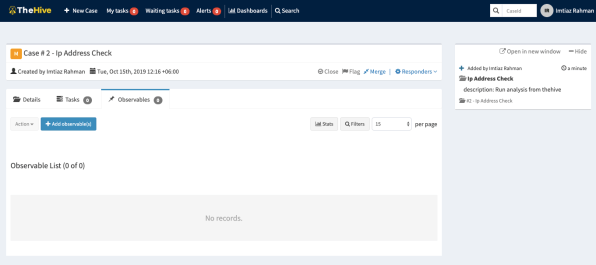
Let’s do the same analysis but this time from TheHive by creating a case. Click New Case and fill out the form as below:
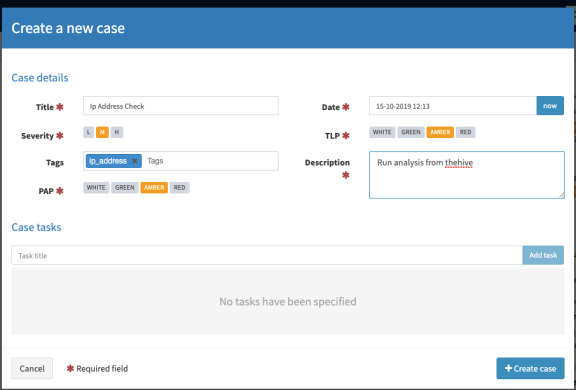
Click Create case. The newly created case will look like the image below:
Click Observables > Add observable(s). Here you can select multiple observables to analyze. Click the Type field and select your observables. For this case, I want to check the status/reputation of the IP address, so I choose ip as type, 8.8.8.8 as the value, and ip_address as the tag. You can choose a different address here if you like.
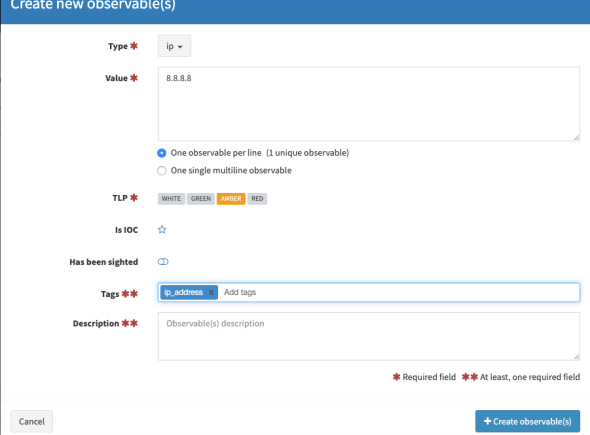
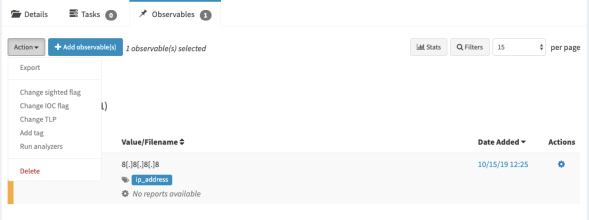
Click Create Observables. Your observables will appear like the image below. Select the observables and click Action, then choose Run analyzers.
After that, the analyzer will appear. Select the analyzer you want to use for this analysis. I chose both analyzers.
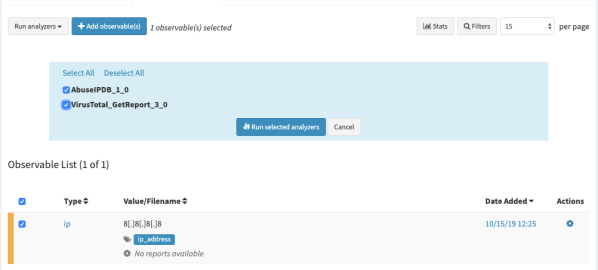
Click Run selected analyzers. After finishing the analysis you will see the status of the analysis as below.
You can see your analysis report regarding the IP address here. Click the red link to see the report. It will show you the raw JSON output.
For a better view, you can download the report template. Log out from your user and login to TheHive as an admin user. After logging in go to Admin->Report templates and click import templates. After importing the templates, log out from the admin user and log back in with your user account again. Check the report again from the same location.
The TheHive has a Twitter-like feed where you can see all your activity. You can find it on the right side of your screen. If you have a result in TheHive then the integration is working.
You can now go for the real fun part, analyzing SPAM email.
Step 18: Creating a case from a SPAM email
This is the fun part of this tutorial. Here we will create a case in TheHive from a SPAM email where, if the subject of the mail is [ALERT], an alert will be created in TheHive. Download the repository from this link. (Thanks to the author for writing this amazing python script.) After downloading the repository, open the file imap2thehive.confand change the [imap] and [thehive] sections according to your environment. You will need to generate an API key from your TheHive interface. Log in with admin and go to Admin > Users. From here you can create an API key for a specific user to use in this file.
[imap]
host: <YOUR_IMAP_SERVER_IP>
port: <PORT>
user: <MAIL_USER>
password: <PASSWORD>
folder:thehive
expunge: true
spam: (X-Spam-Flag: YES)

[thehive]
url: http://<YOUR_THEHIVE_SERVER>:9000
apikey: <YOUR API_KEY>
observables: true
whitelists: imap2thehive.whitelists
You can also change the tlp value from [alert] and [case] sections if you like. Now that the configuration is done, log in to your IMAP email account and create a directory called thehive (you can choose any name) like the below image. I use roundqube as my email client.

Now, whenever you get a SPAM email in your mailbox or reported by other users of your domain, put that email in thehive folder and make it unread.
Next, go to your terminal and install the required dependency to run the python script. Go to your imap2thehive directory and run the command below:
sudo pip install -r requirements.txt
This will download the necessary package for running the scripts. Next, make the imap2thehive.py file executable. Run the script (as below):
sudo ./imap2thehive.py -c imap2thehive.conf
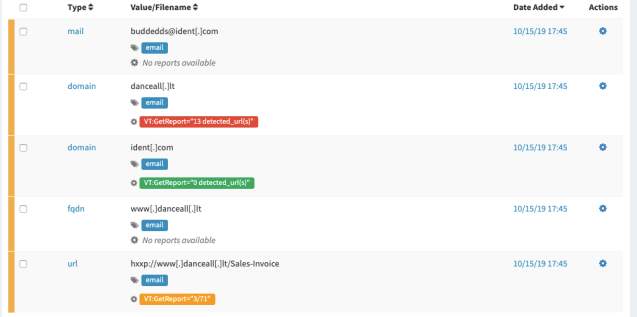
If it’s connected to your IMAP server it will display Connected to IMAP server and will start processing the unread mail in thehive folder. It will create a case from your email and create the observables like domain, IP, and URL (if any).
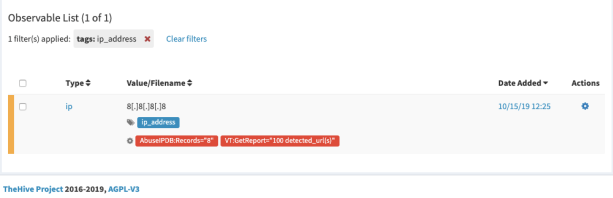
When you log in to your TheHive server, you will see a new case with the email subject created. Click the newly created case and go to observables. Check which one you want to analyze. Click Action > Run analyzers. Follow the Twitter-like feed for the progress of your analysis. If it’s successful you will see results like those shown in the image below.
Step 19: Enabling a response
Now it’s time to enable responders. Like analyzers, you can enable responders in Cortex.
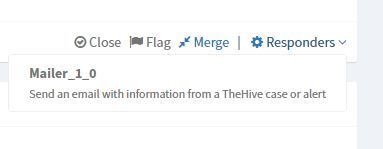
Responders are very similar to analyzer though they have a different purpose. You can also write your own responders. We will use the Mailer responder which, when customized for your environment, should allow you to send emails to specific users from TheHive’s interface. Log in to Cortex with an orgadmin role user. Go to Organizations >Responders Config and click Mailer. A window will appear like the image below.
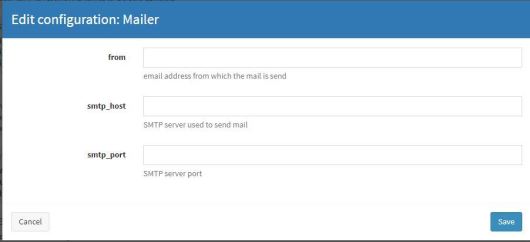
According to your environment, provide your smtp_host, smtp_port and from (sender) address. Click Save. Go to the Responders tab and find Mailer_1_0. Click Enable. A window will appear like the image below:
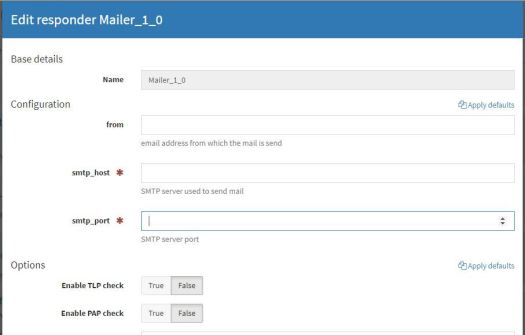
Like before, fill out the fields according to your environment and click Save. Click the Refresh responders button. Our responder is now configured. Let’s look at the responder action from TheHive.
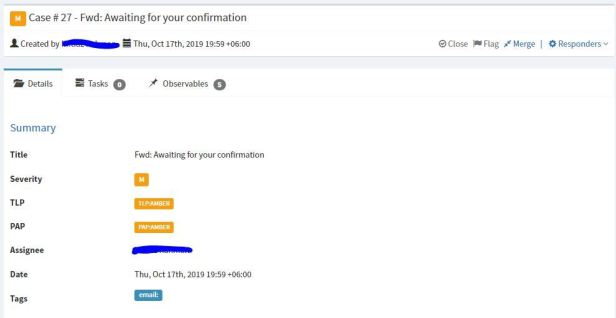
Log in to TheHive. I have a case here which is generated from a SPAM email with the subject line ‘Awaiting for your confirmation‘. This is a real-life email that I received a couple of years ago. Using the python script, I’ll pull the mail from a predefined mailbox and make a case in the TheHive.
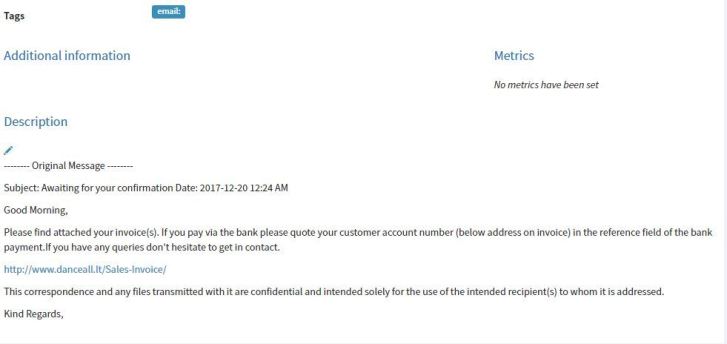
When you click a case in TheHive, you will see a section called Description at the bottom. Here you will see the original mail message. In my case it looks like the image below.
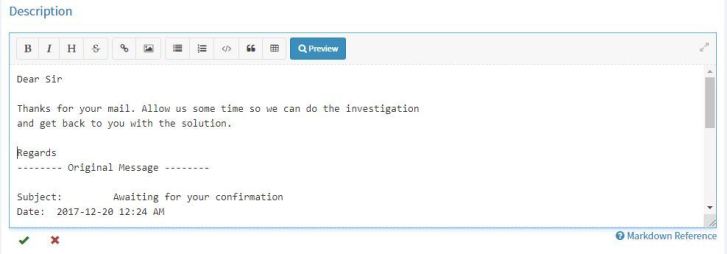
Now the message is reported by a user who has received the mail. The user forwards the mail to our preconfigured mailbox and we pull that message and start our investigation. From this Description window you can draft your reply email (See the image below for an example). You will find a pen icon below the Description. Click that icon and it will allow you to create a draft. After making the changes click the green tick mark to save.
Now for the real trick: go to Tags and add tags like the ones below.
You will have the email tag there already, so just add the mail tag. Replace YOUR_RECIPIENT_EMAIL_ADDRESS with the address you want to reply from.

Go to Responders and click Mailer_1_0 and click Yes, run it.
Go to Responders Jobs at the bottom of your case. If you configure the responders correctly then you will see an image like the one below with a status of a cool green Success message.
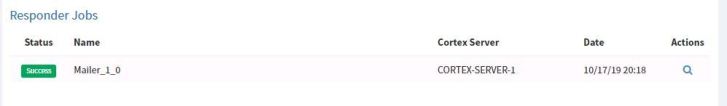
Check with your recipient, they should have received a message from your TheHive system.
Happy Hunting
The goal of this post was to show you how to build a system for doing security analysis and investigation in an automated way. You can do multiple analyses with your observables including for URLs, domains, files from a single place and you can respond accordingly. Build your system in a secure place first before going to production and be careful about the observables, especially URLs and files. Happy hunting!
Adapted from original post which first appeared on Imtiaz Rahman’s Blog.
The views expressed by the authors of this blog are their own and do not necessarily reflect the views of APNIC. Please note a Code of Conduct applies to this blog.