

APNIC Sub-regional Resource Updates are periodic blogs on resource delegation trends in a specific APNIC sub-region, featuring interactive data from the APNIC Internet Directory.
Oceania is the southernmost of the APNIC sub-regions, and has the greatest number of economies (26). The sub-region, home to just over 42 million people, encompasses 26 island economies in the Pacific Ocean, ranging from large economies such as Australia, New Zealand and Papua New Guinea, to some of the world’s smallest, both in area (Tuvalu (26km2), Nauru (21km2) and Tokelau (10km2)), and in population, like Pitcairn (population: 50).
ASNs
Nearly 4,000 AS numbers are allocated to Members in Oceania, with 3,145 of those delegated to Members in Australia and 700 to New Zealand.
The presence of these larger economies does make it difficult to see what’s going on in the smaller economies, though. If we use comparison mode to exclude Australia and New Zealand, then check the Cumulative box, we can see that the next largest allocation is to Papua New Guinea with 27, followed by Vanuatu and Fiji with 16 ASNs apiece.
Peering
Predictably, both Australia (1508 peers with 1794 visible adjacencies) and New Zealand (385/390) have well-developed IPv4 peering scenes, with their IPv6 numbers much smaller (355/361 and 120/110 respectively), but well interconnected.
In IPv4 peering, PNG is leading the smaller economies, with 1 visible adjacency per ASN on average.
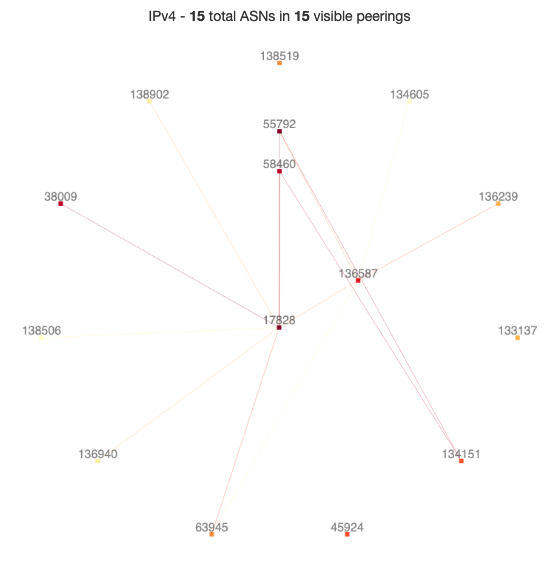
Figure 1 — IPv4 vizAS graph for Papua New Guinea.
With the exception of Australia and New Zealand, New Caledonia is clearly leading the sub-region in terms of IPv6 peering, with 7 total ASNs and 6 visible BGP adjacencies.
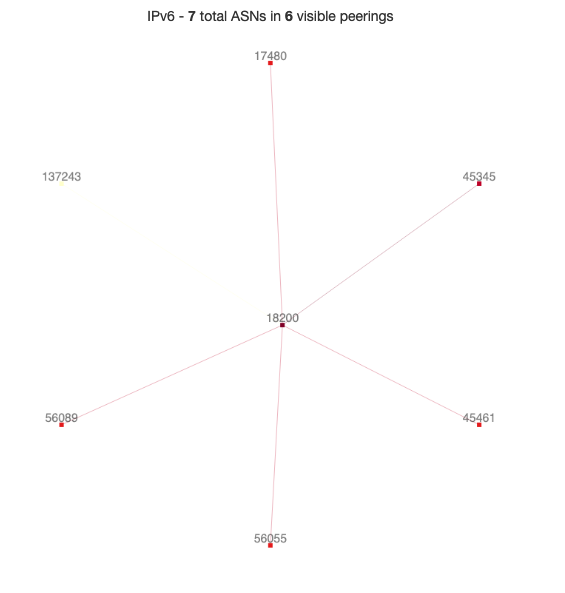
Figure 2 — IPv6 vizAS graph for New Caledonia.
IPv4
Returning to the comparison mode (minus Australia and New Zealand) view, the IPv4 delegation statistics show that the number of ASNs doesn’t correlate to the amount of IPv4 in use in an economy. Checking the Cumulative and /24 options, we can see that New Caledonia (636 /24s) and Guam (614 /24s) have the most IPv4 address space delegated to them among the selected economies.
If we look at the cumulative /24 stats (by selecting the Cumulative and /24 options on the chart below) for the sub-region as a whole, it’s clear that Australia and New Zealand’s IPv4 numbers have plateaued since around 2011, coinciding with when IANA assigned APNIC its final /8 in 2011 and the maximum delegation size was changed to a /22. If we remove the check from the Cumulative box, however, it looks as though both these larger economies may have rushed to stockpile their IPv4 addresses in 2010, with APNIC delegating 37,633 /24s to Australia and 3433 to New Zealand that year.
IPv6
75.4% of IPv6 delegations in the Oceania sub-region so far have gone to Australia.
If we check the /48 and Cumulative options on the chart below we can see that the amount of IPv6 delegated to the sub-region hasn’t risen significantly since 2007. It’s possible that many economies are simply not feeling the pinch just yet and are waiting to ‘grow into’ their IPv6 address space, or are relying on IPv4 and NAT. With such a broad statistic, however, all we can do is speculate.
To get a more detailed idea of what’s happening with IPv6, let’s take out the big players again, checking the /48 and Cumulative options.
In this chart we can see some economies with comparatively large numbers of IPv6 delegations continuing through to this year, like Papua New Guinea and New Caledonia. Papua New Guinea’s slope is particularly steep compared with the rest of the sub-region. Other prominent economies such as Fiji and Guam haven’t received new delegations since 2017.
But do these figures translate into IPv6 actually being used? The answer is, for now, a resounding “no”, with Papua New Guinea at 0.016% and New Caledonia 0.125% IPv6 capable at the time of writing. The less recently active Fiji (0.011%) and Guam (0.005%) don’t seem to have made a substantial move yet, either.
We do know that Papua New Guinea is expecting several new submarine cables, and the increase in performance and capacity they bring may drive demand and competition in the economy. It will be interesting to watch this space over the coming year.
For right now though, the IPv6 deployment charts seem to indicate that only Australia (19.881%) and New Zealand (22.797%) have rolled out IPv6 to significant percentages of their populations.
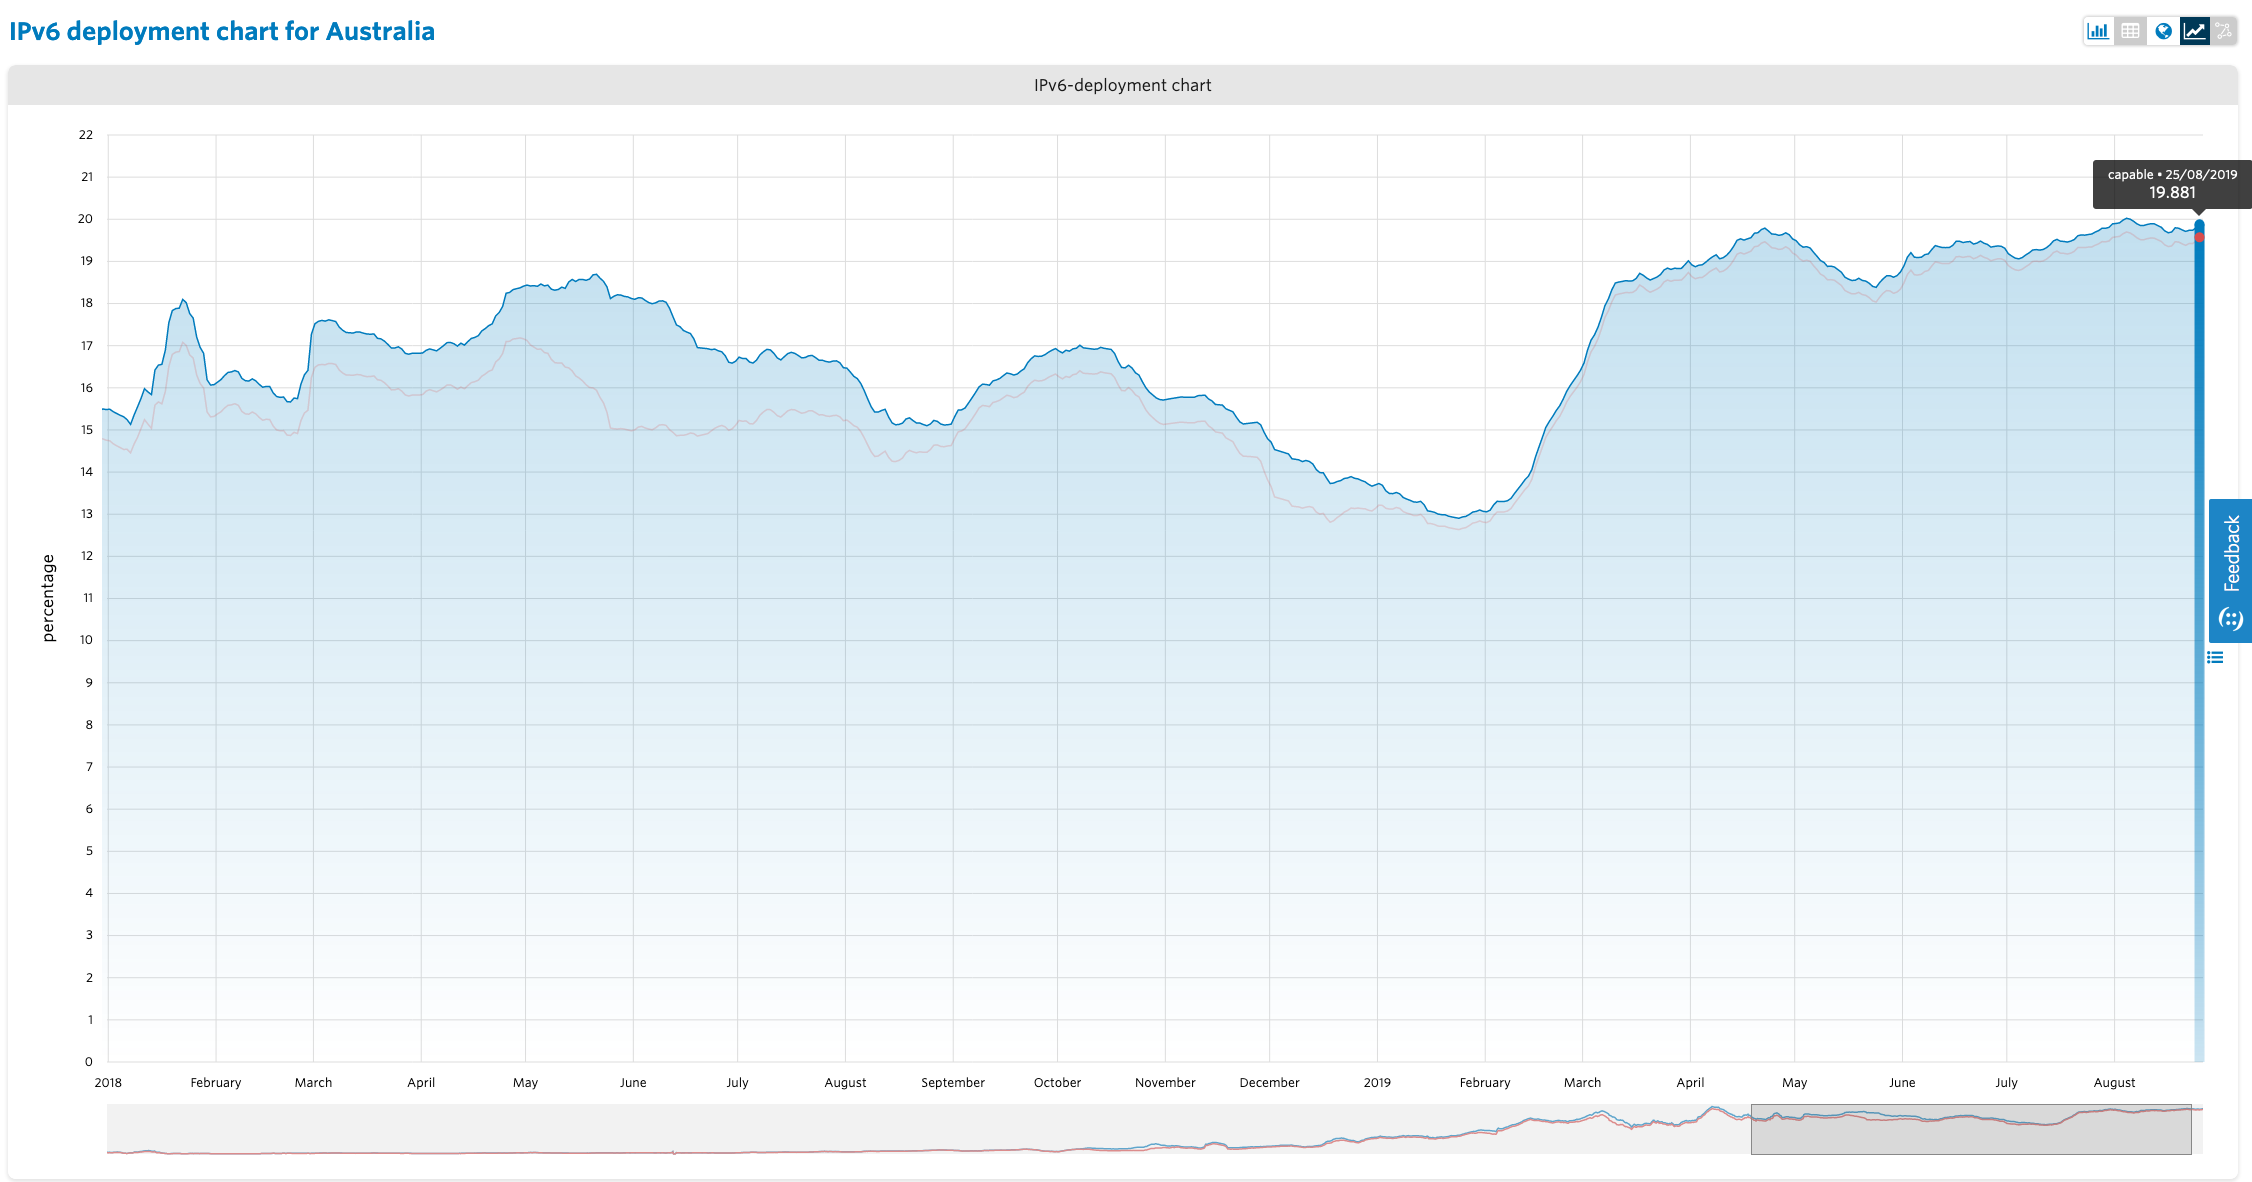
Figure 3 — IPv6 deployment graph for Australia.
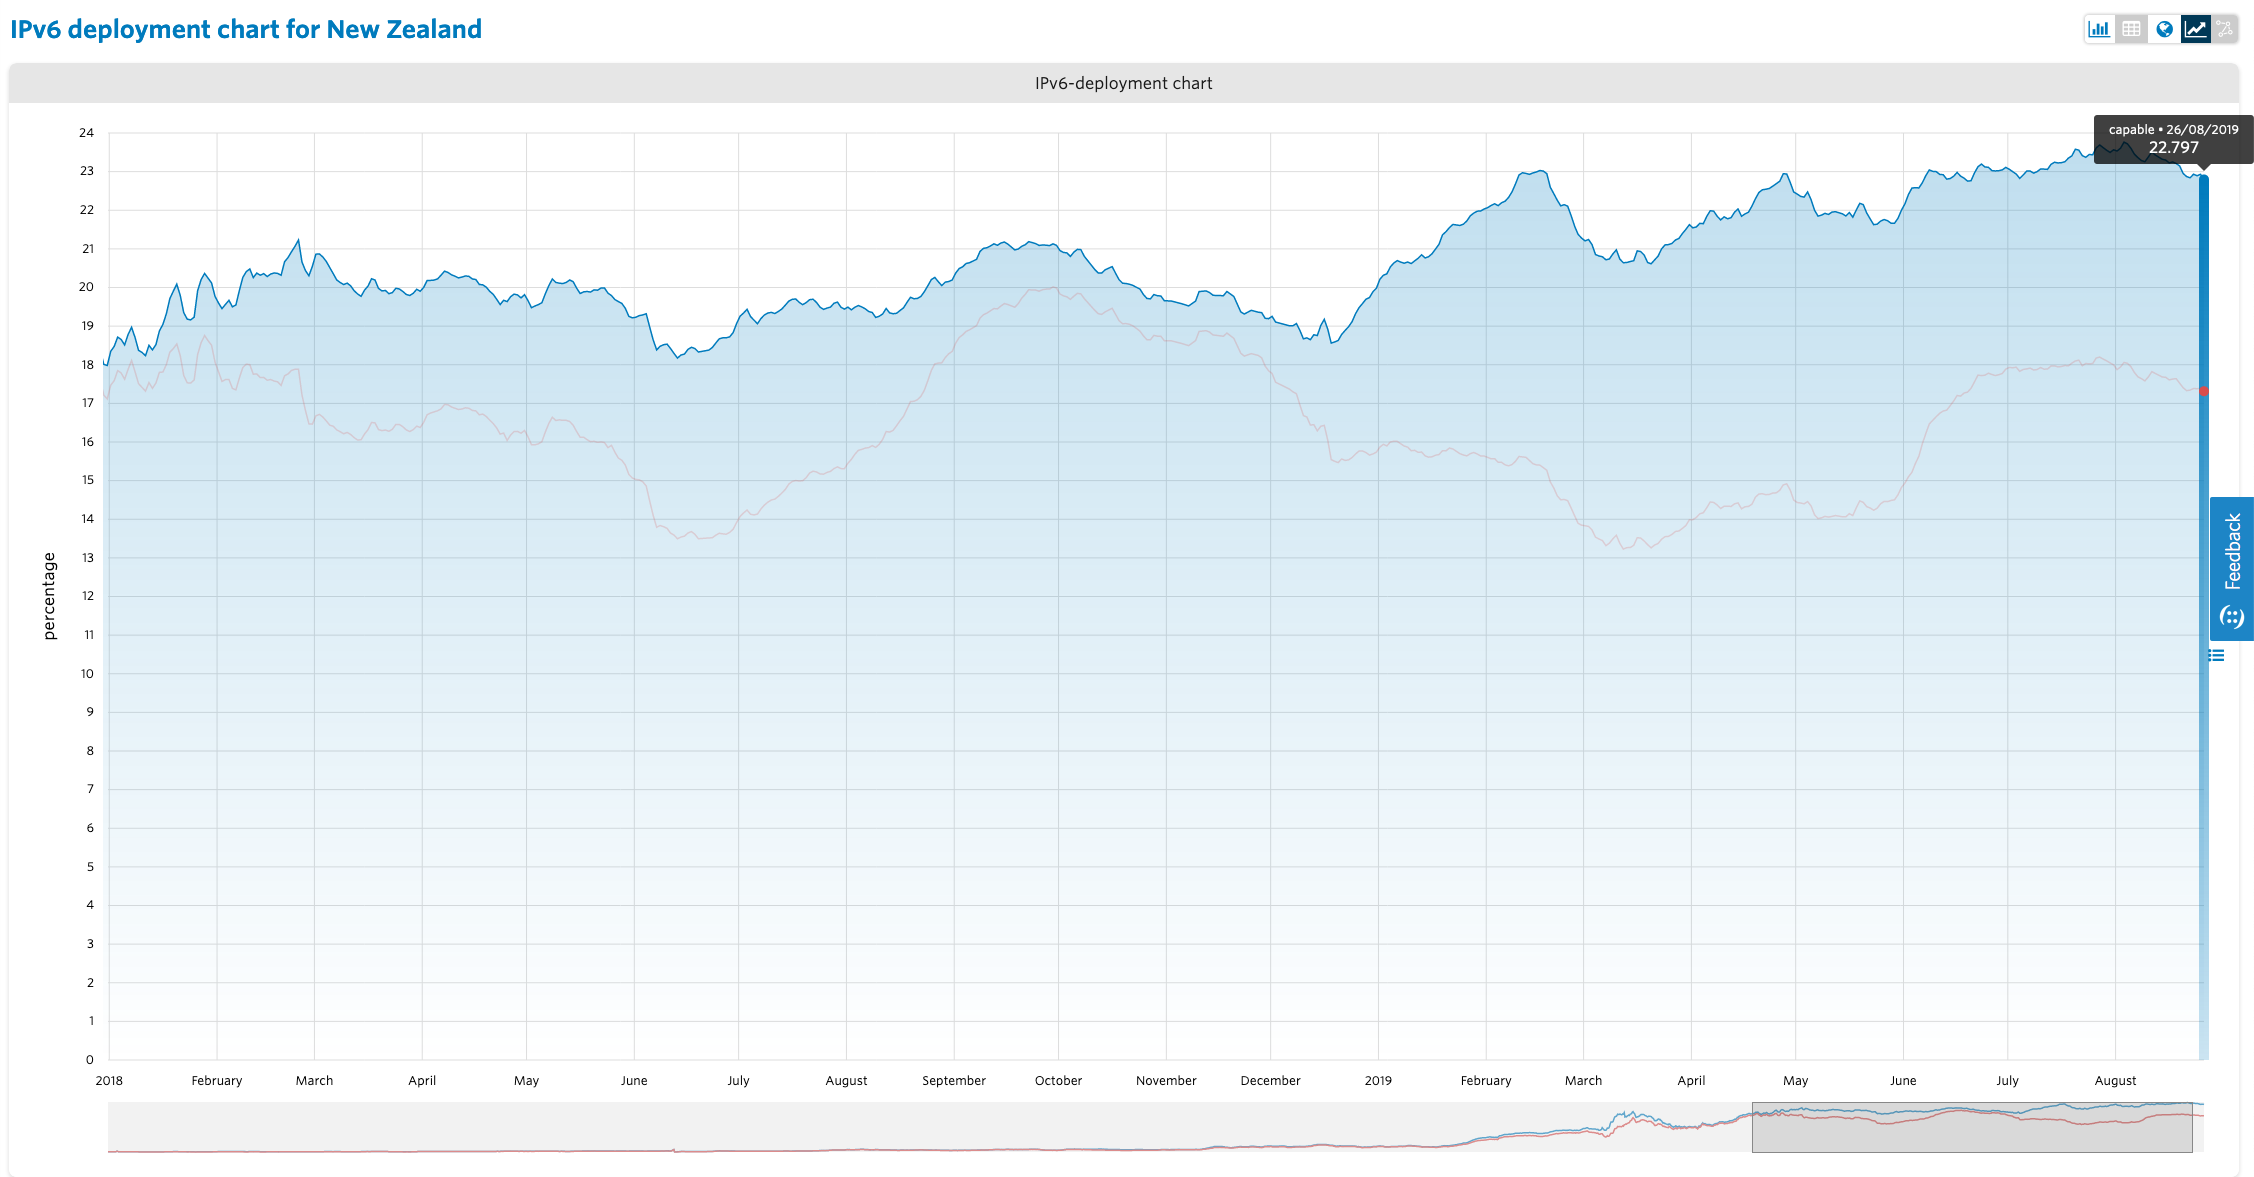
Figure 4 — IPv6 deployment graph for New Zealand.
One curious looking chart belongs to Vanuatu, who spiked to 5.142% IPv6 capable (but 0% preferred) in March of this year, only for the capability figure to drop back to 0%. Perhaps a network operator in Vanuatu is testing the waters?
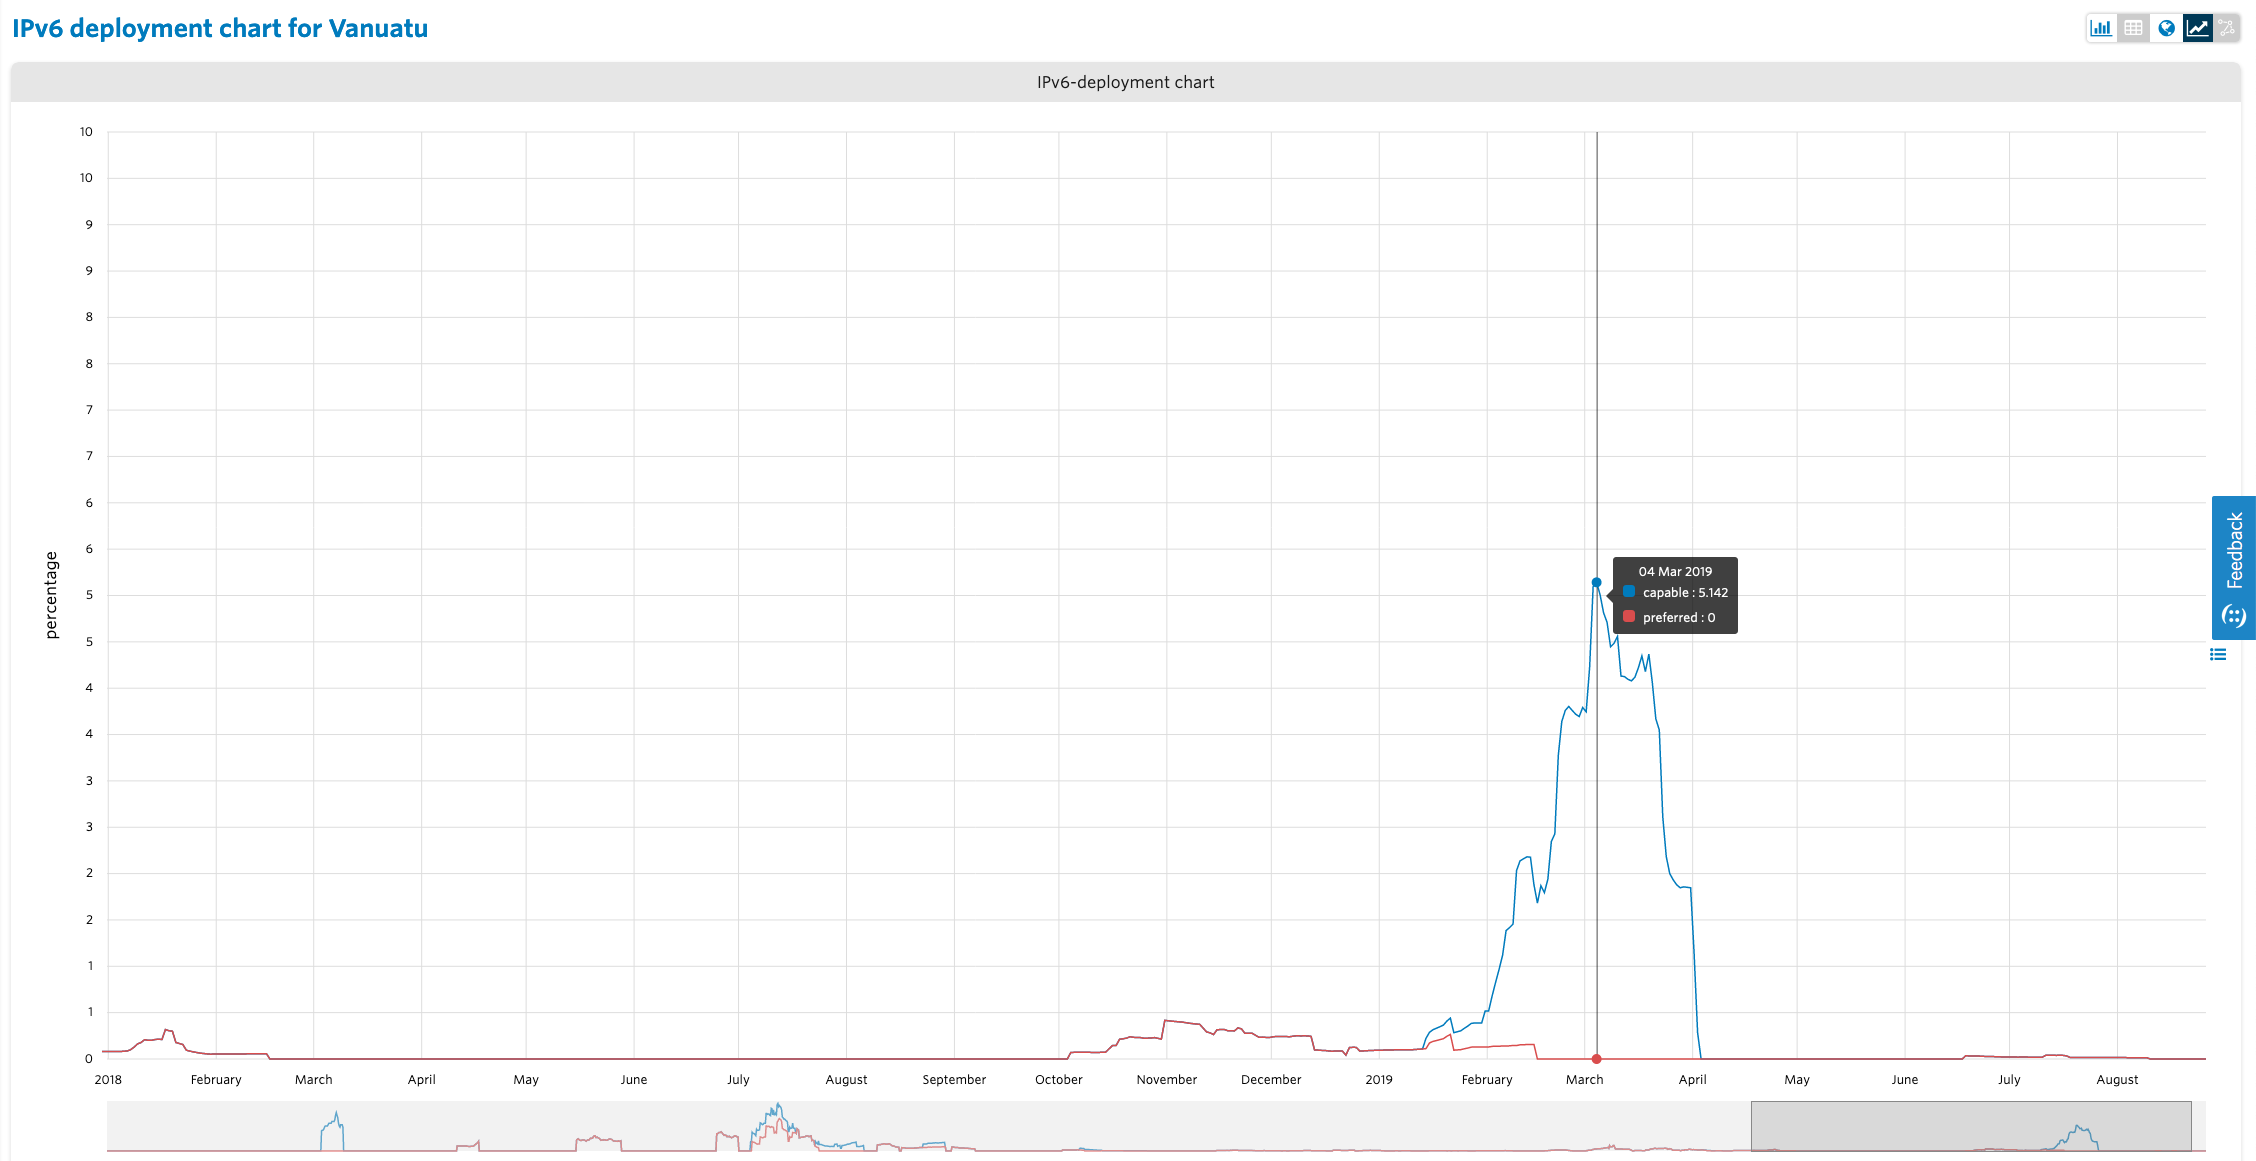
Figure 5 — IPv6 deployment graph for Vanuatu.
The embedded charts in this report are sourced from the APNIC Internet Directory. While the data in the embedded charts will change over time, the analysis and figures in the text and static images in this article are current only at the date of publication.
The views expressed by the authors of this blog are their own and do not necessarily reflect the views of APNIC. Please note a Code of Conduct applies to this blog.