

There is no shortage of network telemetry data that can be collected, recorded, graphed, and stored for cross reference and triage. Not one to be underestimated, latency data can be incredibly powerful when leveraged for baseline and deviation notification.
As I have alluded to in the past, there are many tools in this space — you can read about some that I’ve written about in detail. Regardless of the tool, the data itself is powerful and the instrumentation it provides will only serve to make your network more robust and easier to work on.
One tool that is particularly easy to set up and use is smokeping, which provides:
- Best of breed latency visualizations.
- Interactive graph explorers.
- Wide range of latency measurement plugins.
- Master/Slave System for distributed measurements.
- A highly configurable alerting system.
- Live latency charts with the most ‘interesting’ graphs.
- Free and open source software written in Perl by Tobi Oetiker, the creator of MRTG and RRDtool.
Why do I need to track latency?
Latency data is incredibly powerful and can be an indicator of anything from a failing optic to a network compromise.
It is especially useful for small- to medium-sized ISPs (and especially WISPs), where the cost of software and operational overhead is at a premium, and customer satisfaction is the currency that is dealt. One time, I was able to use smokeping to help diagnose a functional denial of service of a commonly deployed cable CPE, as detailed here.
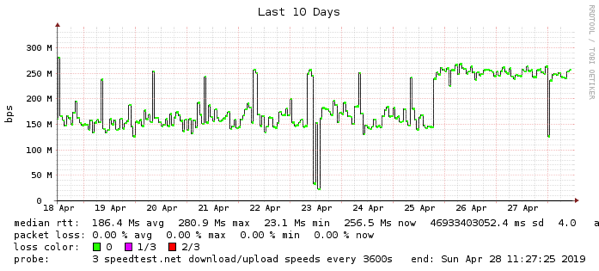
Figure 1 — From measuring my home network latency with smokeping I was able to see (and prove) an outage on the 23 April to my operator.
I can’t emphasize enough how useful long term trend data is. Smokeping can be used to monitor more than just ping RTT, it supports a myriad of plugins allowing for application latency of protocols such as DNS queries, http get, ssh daemon response, and speed test results, to name a few.
Where smokeping is particularly useful is in simulating customer experience. As with most things in life, perspective is paramount. To address this, smokeping can also be deployed as a distributed model.
Deploying it with installations more local to a customer or in a far-flung site (say, on a raspberry pi) located in remote POP sites or pedestal locations will provide a closer perspective to what the customer actually sees. In the past, I have deployed remote raspberry pi devices in an actual FTTH pedestal connected to an ONT to provide the exact customer point of view and it delivered a wealth of information I would not otherwise be able to see.
There are a myriad of different installation guides for smokeping — my recommended starting point is by Gerd Naschenweng. It provides a Docker instance but also has a very good set of configuration files from which to build examples.
For anyone interested in seeing a working smokeping installation, mine is public and available to view. It provides a few things such as DNS latency, RTT for v4 and v6, RTT for ZeroTier hosts and RIPE ATLAS probes — it’s a powerful toolkit. Check it out here and let me know your thoughts on smokeping below.
Adapted from original post that appeared on The Forwarding Plane.
Nick Buraglio has worked in the network provider industry for more than 15 years, holding network engineering positions at regional Internet providers as well as at the National Center for Supercomputing Applications (USA).
The views expressed by the authors of this blog are their own and do not necessarily reflect the views of APNIC. Please note a Code of Conduct applies to this blog.