

Event log analysis is a key element in security incident investigation.
If a network is managed by Active Directory (AD), a compromised account can be identified by analysing AD event logs. For such investigation, it is quite difficult to conduct detailed analysis in AD Event Viewer; it is rather common to export the logs to text format or import them into a Security Information and Event Management (SIEM)/log management system. However, since the number of event logs can be massive (depending on the environment), this can be a struggle for analysts.
JPCERT/CC has recently updated its LogonTracer tool (v1.2.1), which supports such event log analysis. This post discusses how it works.
Note: We recommend you update to the latest version of LogonTracer, which has addressed the vulnerabilities that were found in the first version.
Event log visualization by LogonTracer
LogonTracer associates a hostname (or an IP address) and account name found in logon-related events and displays it as a graph. This way, it is possible to see in which account login attempts occur and which host is used.
Figure 1 is a graph created by LogonTracer, which shows the relation of IP addresses and accounts.
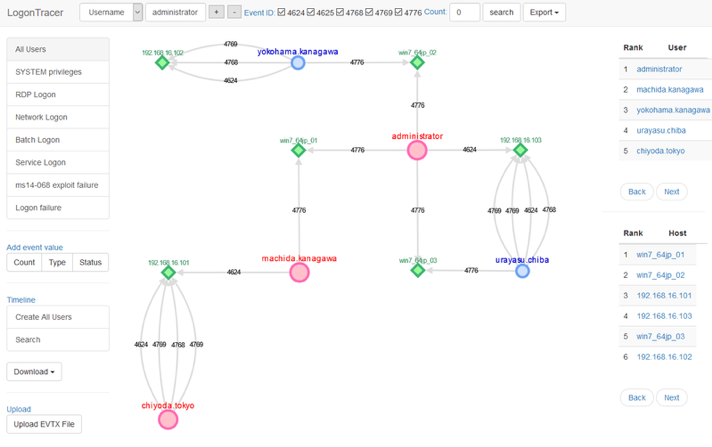
Figure 1 — Result of AD event log visualization on LogonTracer.
Here are the details of each node. An account (Red/Blue) that is connected to a host (Green) with a line shows that it is logged on using the host.
Red: SYSTEM privilege account
Blue: Standard user account
Green: Host/IP address
This visualization makes the analysis simple even for those without detailed knowledge of event logs.
Extract more important accounts and hosts
In addition to event log visualization, LogonTracer is able to display possible leveraged accounts/hosts by ranking. Figure 2 is an example of the importance rank of accounts and hosts.
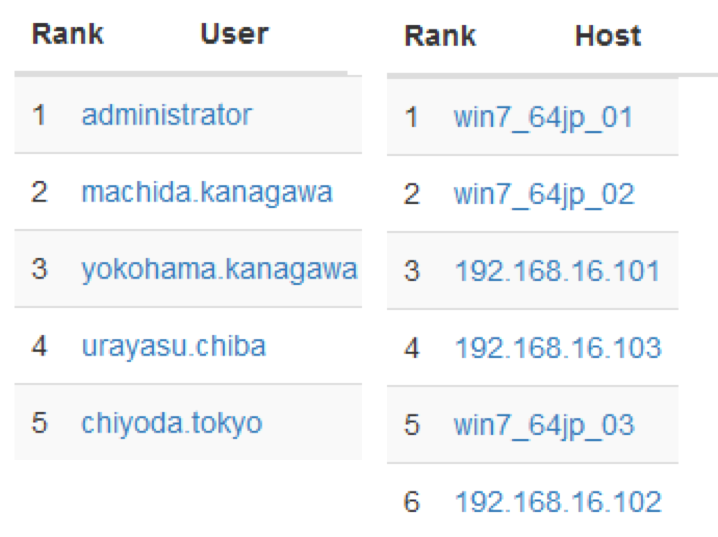
Figure 2 — Ranking of accounts and hosts that have higher importance.
For this ranking, LogonTracer performs network analysis on the event log graph and creates a ranking based on the ‘centrality’ of each node. Centrality is an index which indicates each node’s proximity to the centre in a network. PageRank is applied to calculate centrality.
In this algorithm, nodes that have a connection to many other nodes are located towards the centre of the graph and therefore have a higher centrality.
The more login attempts that compromised accounts perform to hosts, the higher their centrality. Consequently, by comparing centrality, possible affected accounts/hosts can be identified.
Chronological display of event logs
With LogonTracer, it is also possible to display event logs in chronological order. Figure 3 shows the number of event logs for each account in a time series.
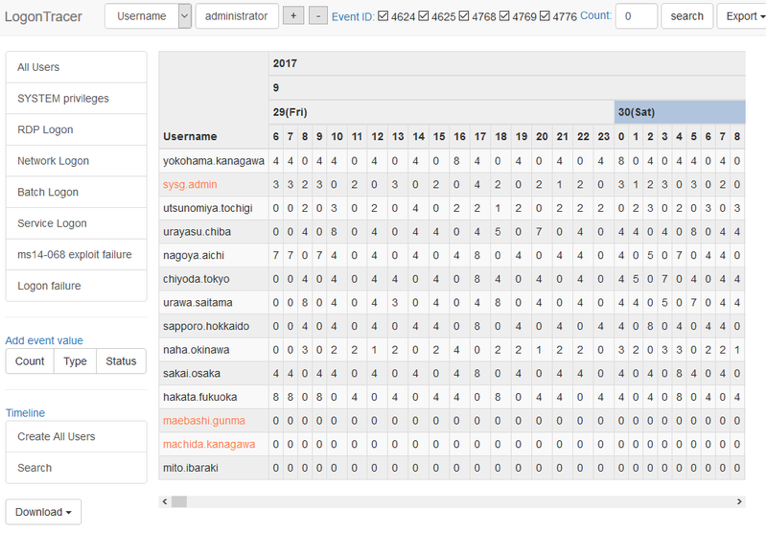
Figure 3 — Event logs in a timeline.
This function can assist with spotting unauthorized login attempts during a short period of time or outside of working hours. Any drastic increase of event logs is automatically highlighted. For detecting the increase of the count, Change Finder is applied as an anomaly detection method.
Analyse event IDs
LogonTracer was designed to visualize the following event IDs following the recommendations from a previous JPCERT/CC project, ‘Detecting Lateral Movement in APTs’, which showed that monitoring these was an effective means for investigating unauthorized logins.
Event ID 4624: Login successful
Event ID 4625: Login failed
Event ID 4768: Kerberos authentication (TGT request)
Event ID 4769: Kerberos authentication (ST request)
Event ID 4776: NTLM authentication
Event ID 4672: Privilege assignment
Because not all of the above event IDs are recorded with the default settings, the Audit Policy needs to be enabled to retain such logs. For detailed instructions on the configuration, please see LogonTracer readme file, which is also available on GitHub.
Start using LogonTracer
Although event log analysis is crucial in incident investigations, it can be a time consuming process if you don’t know what to analyse and where to begin.
LogonTracer offers easy event log analysis by visualizing the relations among accounts and hosts. We hope you try this tool in preparation for actual incident investigation and welcome your comments below.
Check the JPCERT/CC website to learn how to install LogonTracer and use it to conduct actual analysis.
Adapted from original post ‘Visualise Event Logs to Identify Compromised Accounts – LogonTracer’, which appeared on the JPCERT Coordination Center Blog, JPCERT/CC Eyes.
Shusei Tomonaga is involved in malware analysis and forensics investigation with JPCERT/CC.
The views expressed by the authors of this blog are their own and do not necessarily reflect the views of APNIC. Please note a Code of Conduct applies to this blog.