

It has become either a tradition, or a habit, each January for me to report on the experience with the inter-domain routing system over the past year; looking in some detail at metrics from the routing system that can show the essential shape and behaviour of the underlying interconnection fabric of the Internet.
One reason why we are interested in the behaviour of the routing system is that at its heart it has no natural limitation. Our collective unease about routing relates to a potential scenario where every network decides to deaggregate their prefixes and announce only the most specific prefixes; or where every network applies routing configurations that are inherently unstable, and the routing system rapidly reverts into oscillating states that generate an overwhelming stream of routing updates into the Border Gateway Protocol (BGP). In such scenarios, the BGP, will not help us by attempting to damp down the anomalies. Instead, there is a very real prospect that in such scenarios the protocol behaviour of BGP could amplify the behaviour!
BGP is an instance of a Bellman-Ford distance vector routing algorithm. This algorithm allows a collection of connected devices (BGP speakers) to each learn the relative topology of the connecting network.
The basic approach of this algorithm is very simple: each BGP speaker tells all its other neighbours about what it has learned if the newly learned information alters the local view of the network. This is a lot unlike a social rumour network, where every individual who hears a new rumour immediately informs all their friends. In the case of BGP, each time a neighbour informs a BGP speaker about reachability to an IP address prefix, the BGP speaker compares this new reachability information against its stored knowledge that was gained from previous announcements from other neighbours. If this new information provides a better path to the prefix then the local speaker moves this prefix and associated next-hop forwarding decision to the local forwarding table and informs all its immediate neighbours of a new path to a prefix, implicitly citing itself as the next hop.
In addition, there is a withdrawal mechanism, where a BGP speaker determines that it no longer has a viable path to a given prefix, in which case it announces a ‘withdrawal’ to all its neighbours. When a BGP speaker receives a withdrawal, it stores the withdrawal against this neighbour. If the withdrawn neighbour happened to be the currently preferred next hop for this prefix, then the BGP speaker will examine its per-neighbour data sets to determine which stored announcement represents the best path from those that are still extant. If it can find such an alternative path, it will copy this into its local forwarding table and announce this new preferred path to all its BGP neighbours. If there is no such alternative path, it will announce a withdrawal to its neighbours, indicating that it no longer can reach this prefix.
And that’s the three paragraph summary of BGP.
What could possibly go wrong?
The first is the sheer size of the routing tables. Each router needs to store a local database of all prefixes announced by each routing peer. In addition, conventional routing design places a complete set of ‘best’ paths into each line card and performs a lookup into this forwarding data structure for each packet.
This may not sound all that challenging until you do some basic calculations and work out that at 100Gbps (which is not uncommon these days) in this instance, a single such ‘wire’ could present one valid 64 octet IP packet every 5 nanoseconds. Performing a lookup into a data structure of around one million entries for an imprecise match of a 32-bit value within 5 nanoseconds represents an extremely challenging silicon design problem. The larger the search space, the harder the problem!
Secondly, there is the overall stability of the system. Processing a routing update requires several lookups into local data structures as well as local processing steps.
Each router has a finite capacity to process updates; once the update rate exceeds this local processing capability, then the router will start to queue up unprocessed updates. The router will start to lag in real time, so that the information a BGP speaker is propagating reflects a past local topology, not necessarily the current local topology. If this lag continues then at some point updates may be dropped from the queue.
BGP has no inherent periodic refresh capability, so when information is dropped, the router and its neighbours fall out of sync with the network topology. At its most benign, the router will advertise ‘ghost’ routes where the prefix is no longer reachable, yet the out-of-sync router will continue to advertise reachability. At its worst, the router will set up a loop condition and as traffic enters the loop it will continue to circulate through the loop until the packet’s TTL expires. This may cause saturation of the underlying transmission system and trigger further outages which, in turn, may add to the routing load.
So, the critical metrics we are interested in are the size of the routing space and its level of updates, or ‘churn’. In this first part of the annual routing and addressing report we’ll concentrate on the BGP routing table size and defer consideration of churn to the next part, and wrap it up with a final part to examine addressing.
The BGP measurement environment
In trying to analyze long baseline data series the ideal approach is to keep as much of the local data gathering environment as stable as possible. In this way, the changes that occur in the collected data reflect changes in the larger environment, as distinct from changes in the local configuration of the data collection equipment.
The measurement point being used is a BGP speaker configured within AS131072. This AS generates no traffic and originates no routes in BGP. It’s a passive measurement point that has been logging all received BGP updates since 2007. The router is fed with a default-free eBGP feed from AS4608, which is the APNIC network located in Australia, and AS4777, which is the APNIC network located in Japan, for both IPv4 and IPv6 routes.
There is also no iBGP component in this measurement setup. While it has been asserted at various times that iBGP is a major contributor to BGP scalability concerns in BGP, the consideration here in trying to objectively measure this assertion is that there is no ‘standard’ iBGP configuration, and each network has its own rather unique configuration of Route Reflectors and iBGP peers. This makes it hard to generate a ‘typical’ iBGP load profile, let alone analyse the general trends in iBGP update loads over time.
In this study, the scope of attention is limited to a simple eBGP configuration that is likely to be found as a ‘stub’ AS at the edge of the Internet. This AS is not an upstream for any third party, it has no transit role and does not have a large set of BGP peers. It’s a simple view of the routing world that I see when I sit at an edge of the Internet.
The Data
The IPv4 routing table
Measurements of the size of the routing table have been taken on a regular basis since the start of 1988, although detailed snapshots of the routing system only date back to early 1994.
Figure 1 shows a rather unique picture of the size of the routing table, as seen by all the peers of the RouteViews route collector on an hourly basis. Several events are visible in the plot, such as the bursting of the Internet bubble in 2001, and if one looks closely, the effects of the global financial crisis in 2009.
What is perhaps surprising is one ongoing event that is not visible in this plot: since 2011 the supply of IPv4 addresses has been progressively constrained as the free address pools of the various Regional Internet Registries have been exhausted. Yet there is no visible impact on the rate of growth of the number of announced prefixes in the global routing system since 2011. In terms of the size of the routing table, it’s as if the exhaustion of IPv4 addresses has not happened at all!
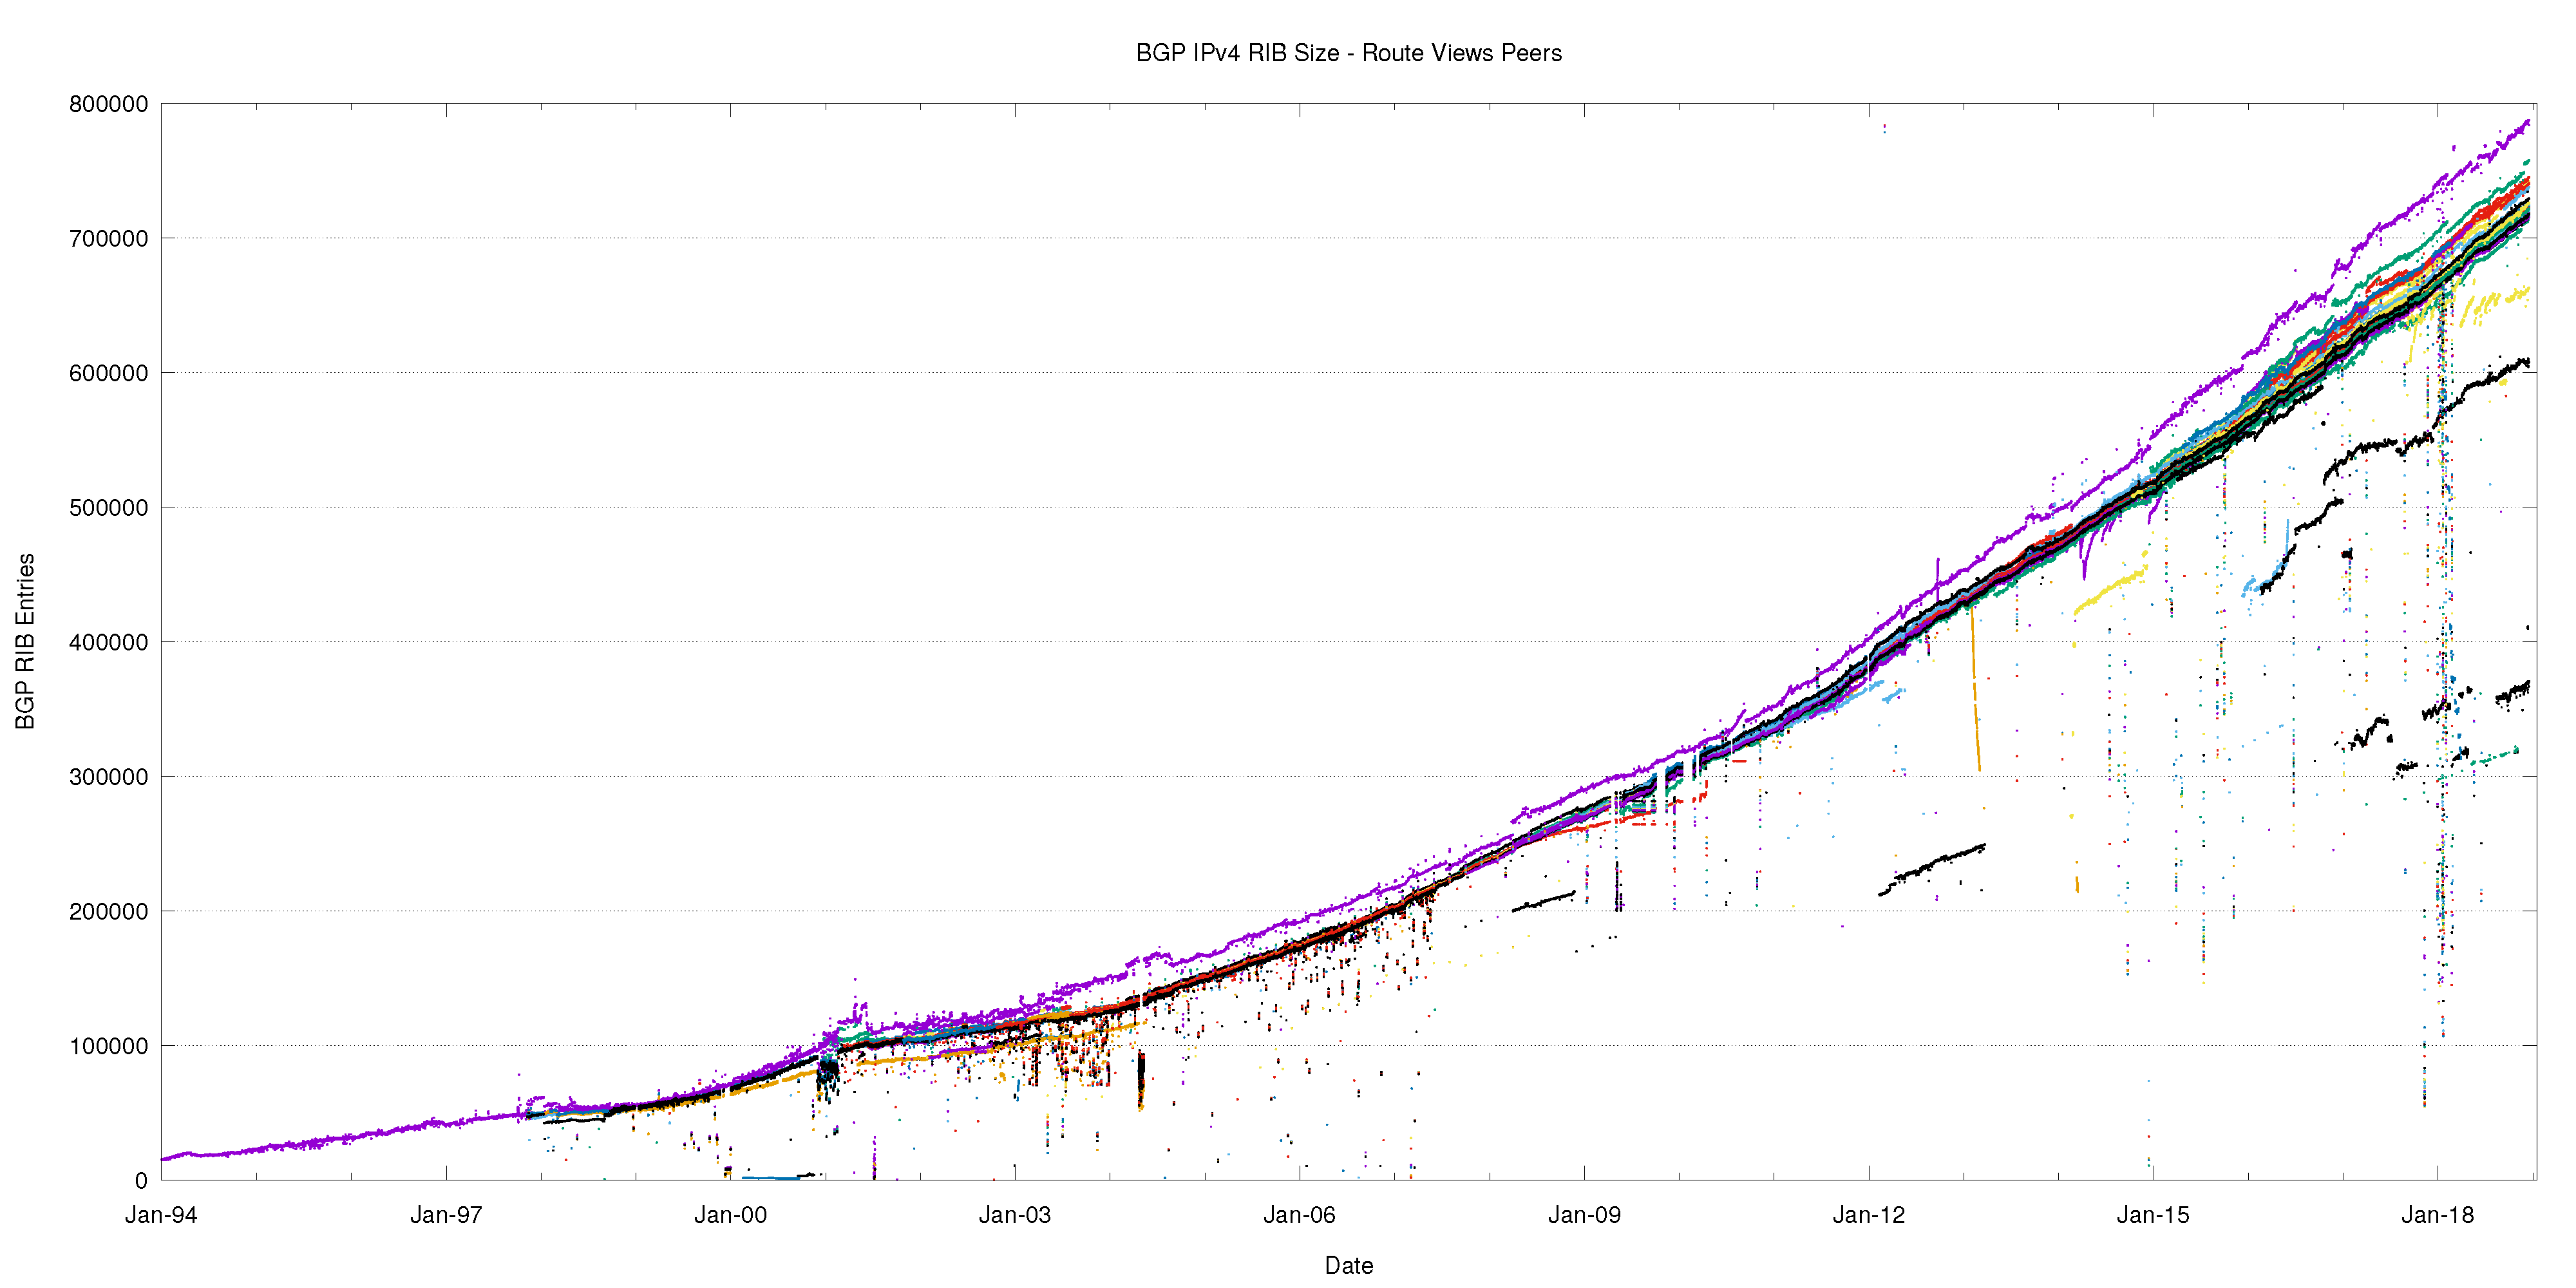
Figure 1 — IPv4 routing table since 1994 as seen by RouteViews peers.
BGP is not just a reachability protocol. Network operators can manipulate traffic paths using selective advertisement of more specific addresses, and allow BGP to be used as a traffic engineering tool.
These more specific advertisements often have a restricted propagation. This is evident in Figure 2, where I’ve combined the BGP RIB counts from both the RouteViews peers and the peers of the RIPE NCC’s Routing Information Service (RIS).

Figure 2 – IPv4 routing table 2016-2018, as seen by RouteViews and RIS peers.
There are two distinct bands in this plot: the upper band is the RouteViews peers, and the lower band is generated by the RIS peers. The RIS peers, which are predominately located in Europe, appear to have 30,000 fewer prefixes, and cluster more tightly around their mean as compared to the set of RouteViews peers.
The other interesting point is that at the start of 2016, the reporting systems have a divergence of some 50,000 route entries. Yet by the end of 2018, this divergence has increased to some 100,000 routing entries.
This illustrates an important principle in BGP, that there is no single authoritative view of the Internet’s inter-domain routing table — all views are in fact relative to the perspective of each BGP speaker.
It also illustrates that at times the cause of changes in routing is not necessarily a change at the point of origination of the route which would be visible to all BGP speakers across the entire Internet, but it may well be a change in transit arrangements within the interior of the network that may expose, or hide, collections of routes.
The issue of the collective management of the routing system as a single entity could be seen as an instance of a ‘tragedy of the commons‘, where the self-interest of one actor in attempting to minimize its transit service costs becomes an incremental cost in the total routing load that is borne by other actors. To quote the Wikipedia article on this topic:
“In absence of enlightened self-interest, some form of authority or federation is needed to solve the collective action problem.”
&nsbp;
This appears to be the case in the behaviour of the routing system, where there is an extensive reliance on enlightened self-interest to be conservative in one’s own announcements, and the actions of a small subset of actors are prominent because they fall well outside of the conventional conservative ‘norm’ of inter-domain routing practices.
The next collection of plots (Figures 3 through 12) show some of the vital statistics for IPv4 in BGP since the start of 2011 to the end of 2018.
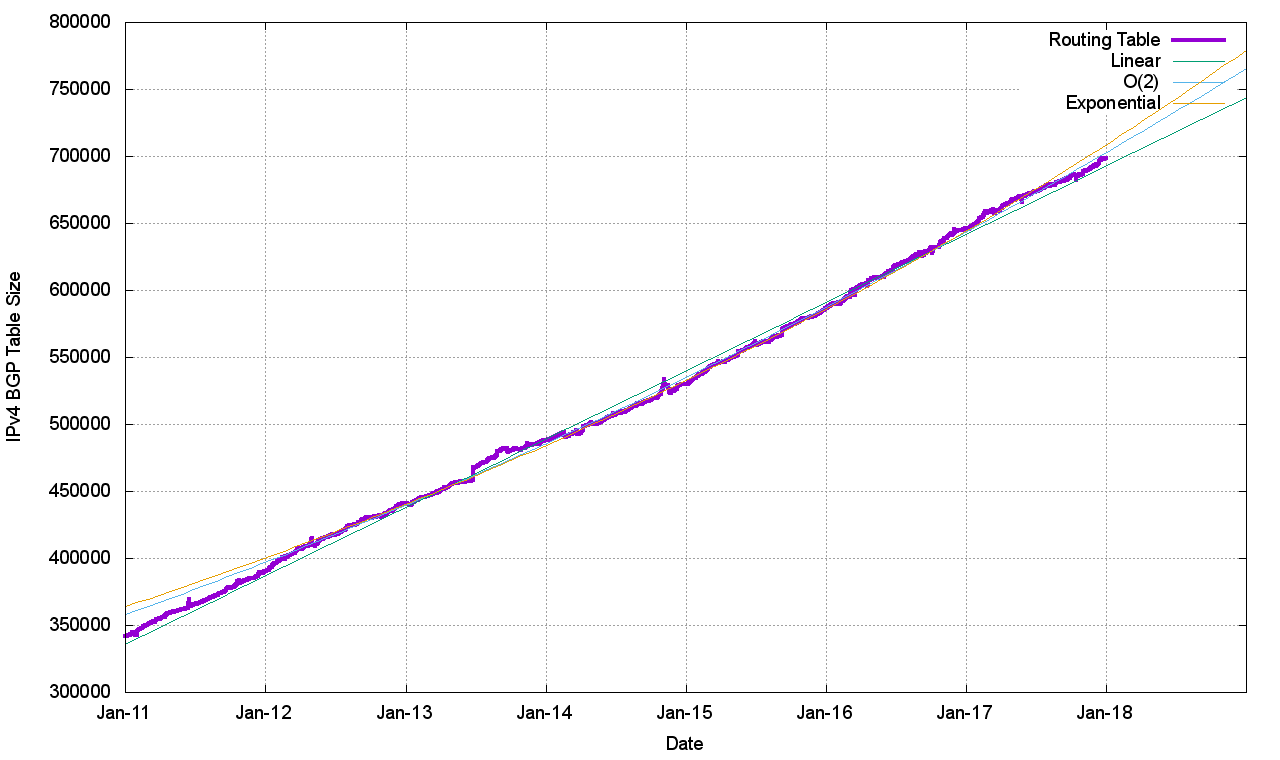 Figure 3 – IPv4 BGP routing table size (RIB)
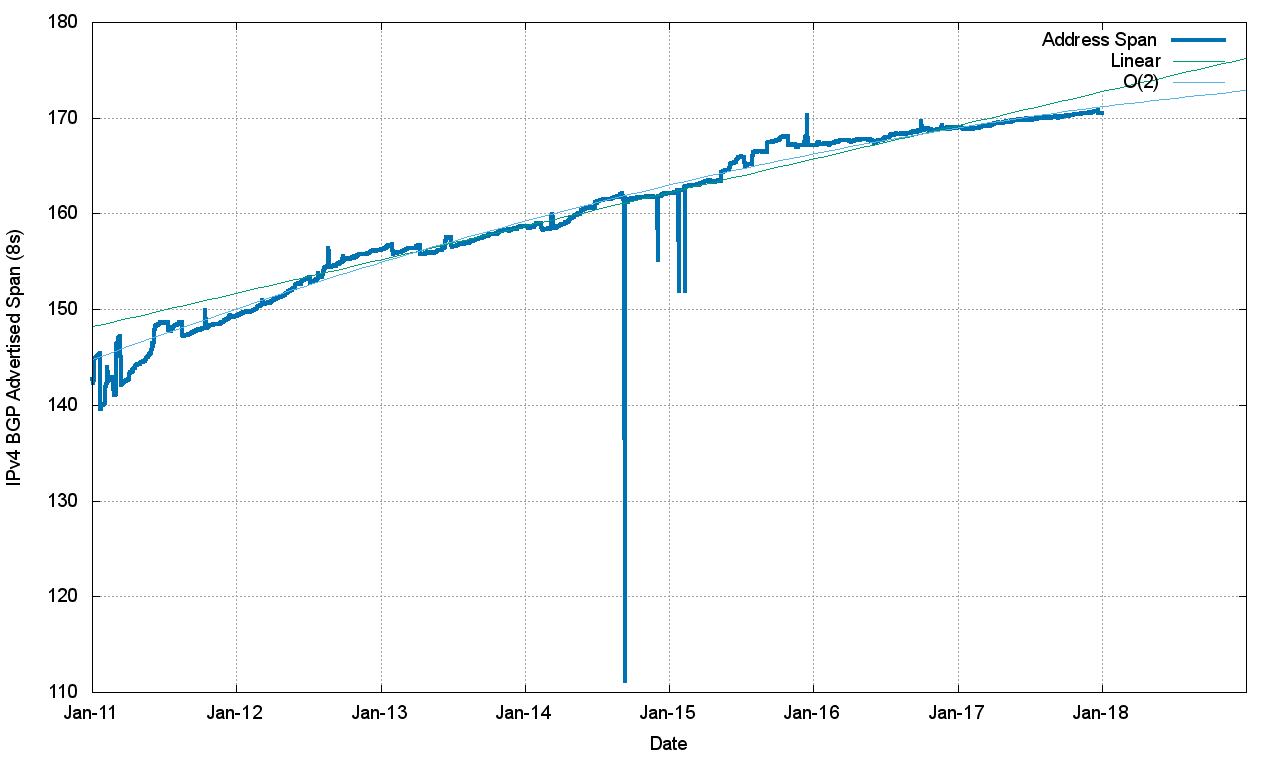 Figure 4 – IPv4 announced address span
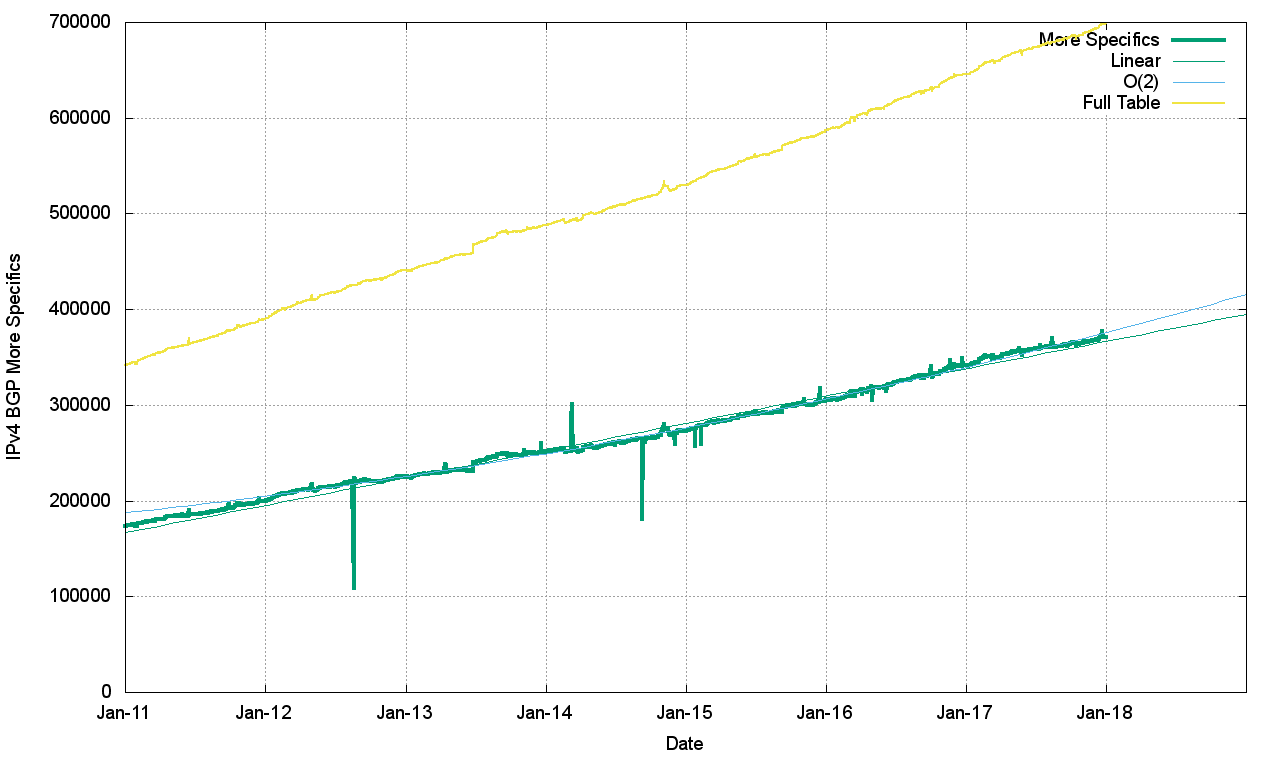 Figure 5 – IPv4 more specific announcements
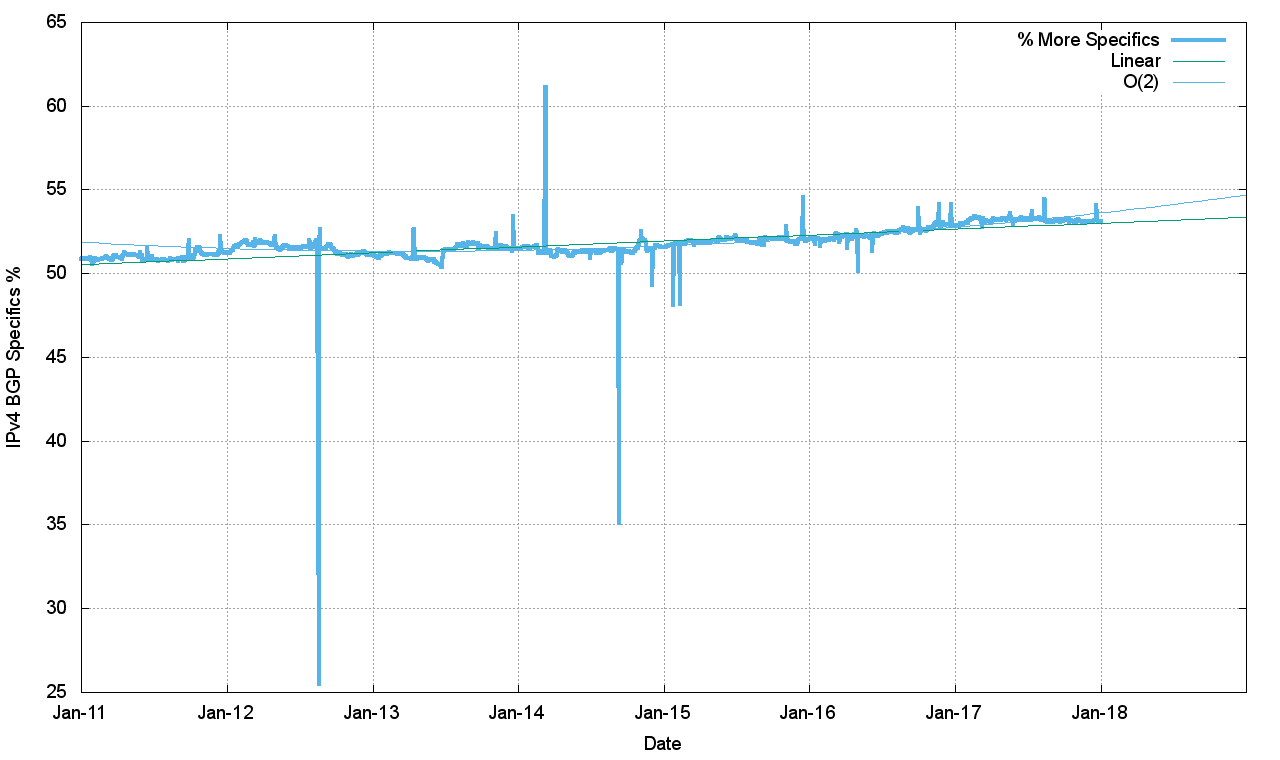 Figure 6 – IPv4 relative proportion of more specific announcements
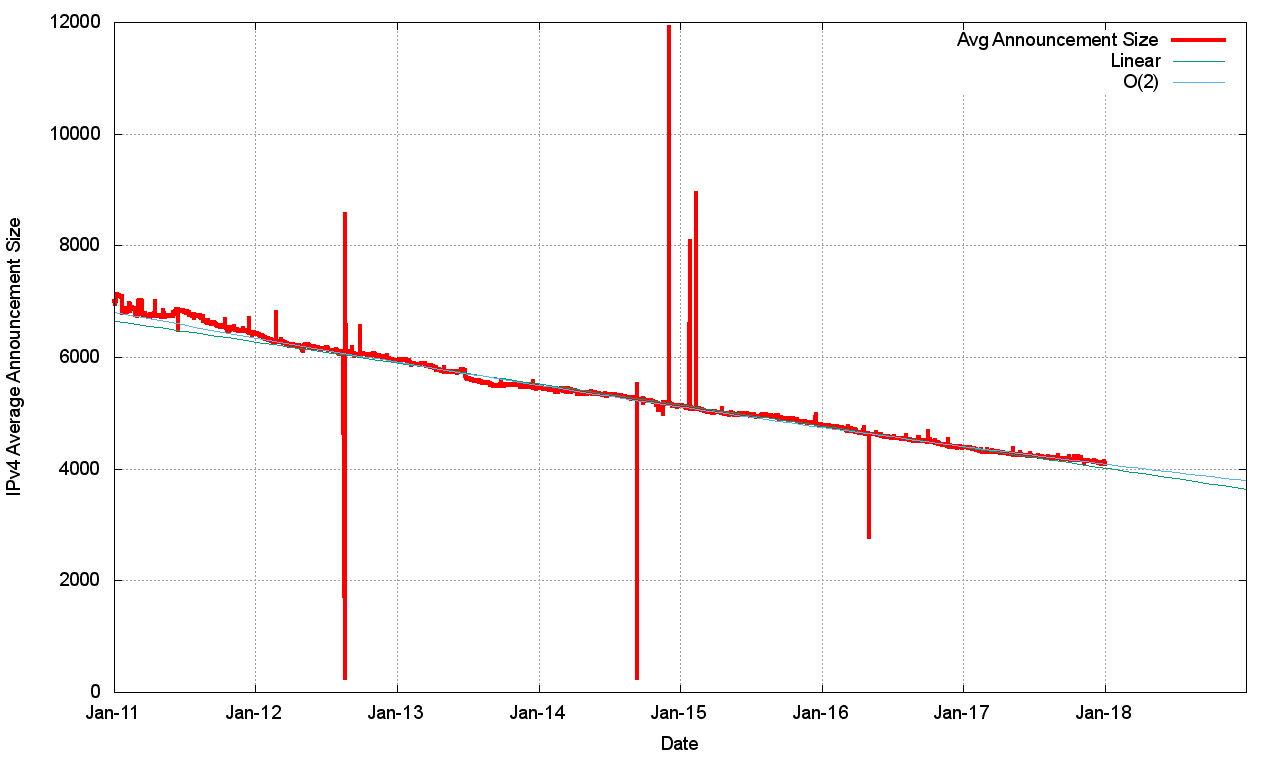 Figure 7 – IPv4 average announcement size
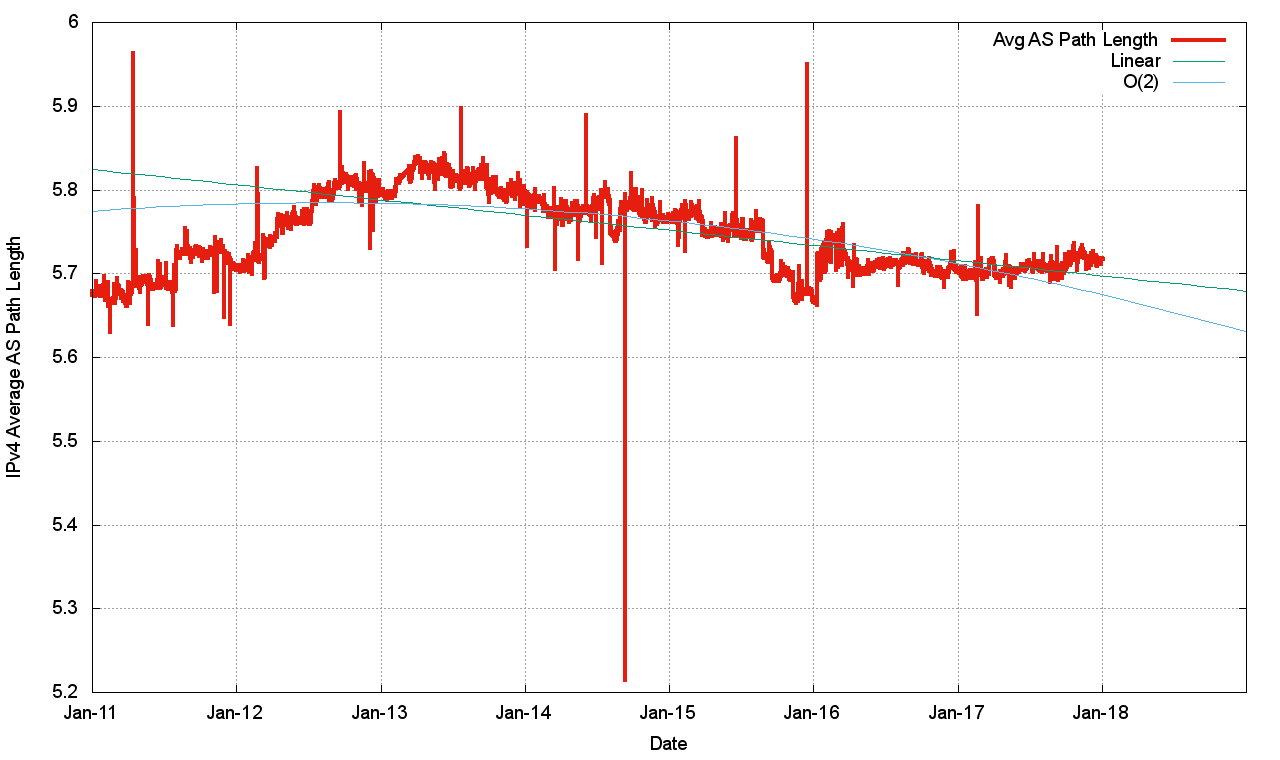 Figure 8 – IPv4 average AS path length
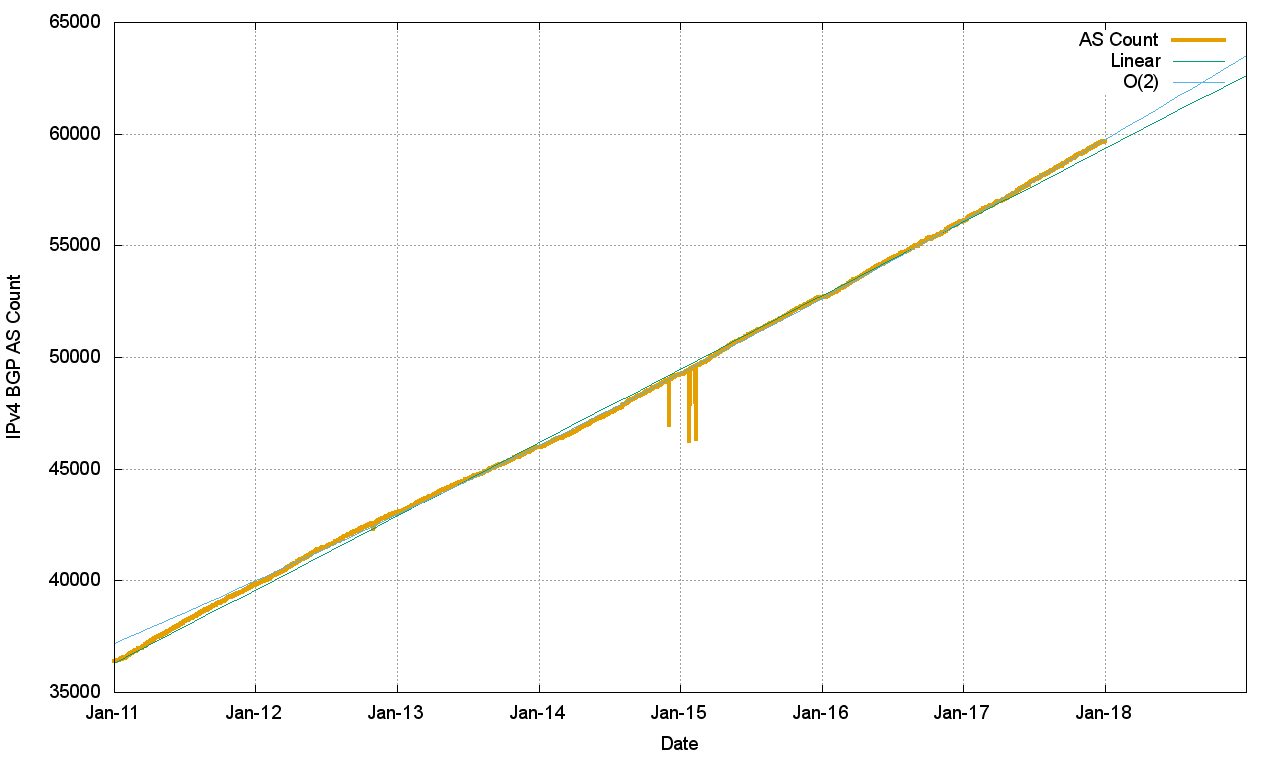 Figure 9 – IPv4 AS count
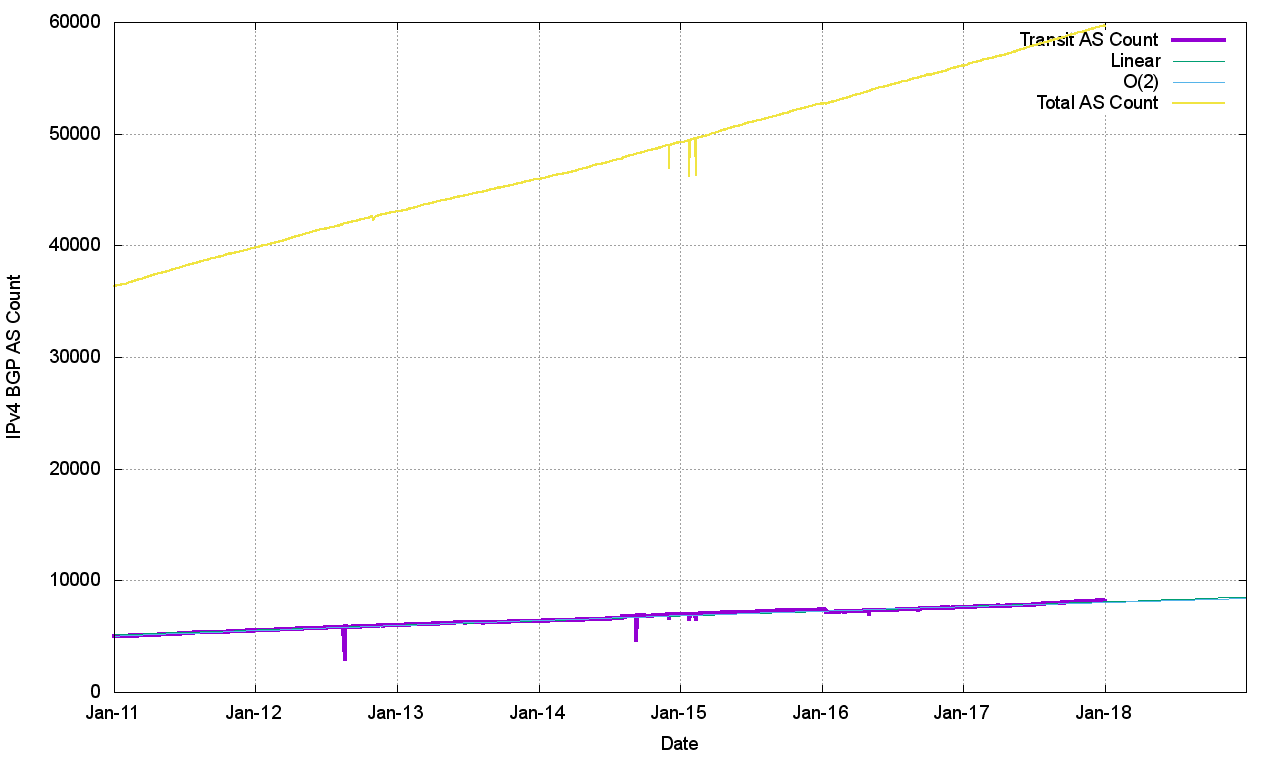 Figure 10 – IPv4 transit AS count
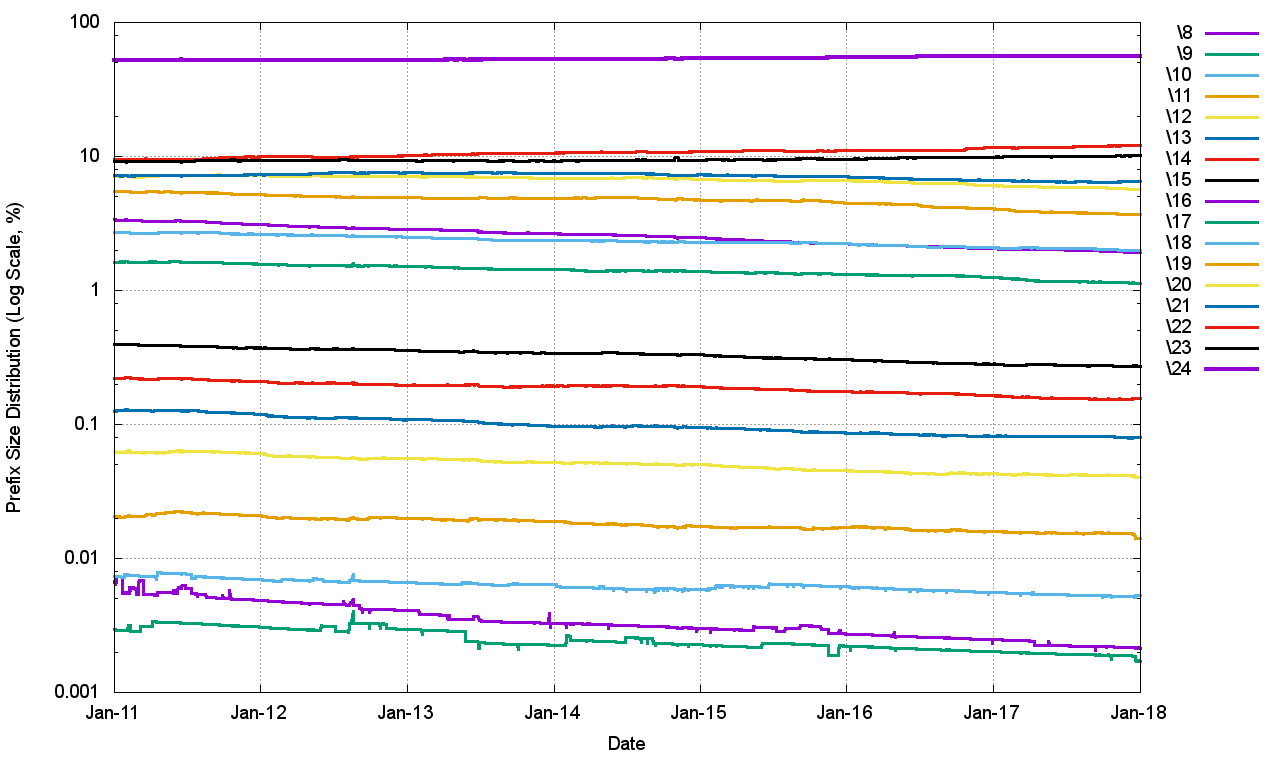 Figure 7 – IPv4 prefix size relative count (%)
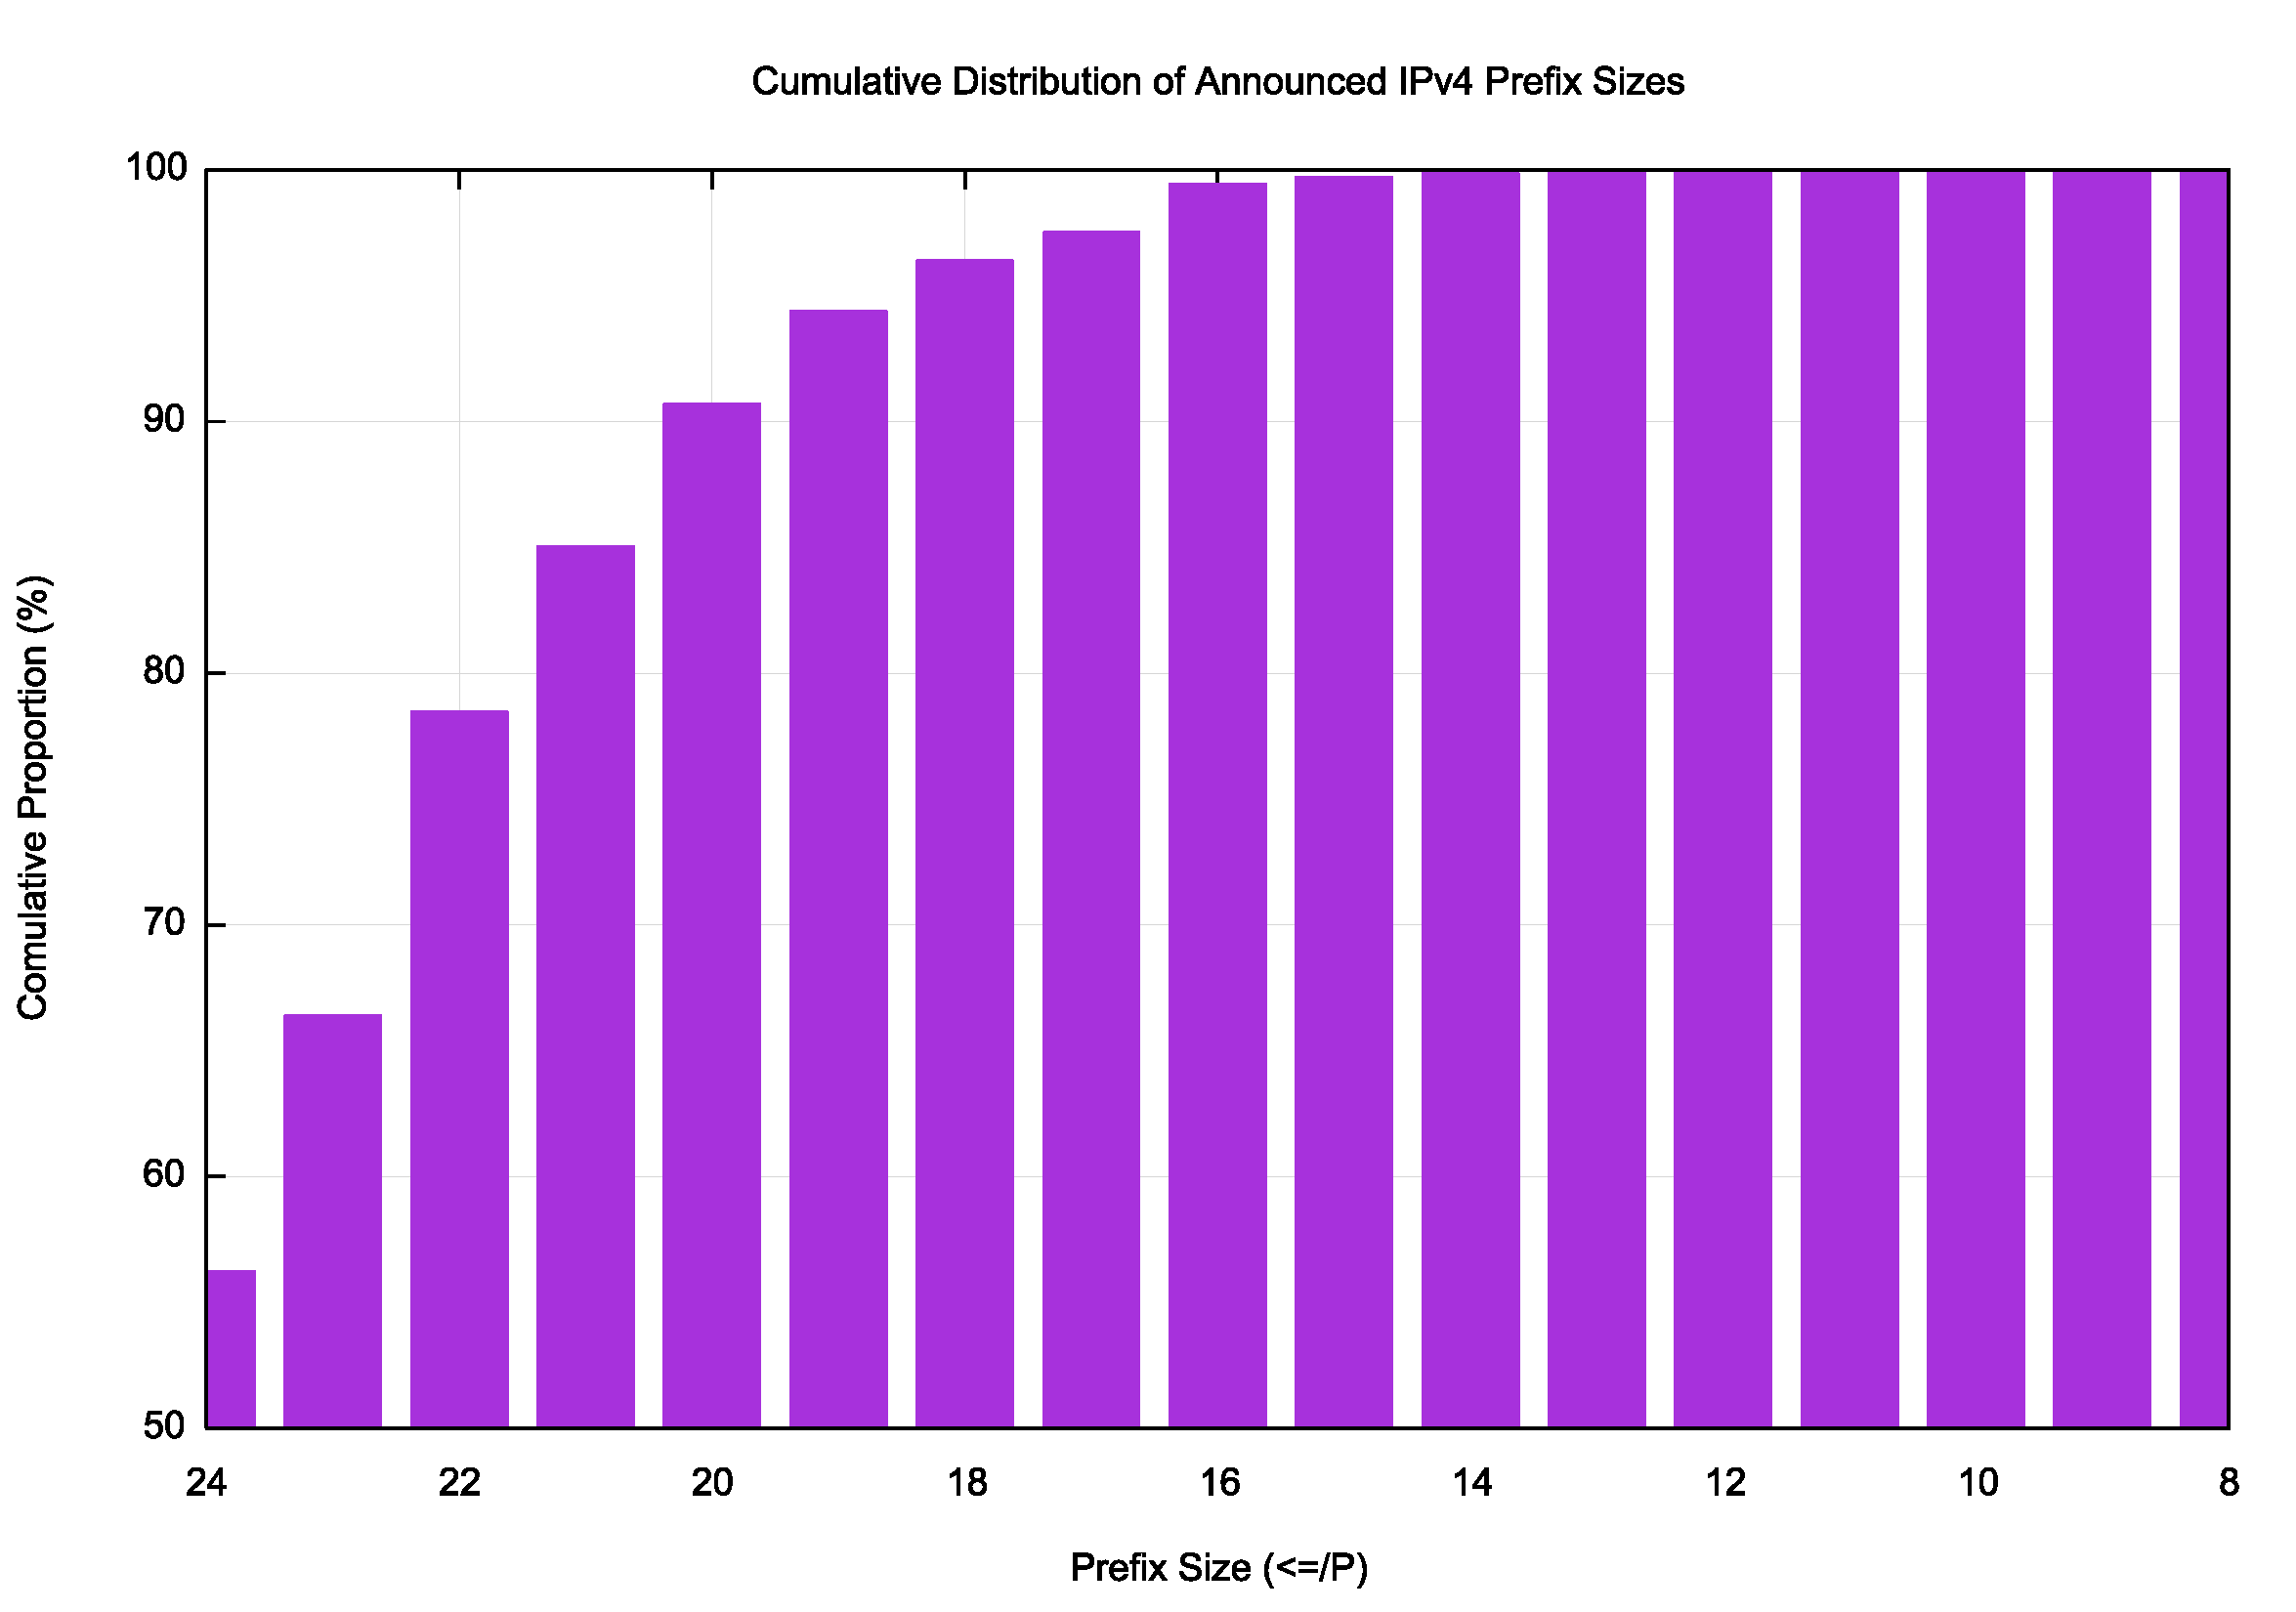 Figure 12 – IPv4 prefix cumulative distribution
Figure 3 shows the total number of routes in the routing table over this period. This is a classic ‘up and to the right’ Internet trajectory, but it should be noted that growth trends in the Internet today are strongly aligned to a quite modest linear growth model.
Over this period, we had the exhaustion of the IPv4 address space pools in IANA in January 2011, APNIC in April 2011 (serving the Asia Pacific region), in the RIPE NCC in September 2012 (serving Europe, the Middle East and parts of Central Asia), LACNIC in May 2014 (serving Latin America and the Caribbean), and ARIN in September 2015 (serving North America, and some Caribbean islands).
The eight-year period since the start of 2011 has seen the span of addresses advertised in the routing system slowing down (Figure 4). However, at the same time, there has been a consistent level of growth in the number of entries in the routing table.
The result of these two factors is that the average announcement in the IPv4 routing table is spanning fewer addresses, or, to put it another way, the granularity of the IPv4 routing space is getting finer.
As Figure 7 shows, the average BGP announcement size has dropped from 7,000 host addresses at the start of 2011 to 3,700 addresses at the end of 2018. These days, some 90% of all announced prefixes are of size /20 or smaller (Figure 12).
The topology of the network has remained relatively consistent, with the growth in the Internet being seen as increasing density of interconnectivity, rather than through extending transit paths, so the average AS path length has remained relatively constant at 5.7 for this period for this observation AS (Figure 8).
The summary of the IPv4 BGP network over the 2015-2018 period is shown in Table 1.
| Jan-16 | Jan-17 | Jan-18 | Jan-19 | 2015 growth | 2016 growth | 2017 growth | 2018 growth | |
| Prefix Count | 587,000 | 646,000 | 699,000 | 760,000 | 11% | 10% | 8% | 9% |
| Root Prefix | 281,000 | 304,000 | 328,000 | 353,000 | 9% | 8% | 8% | 8% |
| More Specs | 306,000 | 342,000 | 371,000 | 407,000 | 7% | 12% | 8% | 10% |
| Address Span (/8s) | 167.2 | 169.0 | 170.5 | 169.3 | 3% | 1% | 1% | -1% |
| AS Count | 52,700 | 56,100 | 59,700 | 63,100 | 8% | 6% | 6% | 6% |
| Transit AS | 7,600 | 7,800 | 8,500 | 9,000 | 9% | 3% | 9% | 6% |
| Stub AS | 45,100 | 48,300 | 51,200 | 54,100 | 7% | 7% | 16% | 6% |
In terms of advertised prefixes the size of the routing table continues to grow, but the 9% recorded through 2018 is slightly lower than the 11% p.a of 2015. This supports a linear growth model of the routing table size. The number of routed stub AS numbers (new edge networks) grew by 6% in 2018, which is again slightly smaller than the growth rate of 2015.
The effects of increasing scarcity of IPv4 addresses is evident, with the span of advertised networks dropping by 1% through 2018. It appears that the drivers for growth in the IPv4 network in 2018 are slowing down compared to the previous three years. As IPv4 addresses are being placed under increasingly higher scarcity pressure, the compensatory move is that the advertised address space being divided up into smaller units, and presumably this routing change is accompanied by the increasing use of IPv4 Network Address Translation (NAT) to accommodate the underlying network’s growth pressures.
The overall conclusions from this collection of observations are:
- The IPv4 network continues to grow, but as the supply of new addresses is slowing down, what is now becoming evident is more efficient use of addresses, which results in the granularity of the IPv4 inter-domain routing system becoming finer.
- The density of inter-AS interconnection continues to increase.
- The growth of the Internet is not ‘outward growth from the edge’ as the network is not getting any larger in terms of average AS path change. Instead, the growth is happening by increasing the density of the network by attaching new networks into the existing transit structure and peering at established exchange points. This makes for a network whose diameter, measured in AS hops, is essentially static, yet whose density, measured in terms of prefix count, AS interconnectivity and AS Path diversity, continues to increase. This denser mesh of interconnectivity could potentially be problematic in terms of convergence times if the BGP routing system used a dense mesh of peer connectivity, but the topology of the network continues along a clustered hub and spoke model, where a small number of transit ASs directly service a large number of stub edge networks. This implies that the performance of BGP in terms of time and updates required to reach convergence continues to be relatively static.
The IPv6 BGP Table data
A similar exercise has been undertaken for IPv6 routing data. There is considerable diversity in the number of routes seen at various vantage points in the Internet, as shown when looking at the prefix counts advertised by all the peers of Route Views (Figure 13).
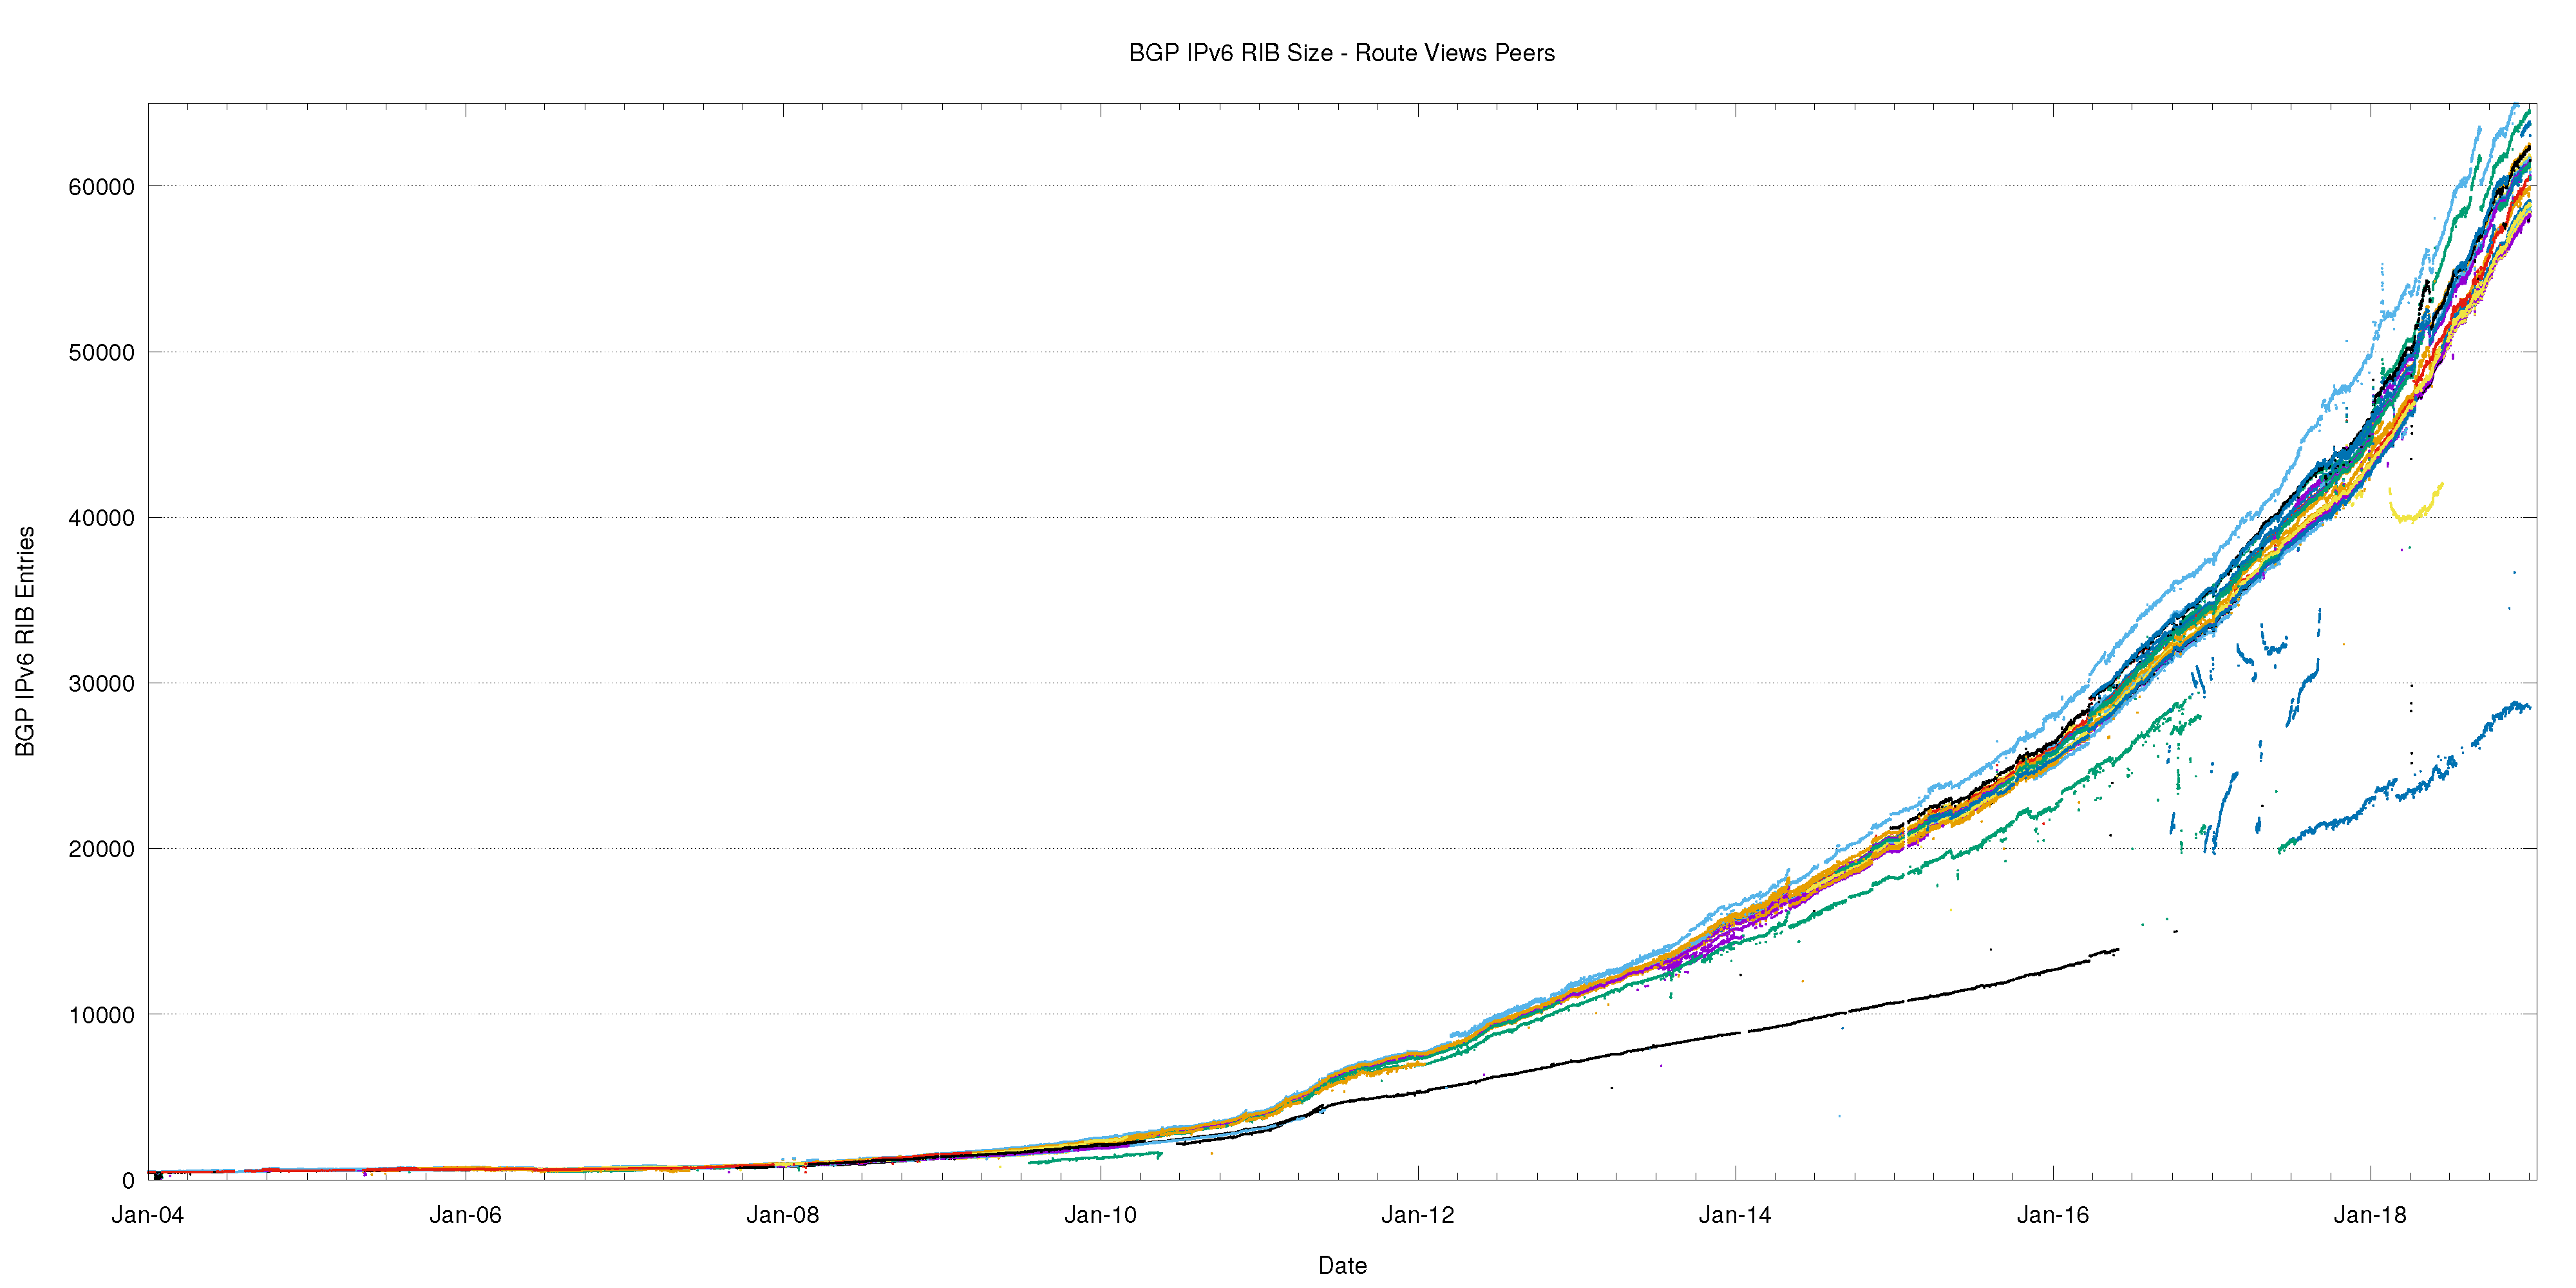
Figure 13 — IPv6 routing table since 2004 as seen by RouteViews peers.
A more detailed look at 2017 and 2018, incorporating both RouteViews and RIS (Figure 14), shows that in IPv6 there is no visible disparity in the route sets announced by RIS peers as compares to RouteViews peers.
It is also evident that there increasing diversity between various BGP views as to what constitutes the ‘complete’ IPv6 route set, and the variance at the end of 2018 now span some 8,000 prefix advertisements.
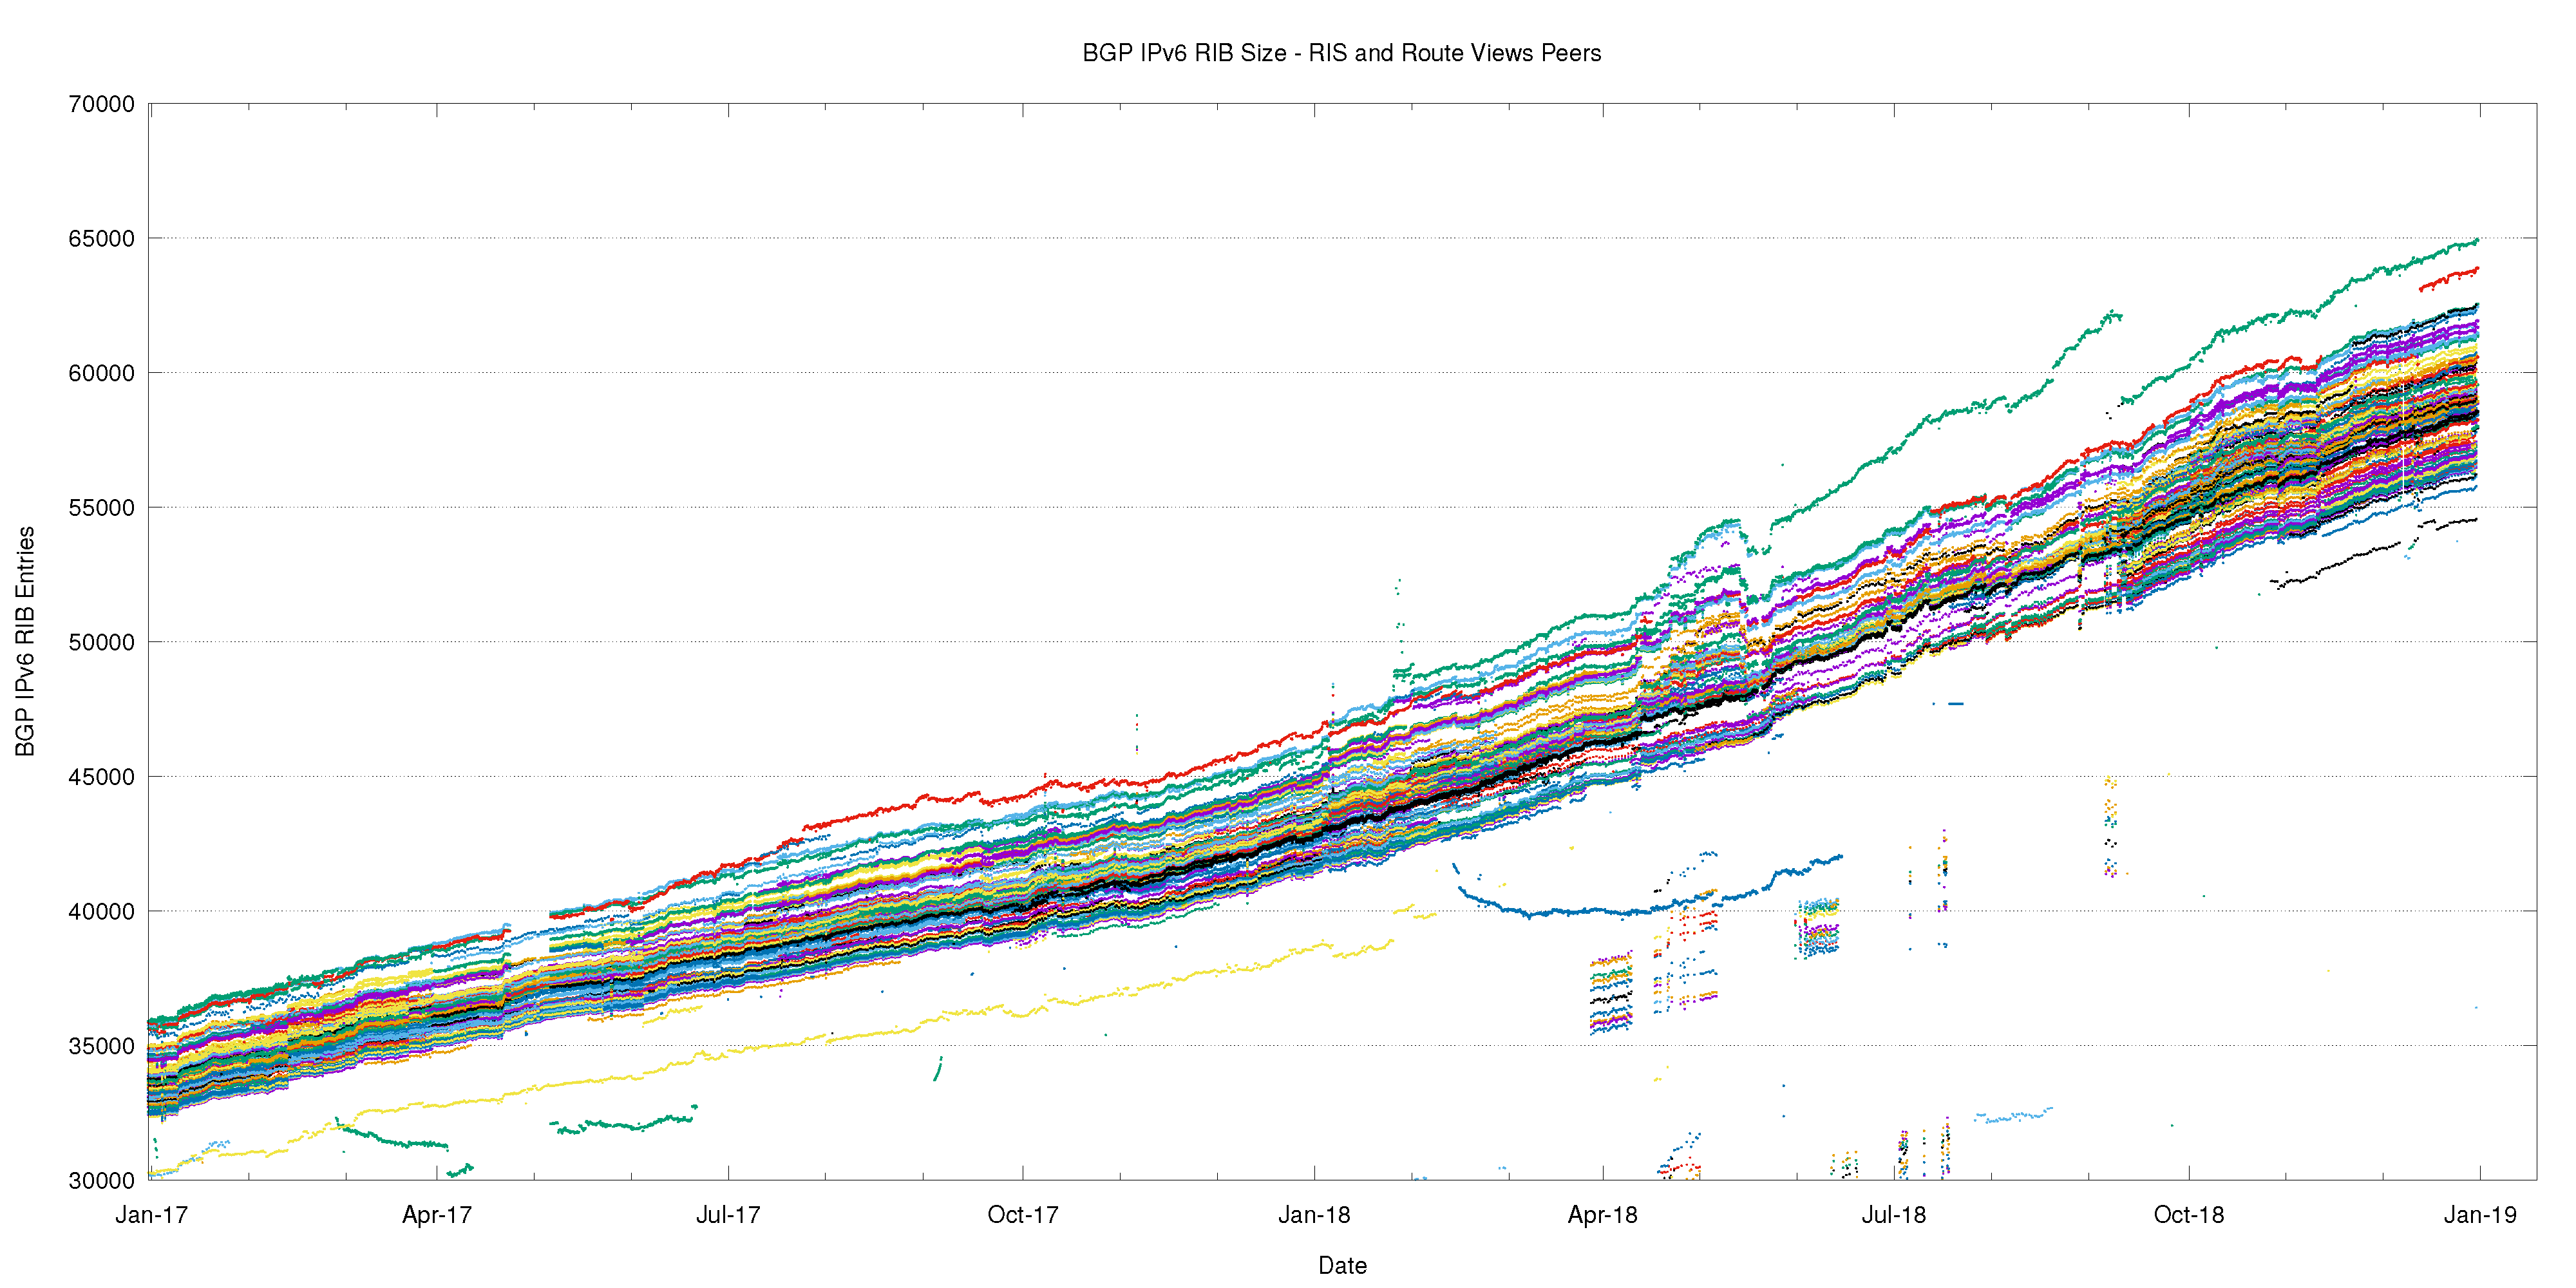
Figure 14 — IPv6 routing table 2016–2018 as seen by RouteViews and RIS Peers.
The comparable profile figures for the IPv6 Internet are shown in Figures 15 through 24.
 Figure 15 – IPv6 BGP routing table size (RIB)
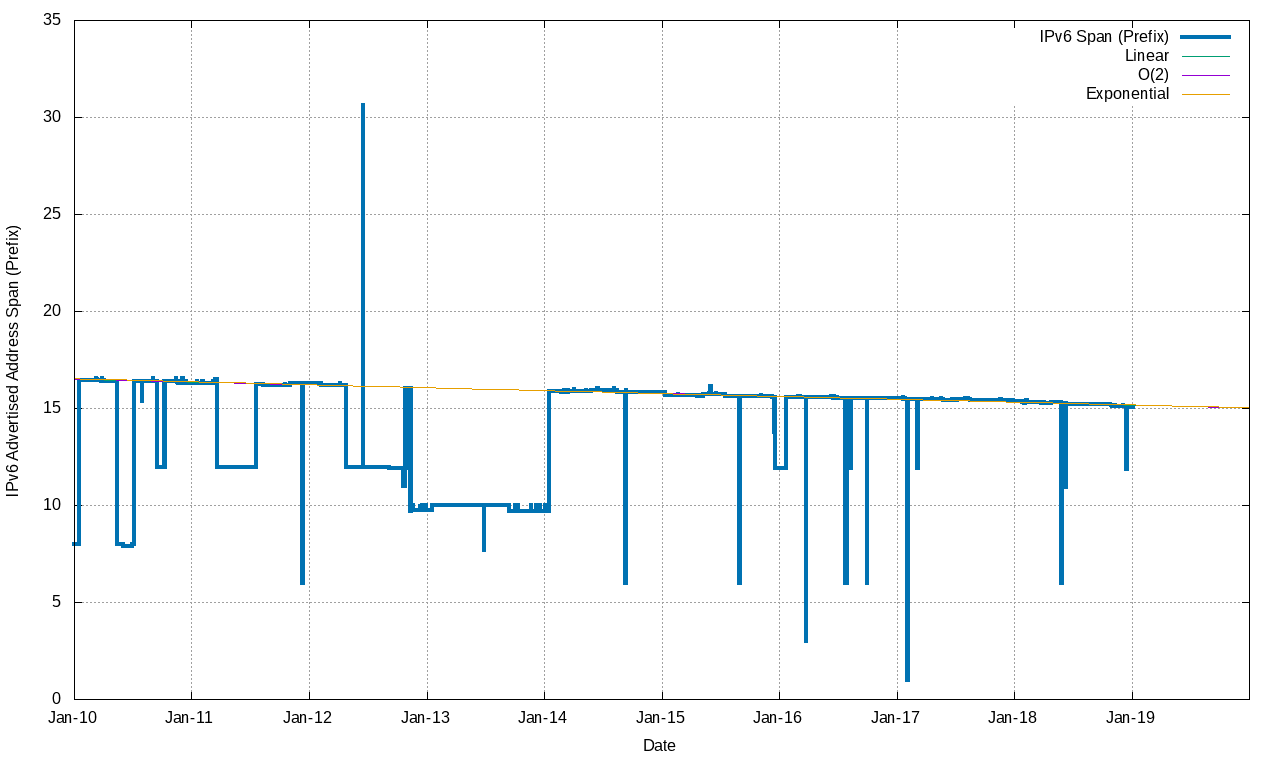 Figure 16 – IPv6 announced address span (prefix size)
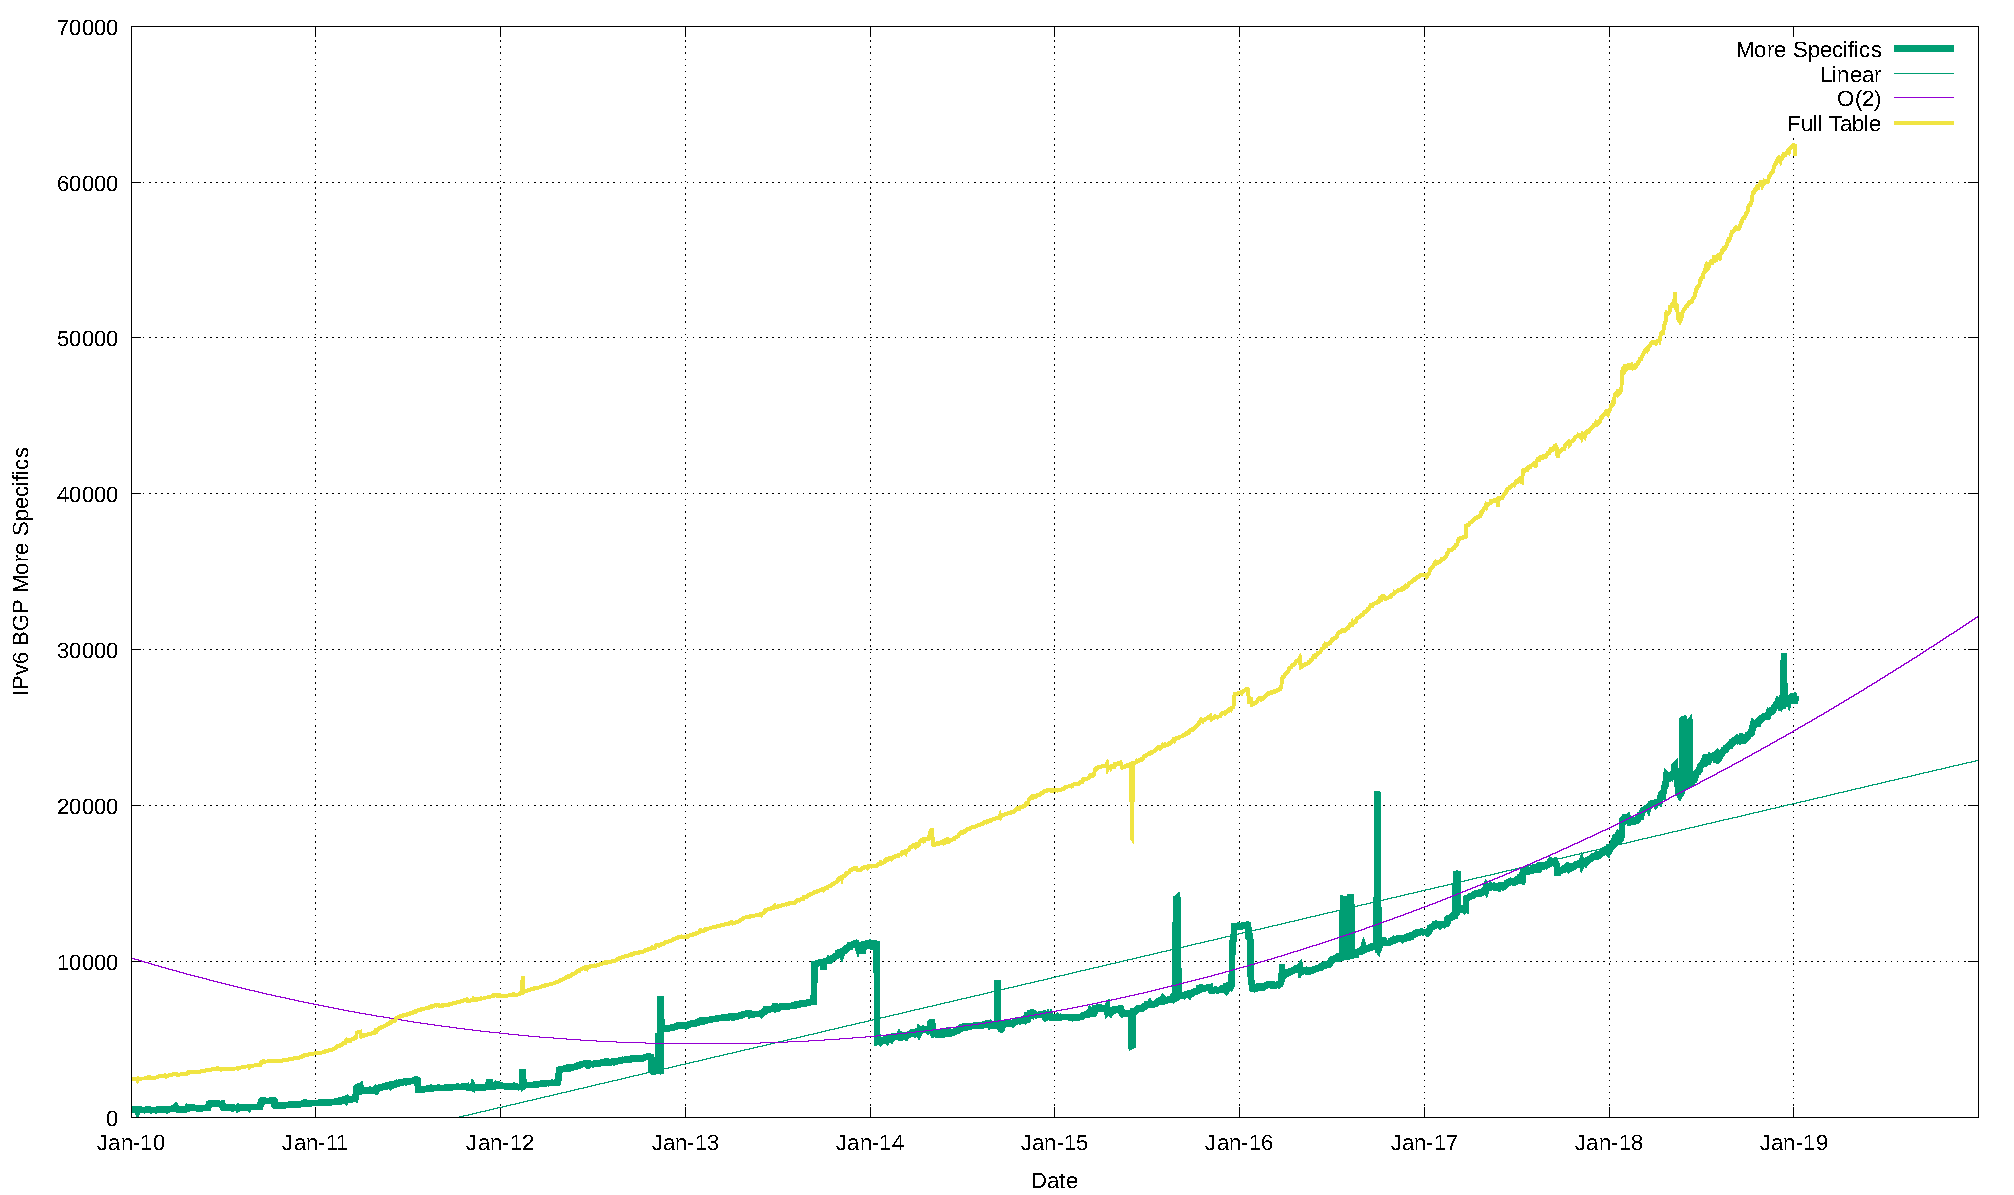 Figure 17 – IPv6 more specific prefix advertisements
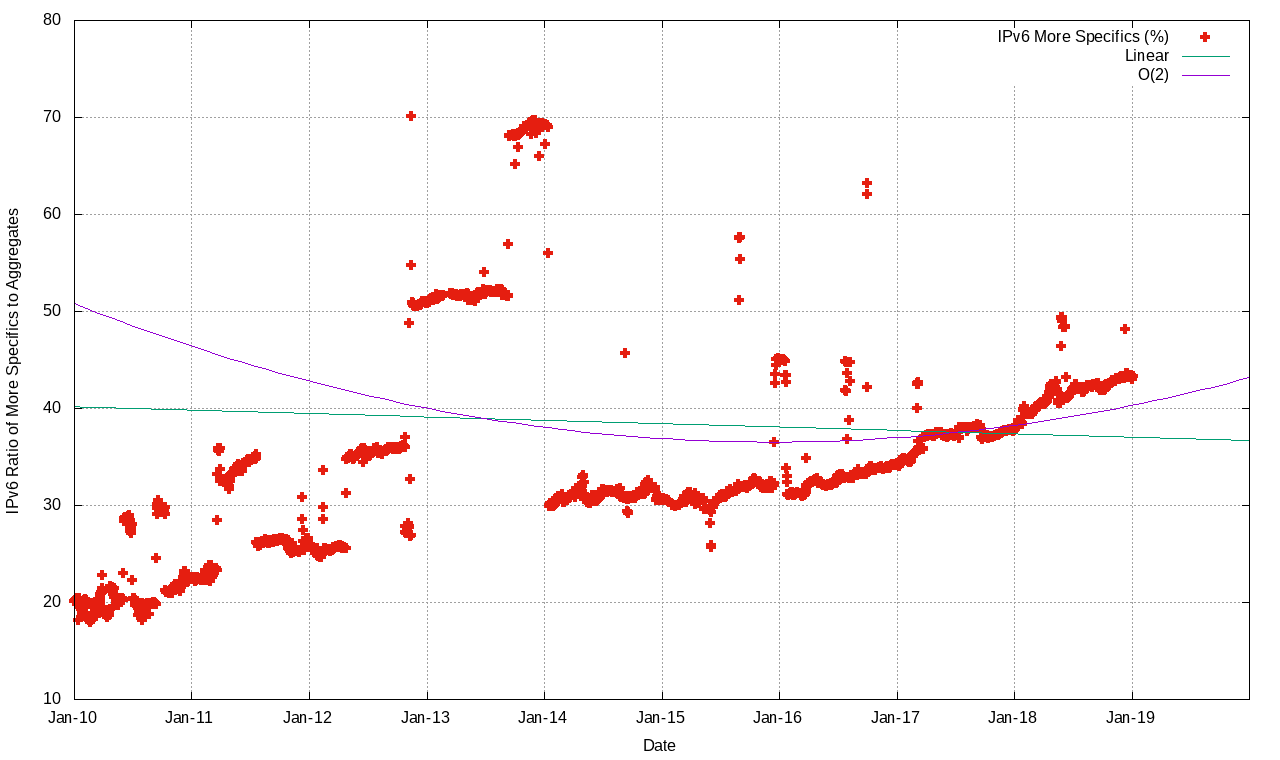 Figure 18 – Proportion of more specific announcements (%)
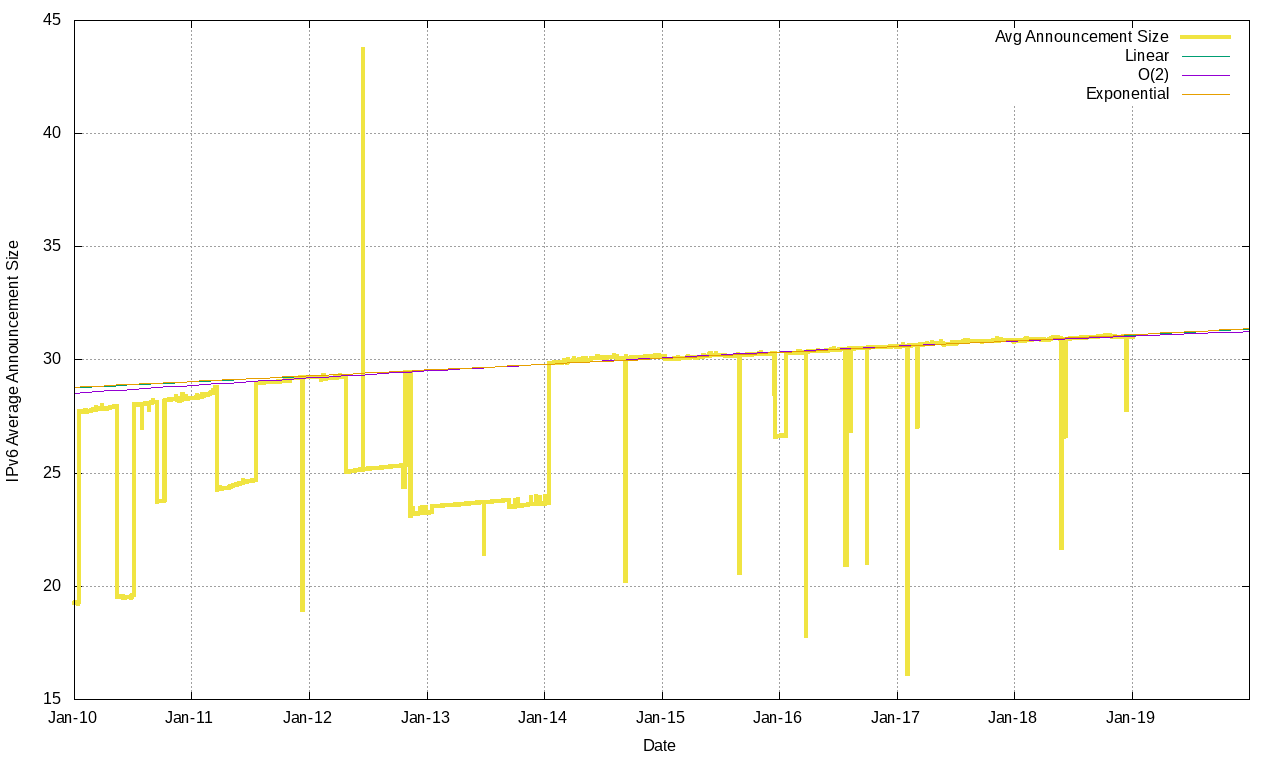 Figure 19 – IPv6 average prefix size
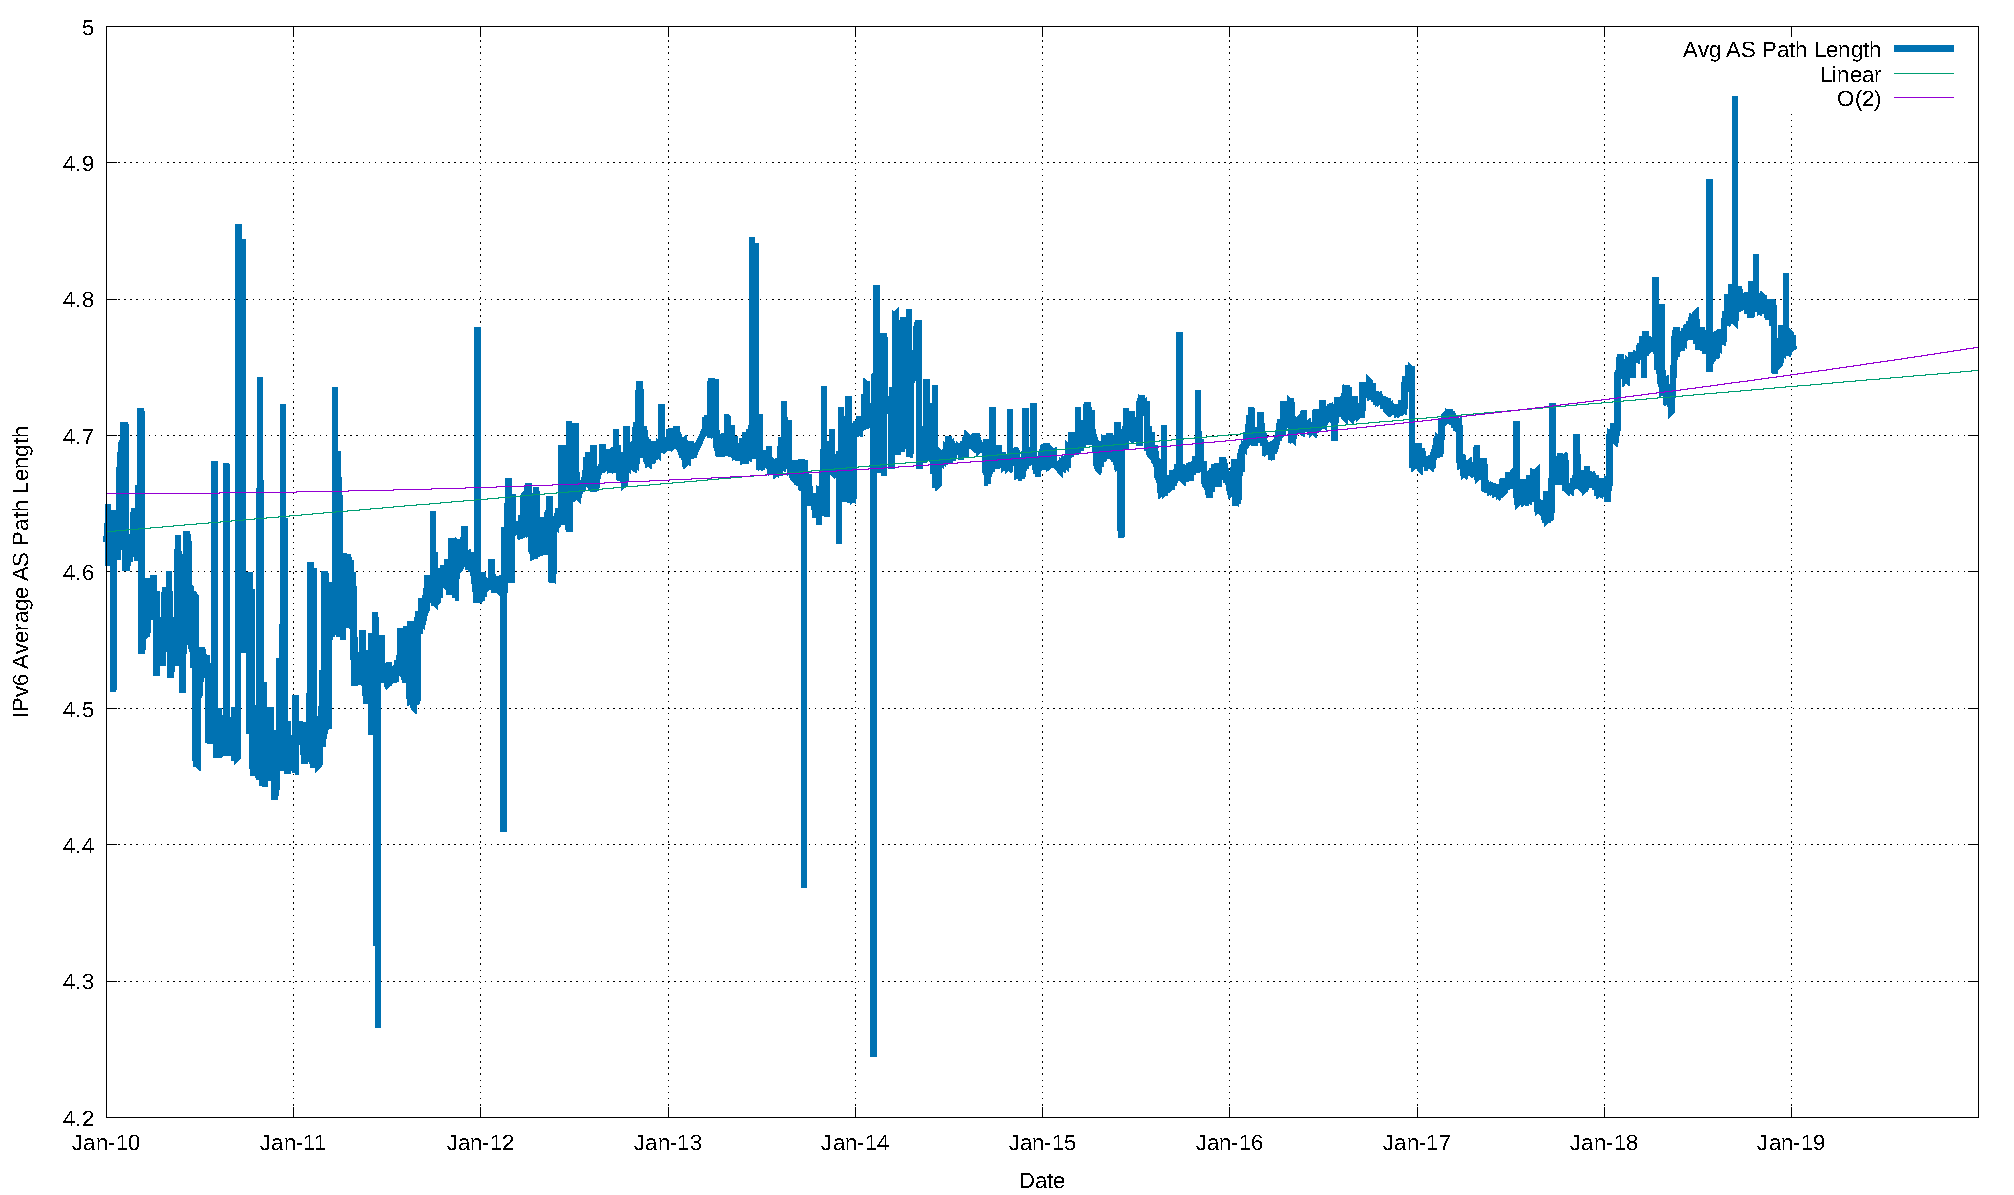 Figure 20 – IPv6 average AS path length
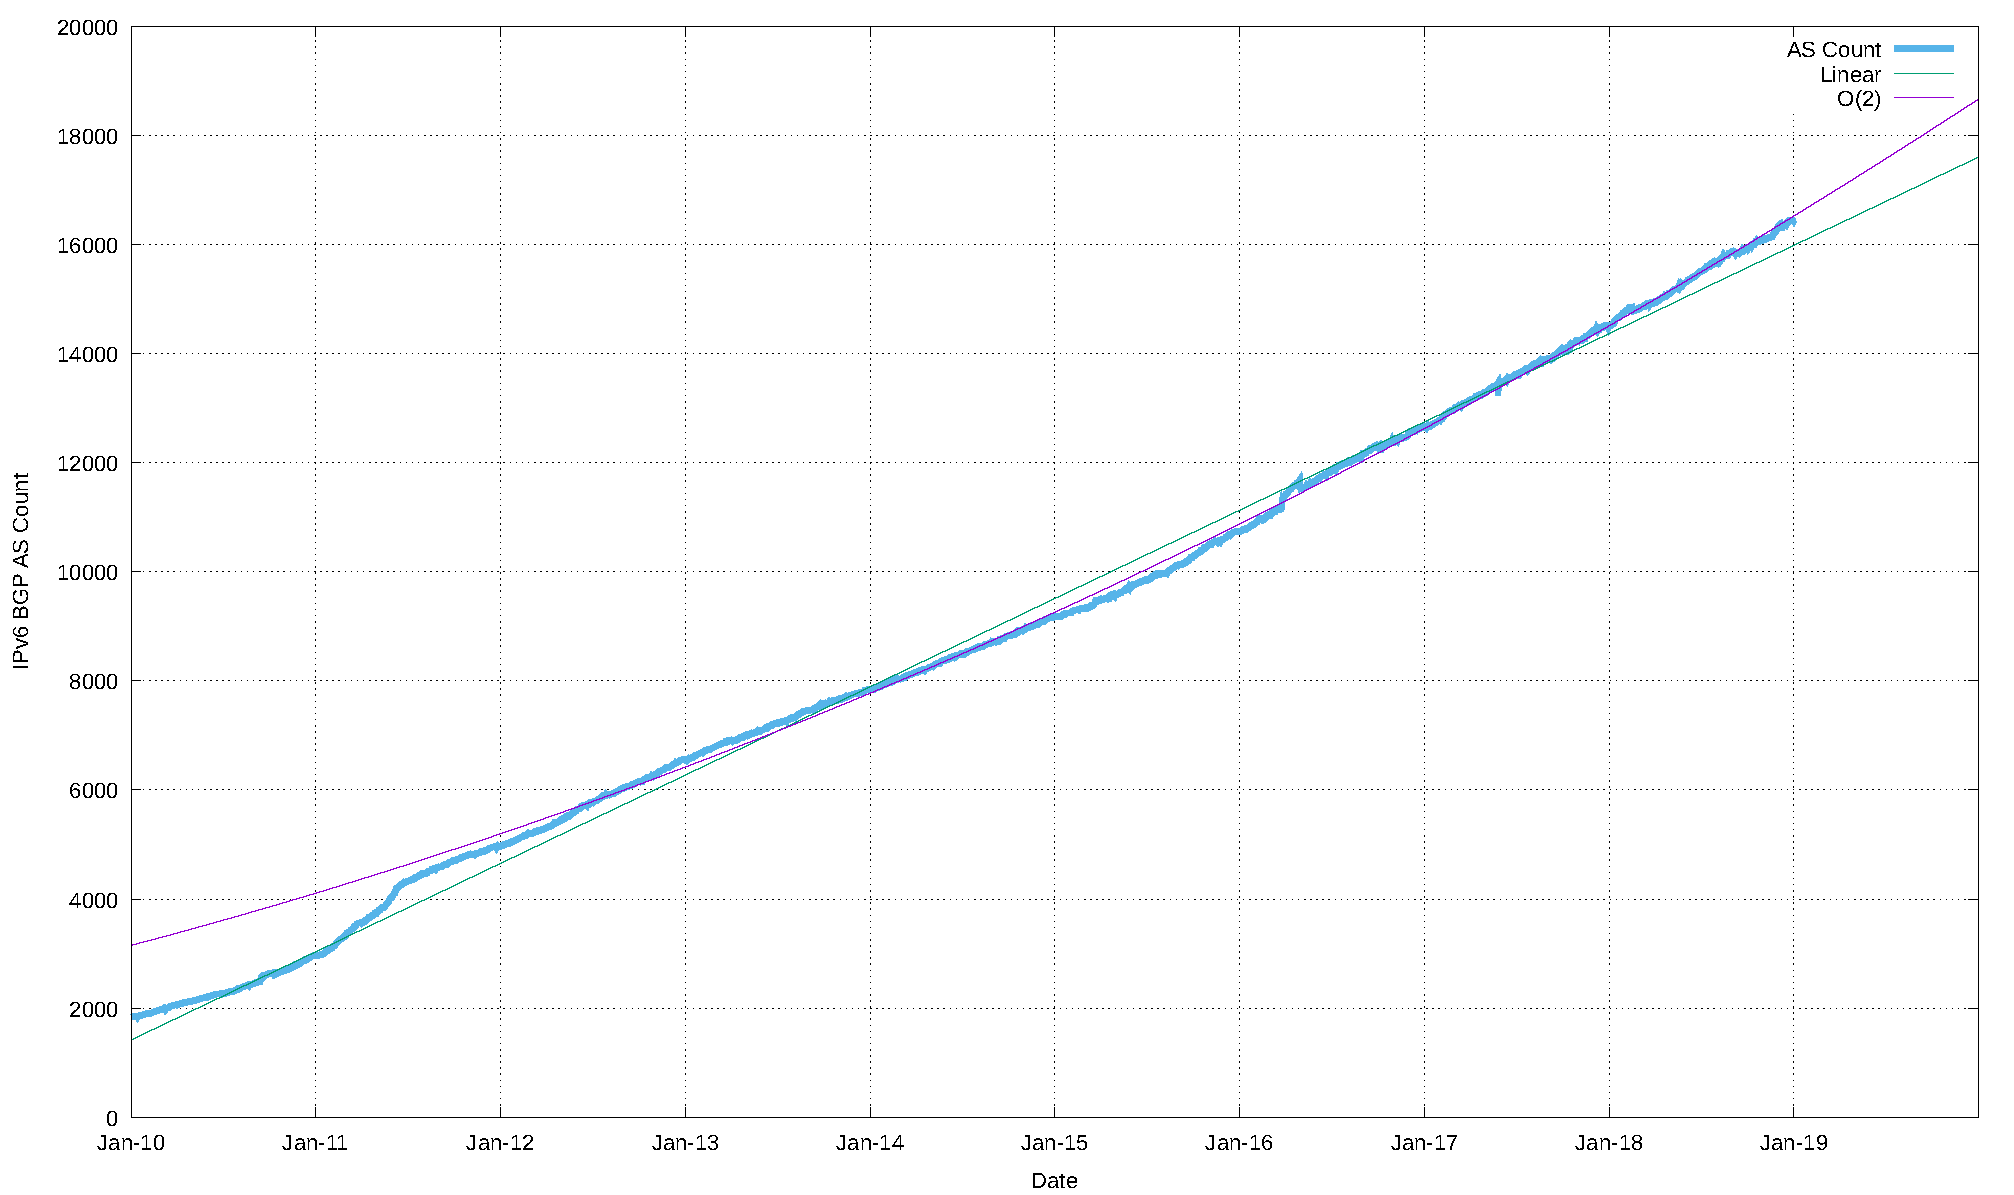 Figure 21 – IPv6 AS count
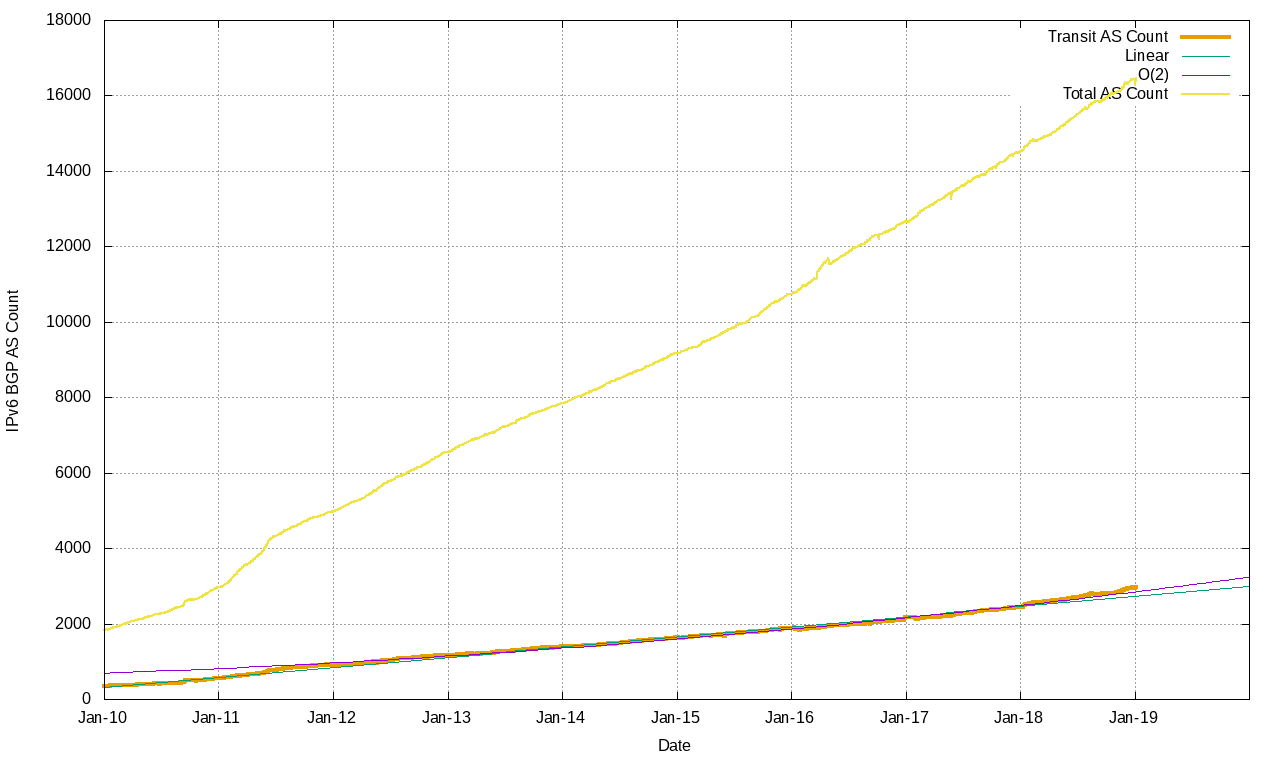 Figure 22 – IPv6 transit AS count
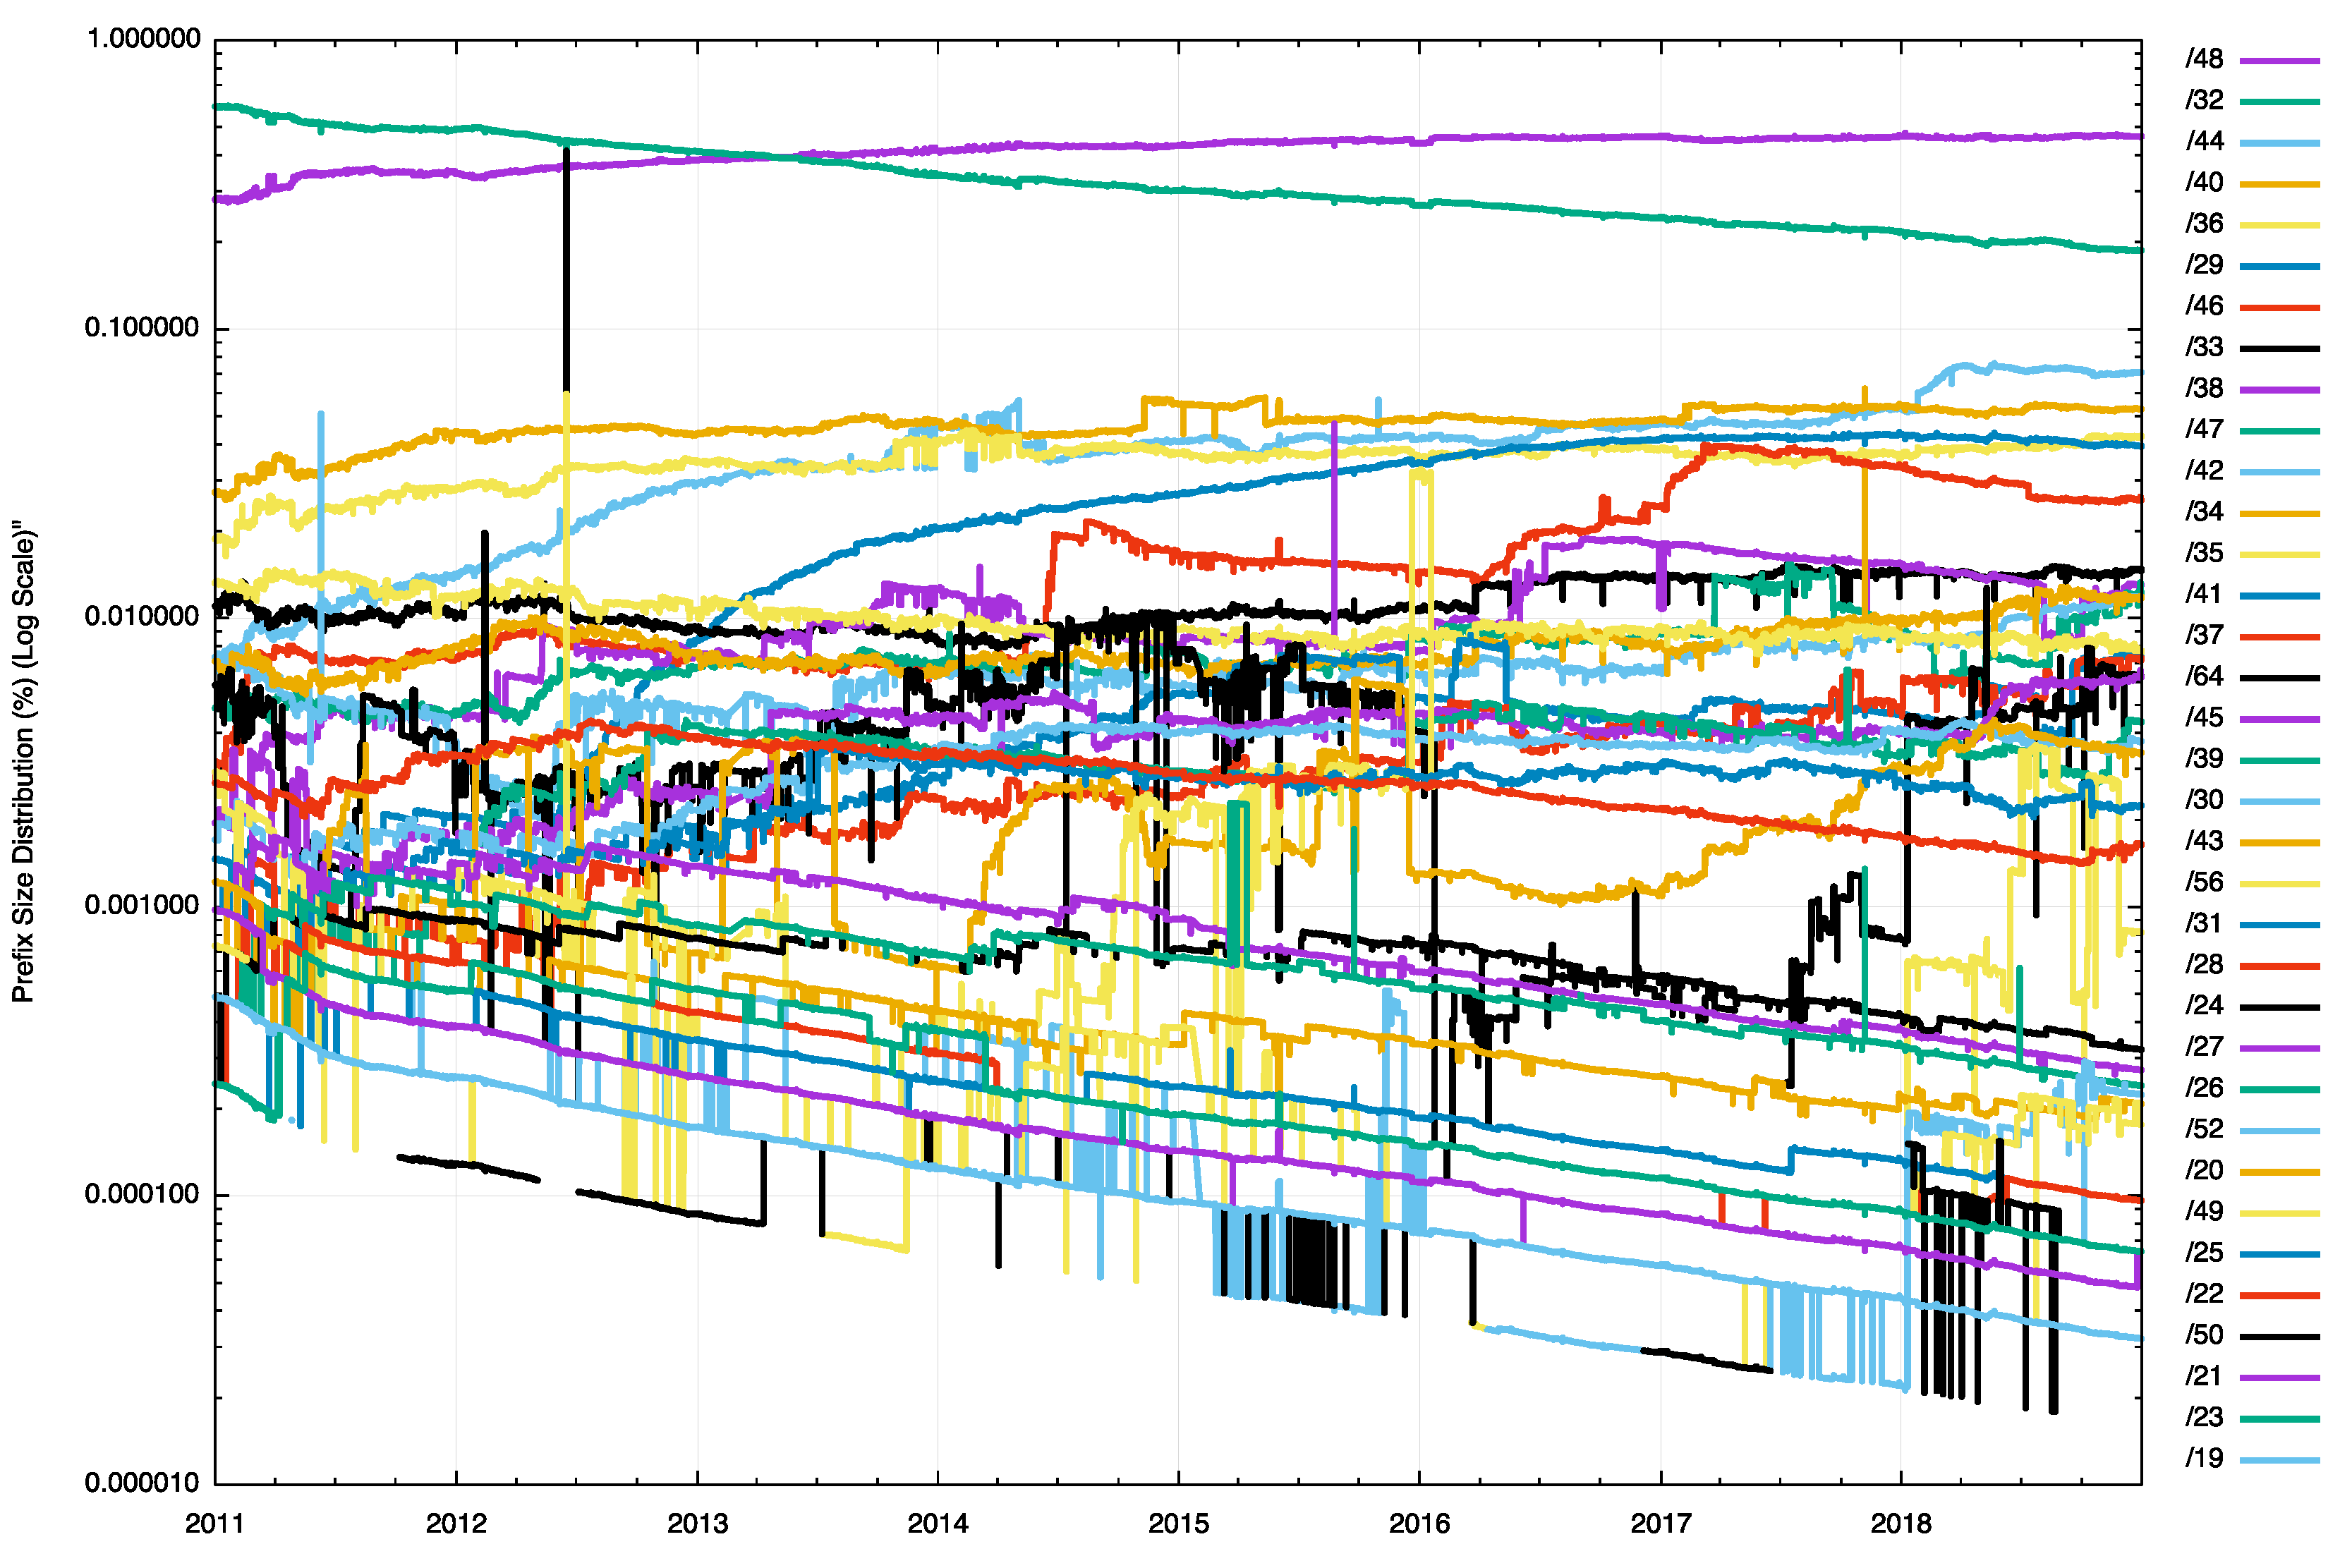 Figure 23 – IPv6 prefix size relative count (%)
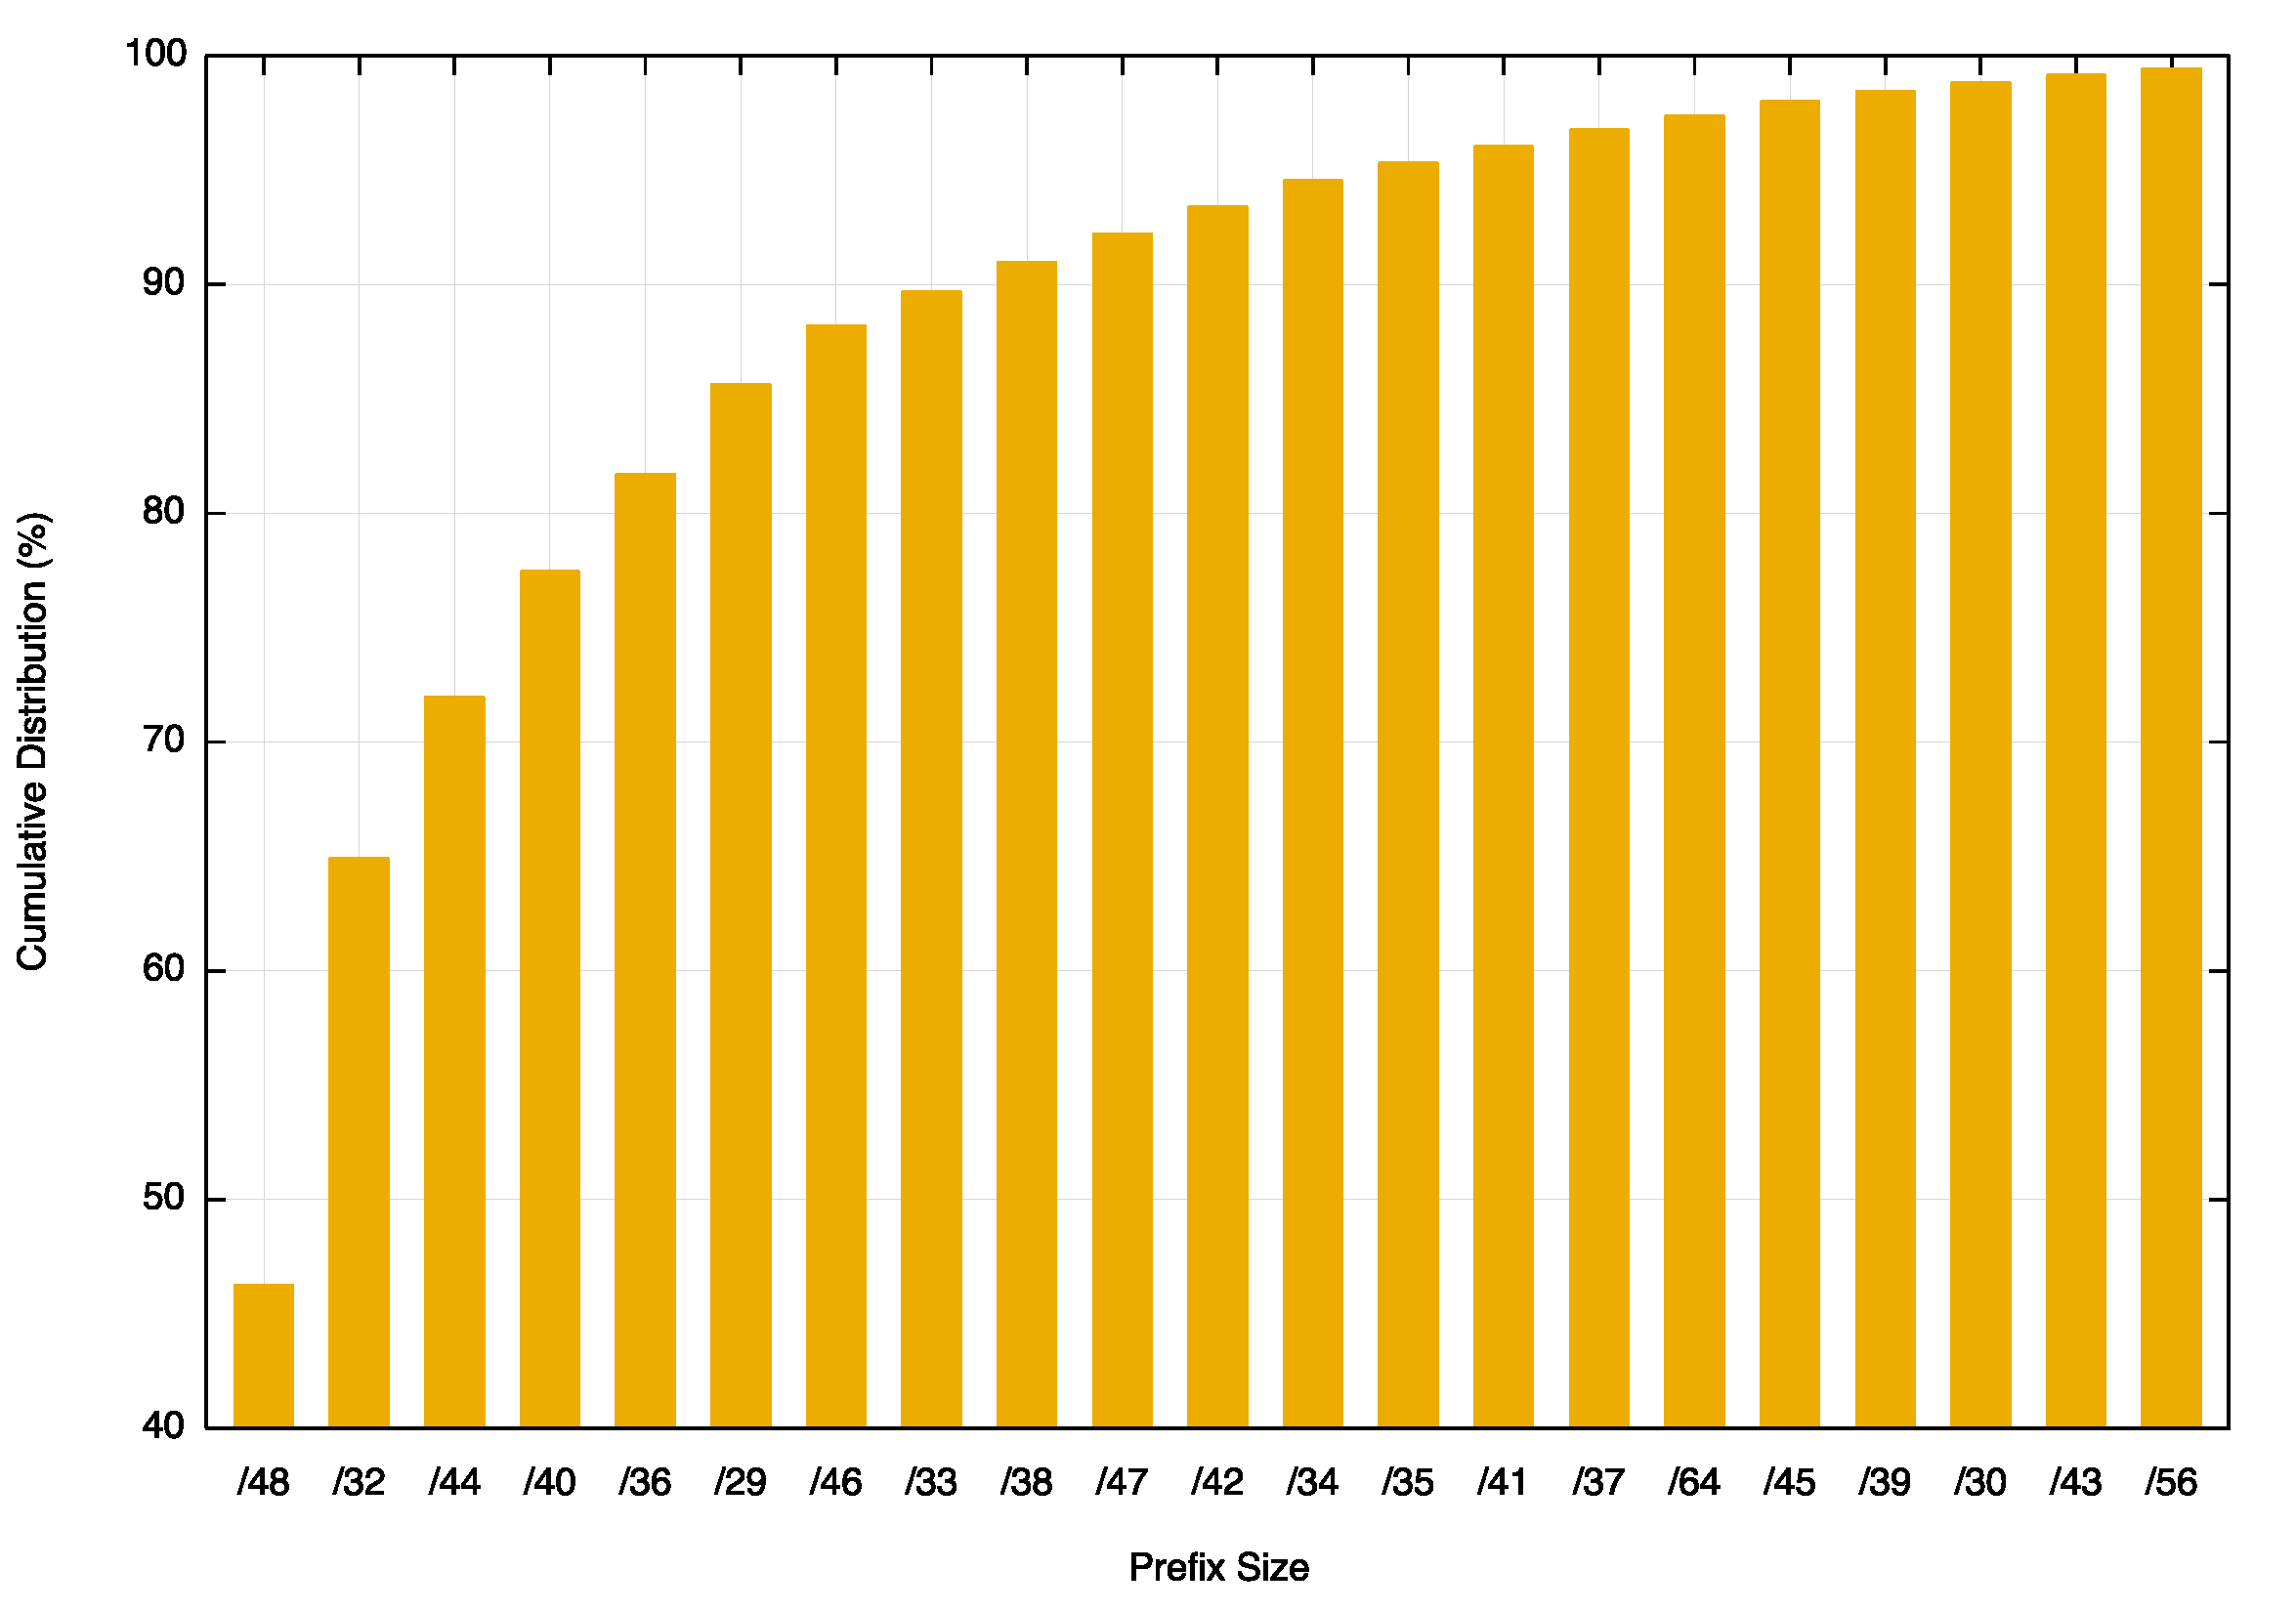 Figure 24 – IPv6 prefix size cumulative distribution
Routing advertisements of /48s are the most prevalent prefix size in the IPv6 routing table, and 90% of the table entries are composed of /48, /32, /44, /40, /36, /29, /46 and /33 prefixes. RIR allocations of IPv6 addresses show a different pattern, with 75% of address allocations are either a /32 (54%) or a /29 (21%). Some 18% of allocations are a /48. What is clearly evident is that there is no clear correlation between an address allocation size and the advertised address prefix size.
Why is the IPv6 routing table being fragmented so extensively?
The conventional response is that this is due to the use of more specific route entries to perform traffic engineering. However given that IPv6 traffic volumes still tend to be far lower than IPv4 volumes for most networks, this rationale probably does not apply in all cases.
Another possible reason is the use of more specifics to counter efforts of route hijacking. This also has issues, given that it appears that most networks appear to accept a /64 prefix, and the deaggregation prefix is typically a /48, so as a counter-measure for more specific route hijacks it may not be all that effective.
This brings up the related topic of the minimum accepted route object size. The common convention in IPv4 is that a /24 prefix advertisement will propagate across the entire IPv4 default-free zone. More complex minimum size rules have largely fallen into disuse as address trading appears to be slicing up many of the larger address blocks into smaller sizes.
If a /24 is the minimum accepted route prefix size in IPv4, what is the comparable size in IPv6? There appears to be no common consensus position here, and the default is to use no minimum size filter. In theory that would imply that a /128 would be accepted across the entire IPv6 default-free zone, but a more pragmatic observation is that a /32 would be assuredly accepted by all networks, and it appears that many network operators believe that a /48 is also generally accepted.
Given that a /48 is the most common prefix size in today’s IPv6 network this belief appears to be the case. However, we also see prefixes smaller in size than a /48 with /50, /56 and /64 prefixes being the most common.
The summary of the IPv6 BGP profile for period 2016 through to the start of 2019 is shown in Table2. While the routing table grew significantly over 2018, the majority of that growth was in the announcement of more specifics rather than in announcing root address prefixes.
| Jan-16 | Jan-17 | Jan-18 | Jan-19 | 2015 growth | 2016 growth | 2017 growth | 2018 growth | |
| Prefix Count | 27,200 | 34,800 | 47,700 | 62,400 | 30% | 28% | 31% | 37% |
| Root Prefix | 17,800 | 22,900 | 28,200 | 35,400 | 22% | 29% | 23% | 26% |
| More Specs | 9,400 | 11,900 | 17,500 | 27,000 | 47% | 27% | 47% | 54% |
| Address Span (/32s) | 71,000 | 76,600 | 102,700 | 124,900 | 22% | 8% | 34% | 22% |
| AS Count | 10,700 | 12,700 | 14,500 | 16,470 | 18% | 19% | 14% | 14% |
| Transit AS | 2,000 | 2,400 | 2,600 | 3,190 | 18% | 20% | 8% | 23% |
| Stub AS | 8,700 | 10,300 | 11,900 | 13,280 | 18% | 18% | 16% | 12% |
The predictions
What can this data from 2018 tell us in terms of projections of the future of BGP in terms of BGP Table size?
Forecasting the IPv4 BGP Table
Figure 25 shows the data set for BGP from January 2011 until January 2019. This plot also shows the fit of these most recent 4 years of data to various models.
The first order differential, or the rate of growth, of the BGP routing table is shown in Figure 26. The seven-year average rate of growth of the routing table appears be rising slowly from 140 to 160 additional entries per day. This data suggests that a reasonable prediction of IPv4 BGP Table size can be generated using a linear growth model of approximately 150 additional routing entries per day (Figure 26).
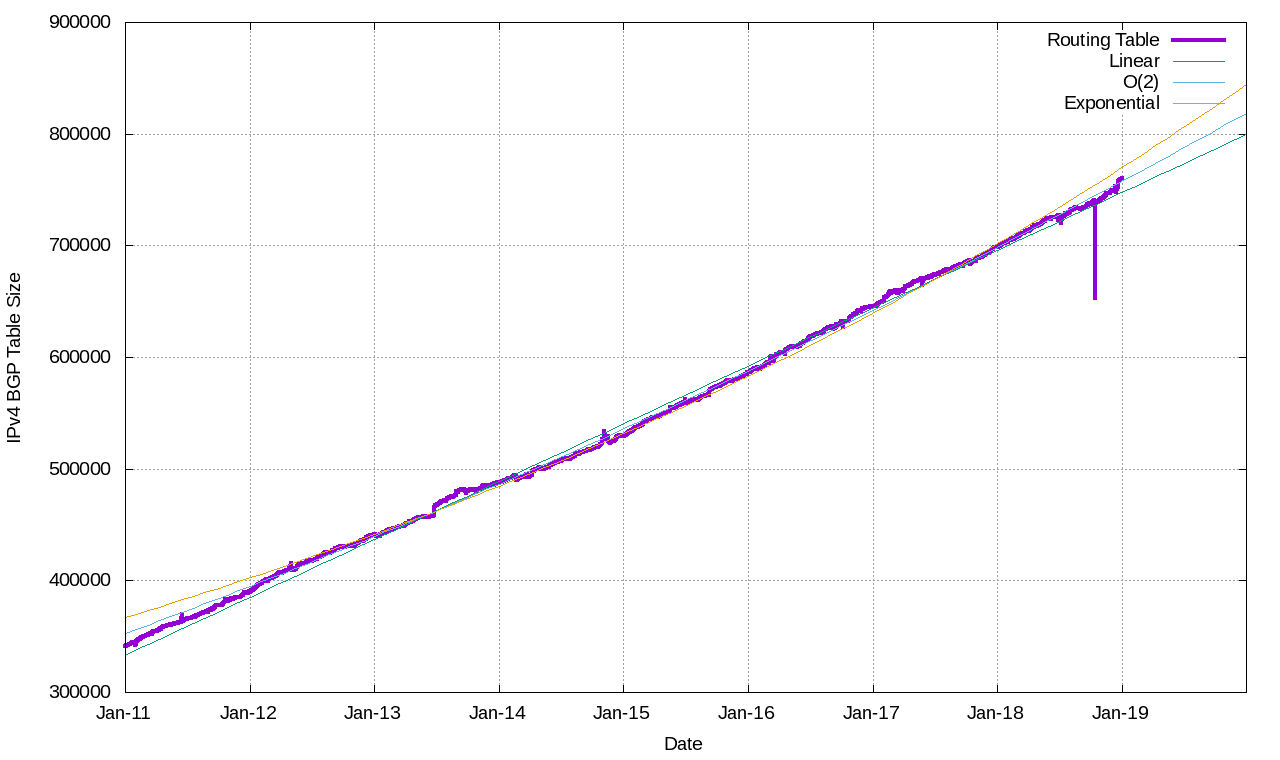
Figure 25 — IPv4 BGP Table 2014-2018.
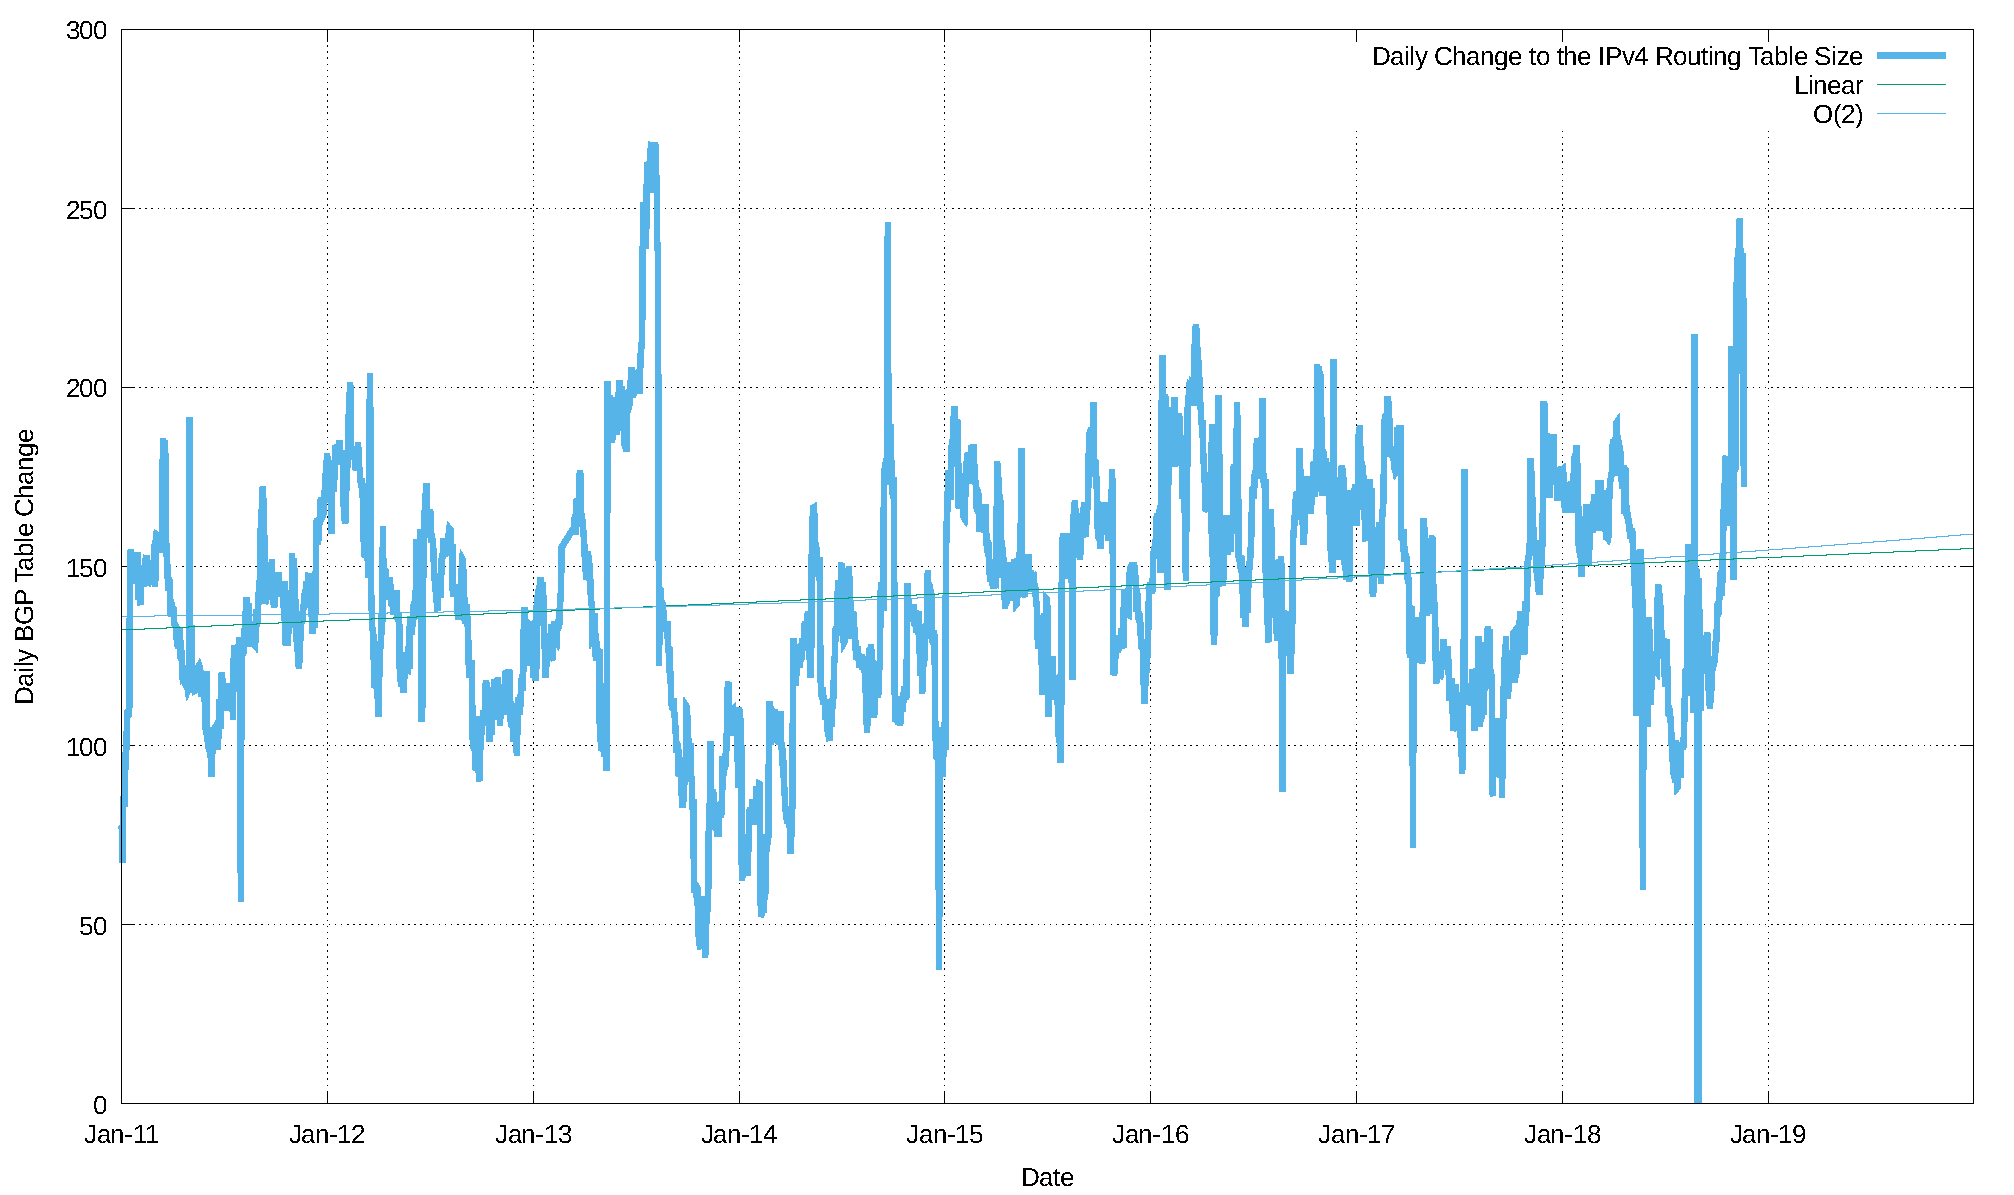
Figure 26 — First order differential of smoothed IPv4 BGP Table size (2011–2018).
With the caveat that this prediction assumes that tomorrow will be a lot like today and that the influences that shape tomorrow have already shaped today, then it’s reasonable to predict that the IPv4 routing table five years from now, at the start of 2024, will contain an additional 250,000 entries, making a total for IPv4 of some 1 million entries in the BGP IPv4 routing table at that time.
| IPv4 Table | IPv4 Prediction | |
| Jan 2014 | 488,000 | |
| Jan 2015 | 530,000 | |
| Jan 2016 | 587,000 | |
| Jan 2017 | 646,000 | |
| Jan 2018 | 699,000 | |
| Jan 2019 | 755,000 | 755,000 |
| Jan 2020 | 810,000 | |
| Jan 2021 | 864,000 | |
| Jan 2022 | 919,000 | |
| Jan 2023 | 974,000 | |
| Jan 2024 | 1,028,000 |
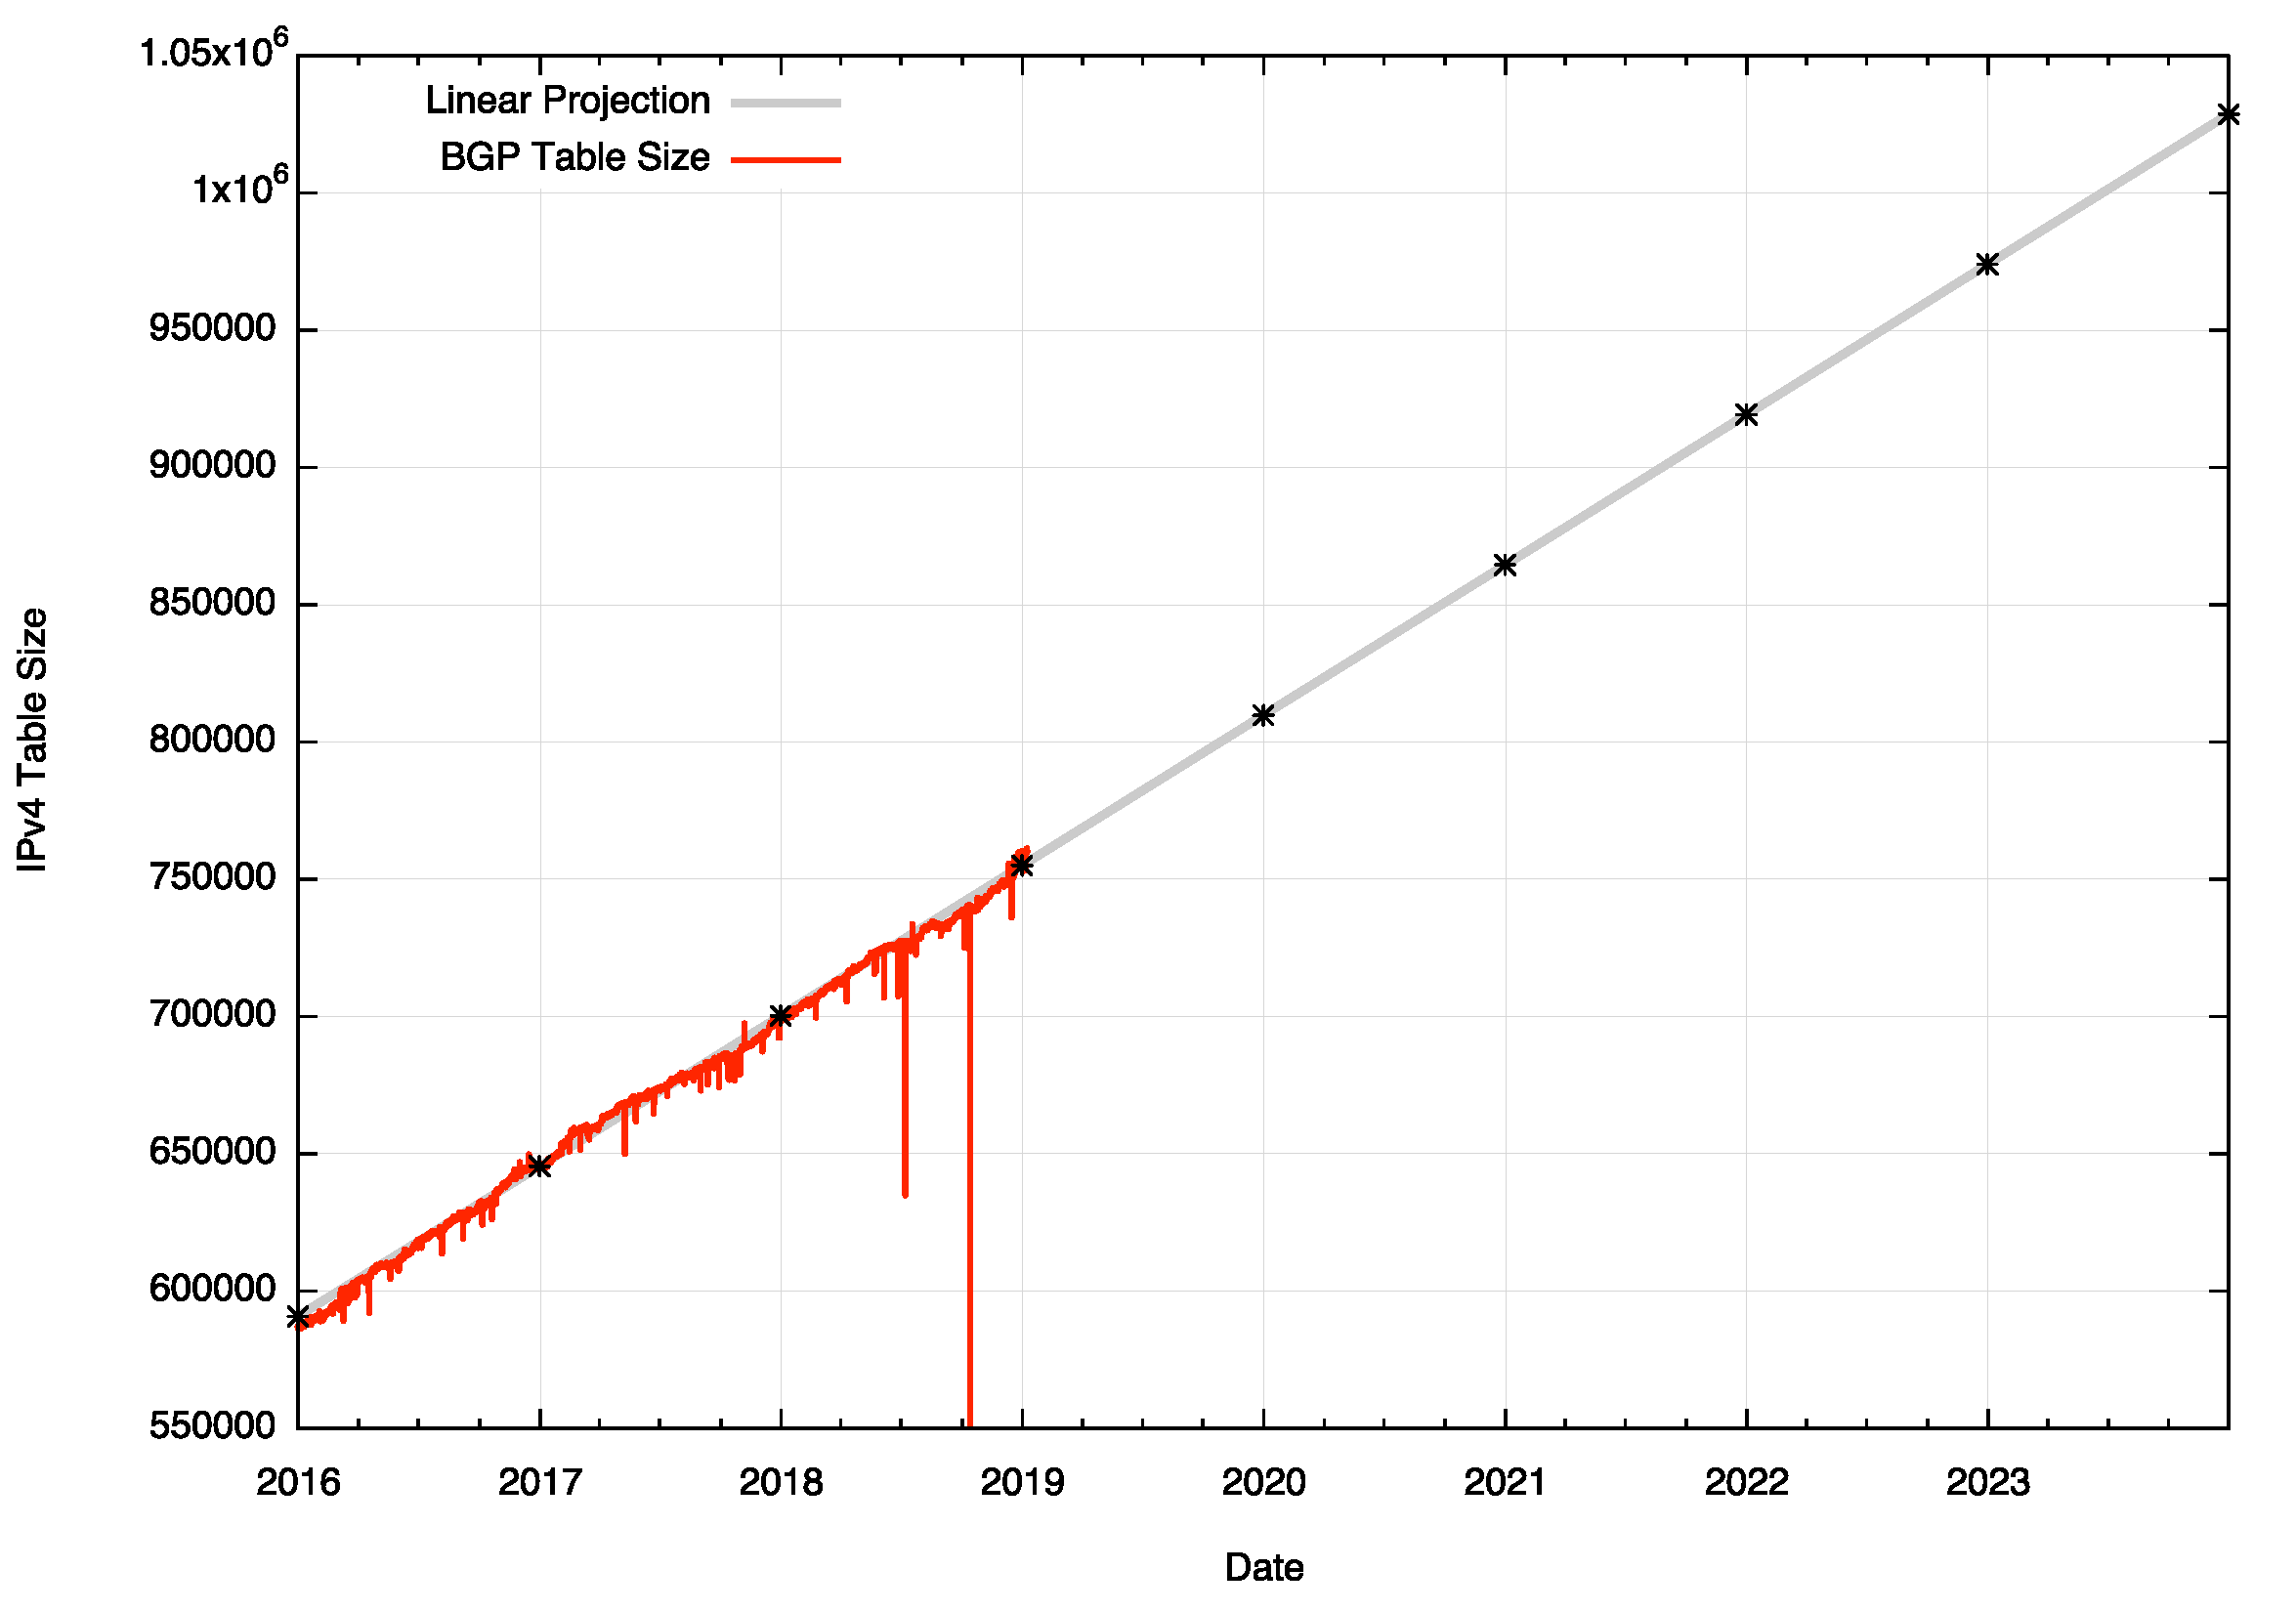
Figure 27 — Linear prediction of IPv4 Table growth.
It’s difficult to portray this prediction as reasonable under the current circumstances. Given that that last ‘normal’ year of supply of available IPv4 address to fuel continued growth in the IPv4 Internet was 2010, why has the growth of the IPv4 routing table persisted with such regularity?
It should be remembered that a dual-stack Internet is not the objective in this time of transitioning the Internet to IPv6. The ultimate objective of the entire transition process is to support an IPv6-only network.
An important part of the process is the protocol negotiation strategy used by dual-stack applications, where IPv6 is the preferred protocol wherever reasonably possible (to so-called ‘Happy Eyeballs’ behaviour). In a world of ubiquitous dual-stack deployment, applications will prefer to use IPv6, and the expectation is that in such a world the use of IPv4 would rapidly plummet.
The challenge for the past decade or more has been in attempting to predict when in time that tipping point that causes demand for IPv4 to plummet may occur. The assumption behind these predictions is that such a tipping point is at least five more years in the future. This may not be a reasonable assumption.
Forecasting the IPv6 BGP Table
The same technique can be used for the IPv6 Routing Table. Figure 39 shows the data set for BGP from January 2010 until January 2019.
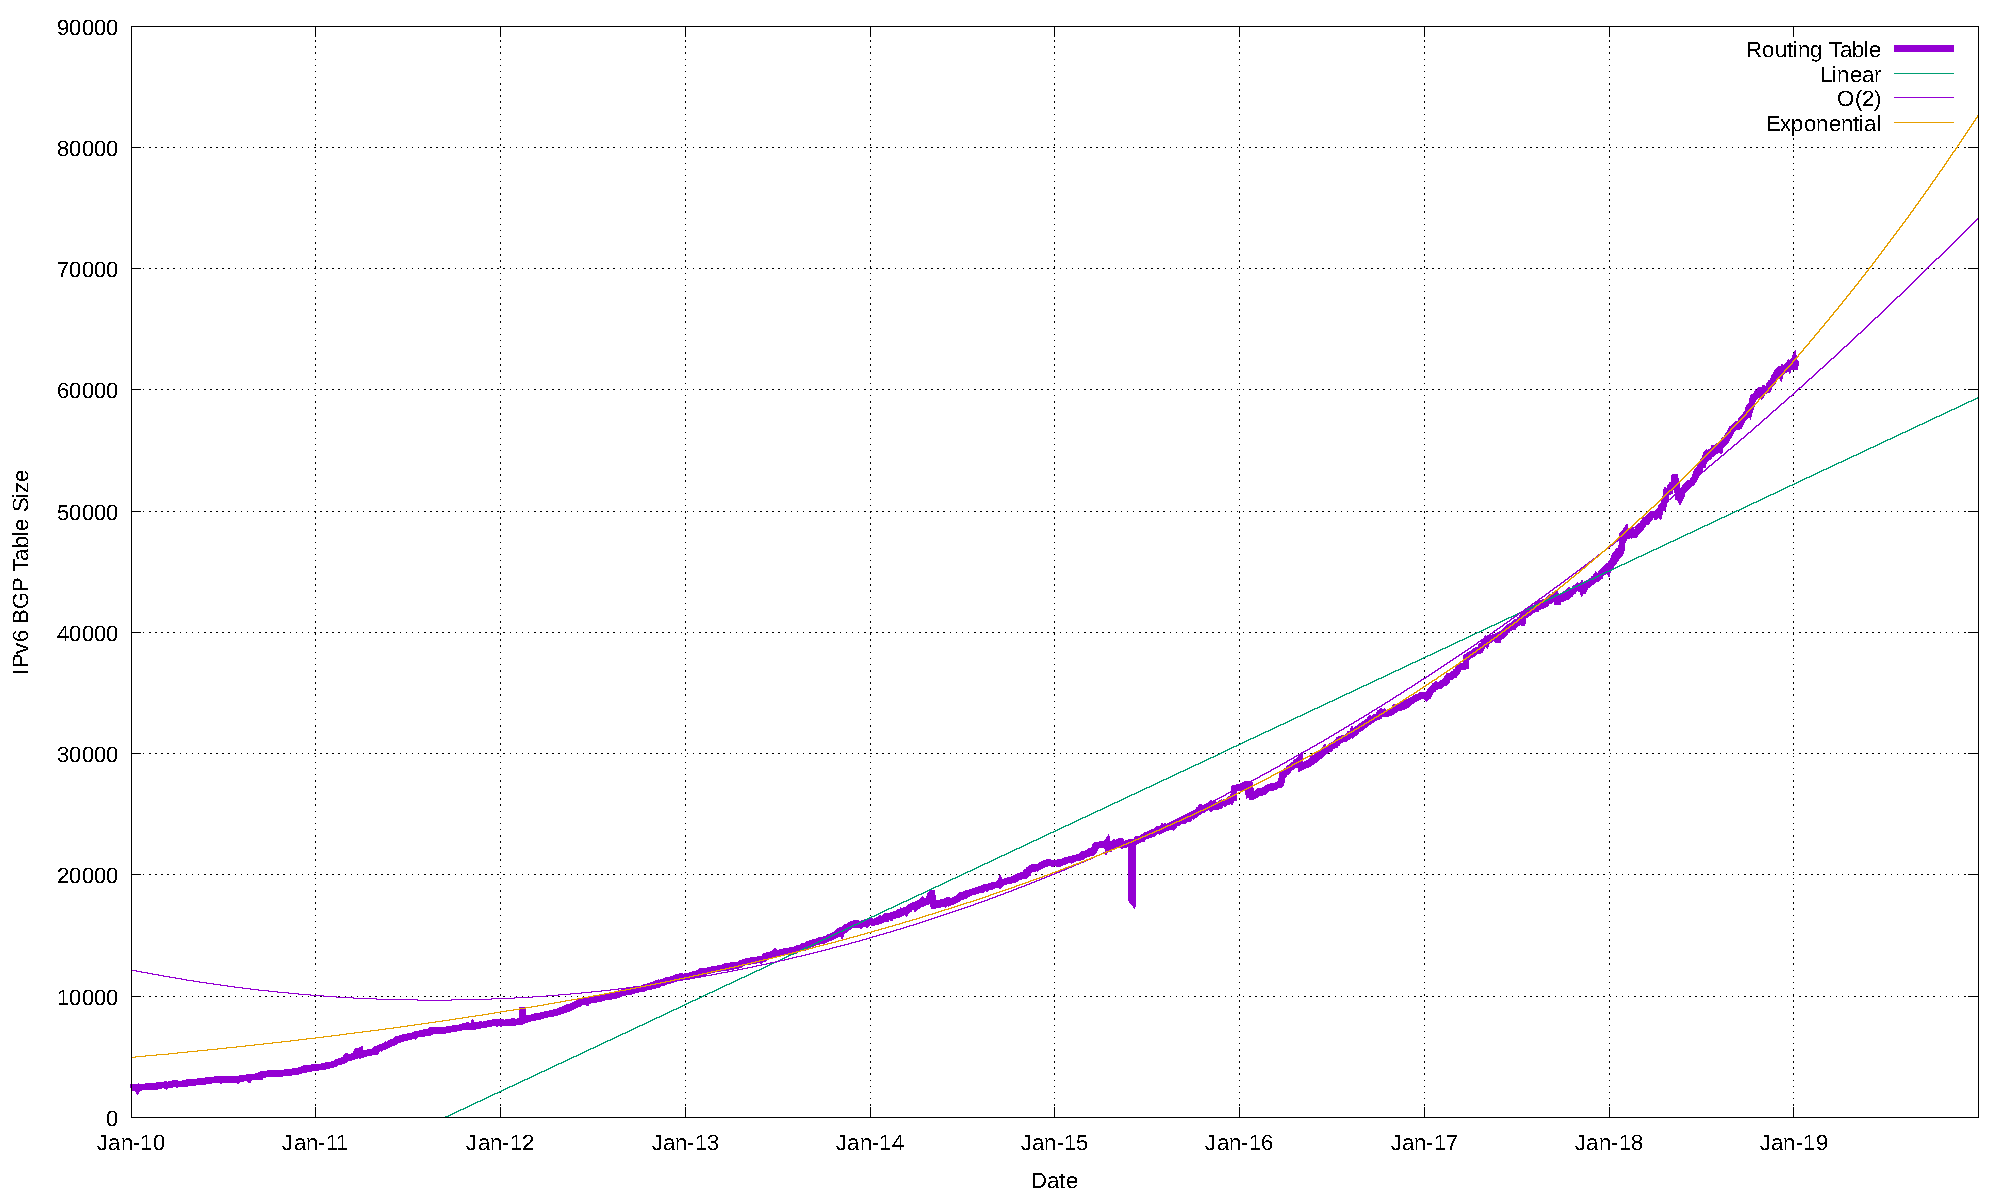
Figure 28 — IPv6 BGP Table size from January 2010.
The first order differential, or the rate of growth of the IPv6 BGP routing table, is shown in Figure 40. The number of additional routing entries has grown from 10 new entries per day at the start of 2011 to a peak of over 30 in early 2017. Obviously, this is far lower than the equivalent figure in the IPv4 domain, which is growing by some 150 new entries per day, but it does show a consistent level of increasing growth.
This implies that a linear growth model is inappropriate for modelling growth in IPv6. A better fit to the data is a compound growth model, with a doubling factor of some 24 months. It is possible to fit a linear model to the first order differential of the data, which can be used to derive an O(2) polynomial fit to the original data. The fit of a linear, O(2) polynomial and an exponential model of projected IPv6 table size is also shown in Figure 29.
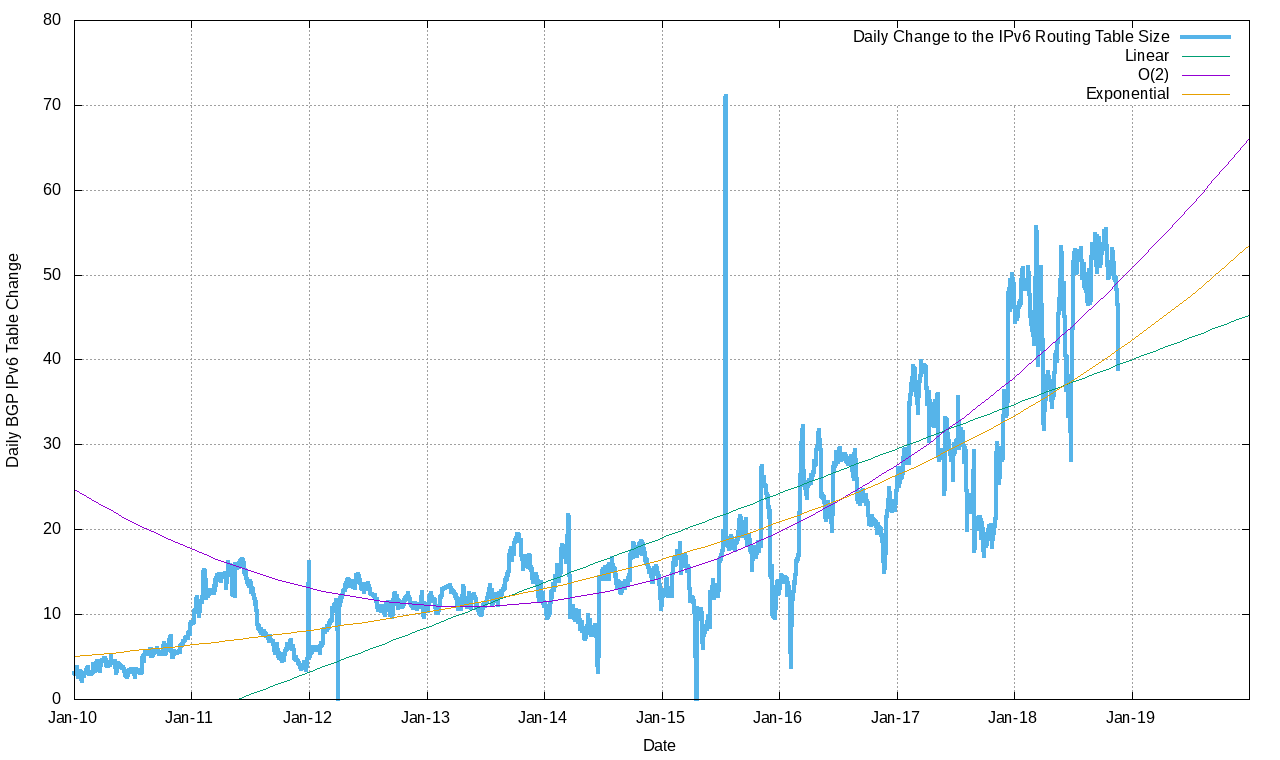
Figure 29 — First order differential of IPv6 BGP Table size.
The projections for the IPv6 table size are shown in Table 4.
| IPv6 Table | IPv6 Prediction (linear) | IPv6 Prediction (exponential) | |
| Jan 2015 | 21,000 | ||
| Jan 2016 | 27,000 | ||
| Jan 2017 | 37,000 | ||
| Jan 2018 | 45,000 | ||
| Jan 2019 | 62,000 | 62,000 | 62,000 |
| Jan 2020 | 75,000 | 83,000 | |
| Jan 2021 | 89,000 | 109,000 | |
| Jan 2022 | 102,000 | 145,000 | |
| Jan 2023 | 116,000 | 192,000 | |
| Jan 2024 | 130,000 | 255,000 |
The linear and exponential projections in Table 4 provide a reasonable estimate of the low and high bounds of the growth of the IPv6 BGP routing table in the coming years.
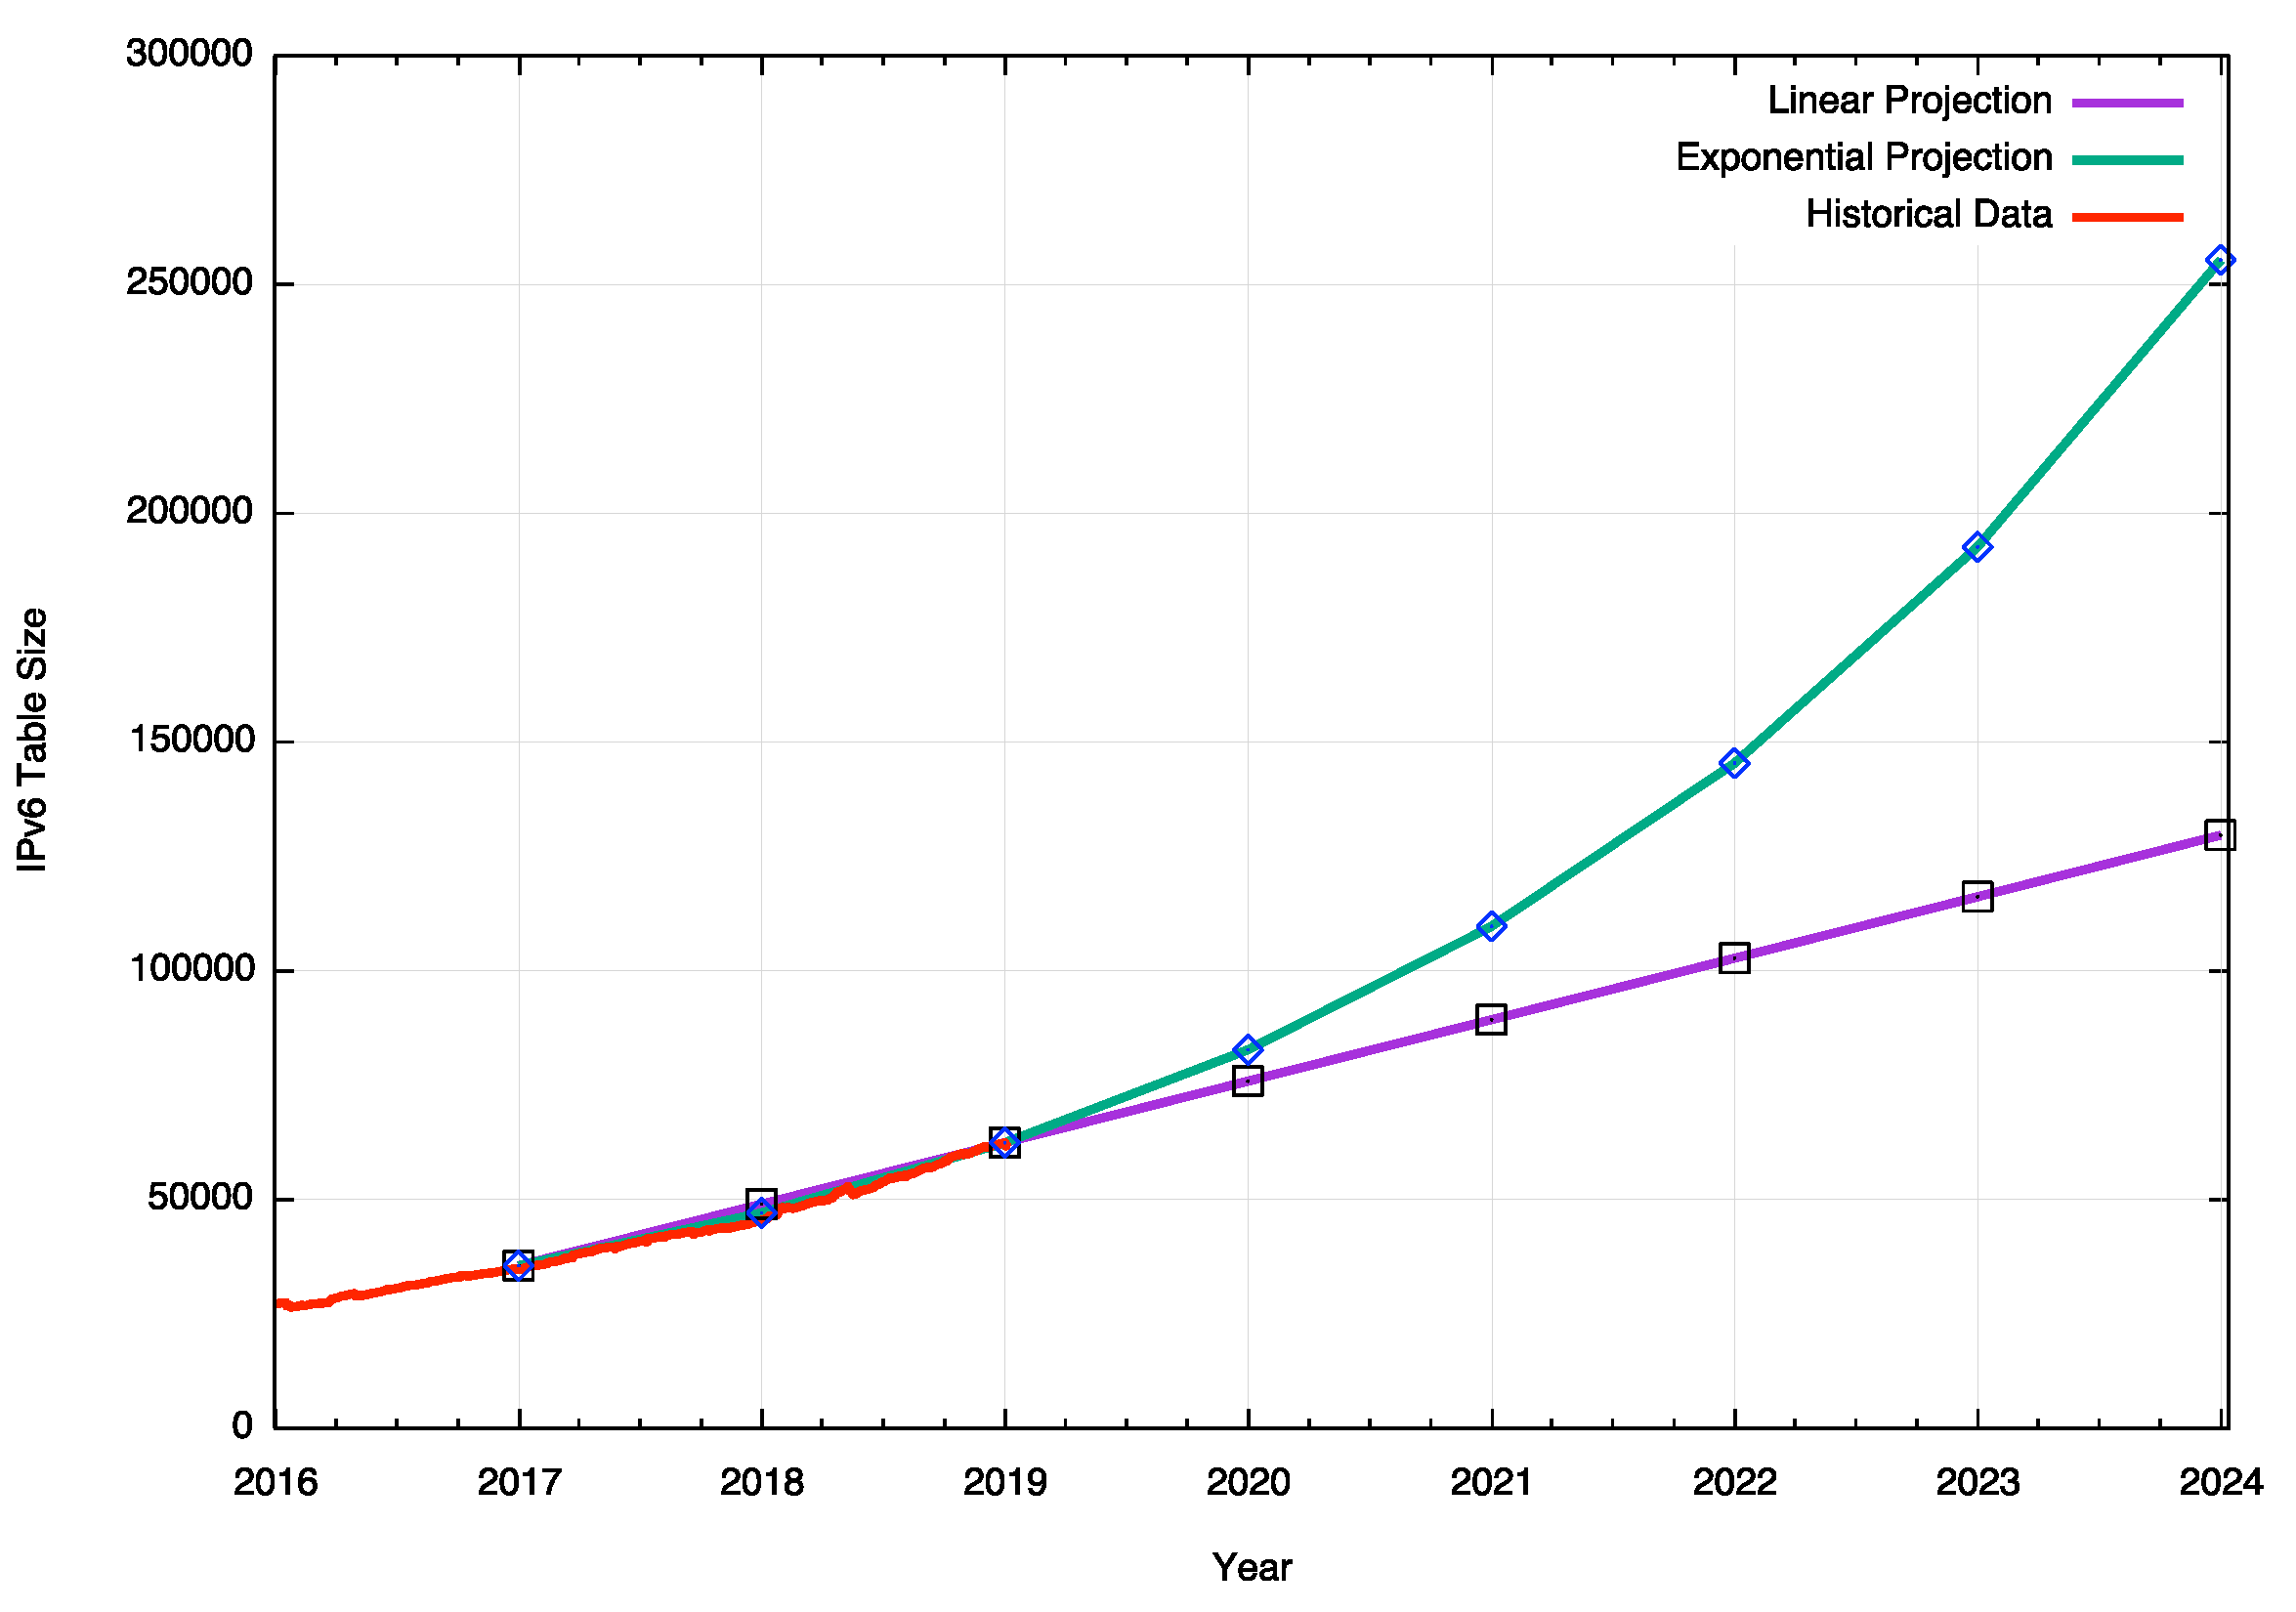
Figure 30 — Projections of IPv6 BGP Table size.
If IPv6 continues to grow exponentially over the next five years, the size of the IPv6 routing table will be approaching one-quarter of a million entries. In hardware terms, an IPv6 address prefix entry takes four times the memory of an IPv4 prefix, so the memory demands of the IPv6 routing table will be approaching that used by the IPv4 table at this time.
Conclusions
These predictions for the routing system are highly uncertain. The correlation between network deployments and routing advertisements has been disrupted by the hiatus in supply of IPv4 addresses, causing more recent deployments to make extensive use of various forms of address sharing technologies.
While a number of providers have made significant progress in public IPv6 deployments for their respective customer base, the majority of the Internet user base is still exclusively using IPv4 for the moment.
The predictions as to the future profile of the routing environment for IPv4 and IPv6 that use extrapolation from historical data can only go so far in providing a coherent picture for the near-term future.
Despite this uncertainty, nothing in this routing data indicates any serious cause for alarm in the current trends of growth in the routing system. There is no evidence of the imminent collapse of BGP.
None of the BGP metrics indicate that we are seeing such an explosive level of growth in the routing system that it will fundamentally alter the viability of the BGP routing table anytime soon.
However, size alone is not the only parameter of the Internet’s routing system. There is also the consideration of the protocol behaviour and the rate of churn of BGP messages, which I will look at in the next part of this report.
The views expressed by the authors of this blog are their own and do not necessarily reflect the views of APNIC. Please note a Code of Conduct applies to this blog.
WOW A FULL REPORT . NEED AGAIN AND AGAIN READING TO GET THE INSIDE OF THIS. VERY MUCH USEFUL FOR MY TRAINING’S . THANK YOU GEOFF HOUSTON
I have a question about the following:
“Performing a lookup into a data structure of around one million entries for an imprecise match of a 32-bit value within 5 nanoseconds represents an extremely challenging silicon design problem.”
Why are you considering a 32 bit value? As of now, prefixes are only being advertised up to /24 prefixes. Even with your projected growth I don’t see why you are considering all 32 IPv4 bits.
The IP routing architecture permits any IP prefix to be routed. In the case of IPv4 the prefix length can be any value up to 32 bits and in IPv6 it’s any prefix up to 128 bits in length.
It is a common convention at present that prefixes of 24 bits or less are generally permitted in the IPv4 public routing space. This is merely convention and could change if we all agreed to change. Even today we see smaller prefixes being routed in the Internet, and if we have to continue to inhabit a dual stack world for many years to come it likely that the current conventions will change to permit even smaller prefix sizes in the future. A prudent router vendor would assume that it needs to route any address prefix, so its lookup size is 32 bits.
The same argument applies to IPv6. The current 64-bit split between the network part and the local interface identifier party is again merely a convention and we might see a different address architecture in the future. Again, a prudent router vendor would simply permit any IPv6 prefix to be routed, hence a requirement for a 128-bit lookup space.
Thanks for your quick response!
Do you have any information about the capabilities of the current infrastructure? I’m just wondering if this 24 bit agreement is because of hardware limitations or if it is because it wasn’t considered that we’d need more. In other words would the current routing infrastructure just wipe out with a BGP Table of double the size?
This concept of planning not counting on unforeseen requirements were why Standford got a /8 block back in the day from what I understand. It just wasn’t thought that so many addresses would be used that 60 million addresses seemed reasonable for a university to have.
If you look at the prefix size table as seen by AS131072 (http://bgp.potaroo.net/as2.0/bgp-active.html) this AS sees more than 335 prefixes of size /25 through /31. The /24 convention dates back to ISP route filtering policies in the mid-90’s (of which the most publicised at the time was Sprint’s). The concern was that the routing table would grow beyond the capabilities of routing hardware in terms of the size of the table. The routing infrastructure itself is perfectly capable of carrying prefixes of any size.
Your comment about address allocation policies in the early days of the Internet is not one I can agree with. At the time we were using class-based addressing and the computer infrastructure (mainframes and so-called mini-computers) in many campuses were just too big for a class B (even then!) . So the NIC allocated them a class A.
It should also be remembered that at the time we thought the Internet was merely an experiment in packet switching and when the world turned its attention to a comprehensive global digital infrastructure we would be using a different protocol. Much hope was placed in OSI back then (late 80’s). I think anyone in 1985 claiming that the entire world would run Unix and IP would have been dismissed as a raving zealot! 🙂
Re: “The concern was that the routing table would grow beyond the capabilities of routing hardware in terms of the size of the table. ”
So I’m understanding that there are a significant enough amount of devices that wouldn’t be able to do route lookups in a reasonable amount of time for a table that was of a certain size. And the table size is suspected to increase if the granularity gets higher. This reminds me of what you spoke about at Netnod in 2017 regarding MTUs with IPv6. Of course it’s a different type of problem, but the underlying concept is there is a hardware bottleneck in the network infrastructure.
I’m afraid I didn’t understand your point about the universities needing class A. Wouldn’t they have 65,536 addresses as a class B. Was that seriously not enough addresses for a university campus to get them through until ’93 when classless came around? That seems low now, but if you asked me, I would have said that was more than enough back in the day.
Good foresight would in most circumstances be dismissed as the behavior of a raving zealot! 🙂
Hi Geoff,
Thank you for sharing your work. I wonder what are the different labels (colors) in Figure 1. Thank you.
I have taken a sequence of BGP dumps from the Route Views archive and re-created a stream of data from each Route-Views BGP peer, and plotted the number of objects advertised by each peer over time. Each plot has a different colour.
Thank you for your response. What RouteViews collector you use for Figure 1? Also, when you refer to a RouteViews BGP peer, do you mean a real router sharing its data with that collector?
Thank you.
I use the route views archive (http://archive.routeviews.org) and analyse the snapshot data there to generate this figure.