

Recently we found ourselves wondering: How many of our website’s visitors are capable of using IPv6 traffic?
Of course, there are a number of places out there where you can see global IPv6 adoption rates and other IPv6 statistics, but we wanted to see what the traffic looked like out in the wild on our own site. Here are some questions we wanted to answer:
- Is most IPv6 traffic on mobile or desktop?
- What brands of mobile devices are most likely to use IPv6?
- Which economies are bringing the most IPv6 traffic?
- Are there any noticeable behavioural differences between IPv4 and IPv6 traffic?
Enter Javascript
To answer these questions, we created a simple script, which sends a GET request to a domain with an AAAA record (IPv6 address only) to see if the client supports IPv6 traffic. If the request fails, it sends another request to an IPv4 domain so the server can record how many clients do and don’t support IPv6 traffic. We created a small GUI to report the results.
We’re putting the code online with instructions for implementing this on your own site.
There’s also a separate GUI for showing the results.
We also send an event to our Google Analytics account so that we can segment our Analytics reports based on whether the traffic was or was not IPv6 capable. This lets us answer some of the more interesting questions mentioned above.
The setup for this is simple — for each pageview we send a Google Analytics event labelled either IPv4 or IPv6. We then create custom segments matching those labels so that for any report in Google Analytics we can divide the traffic based on the user’s IPv6 capability.
Initial results
Here are our results:
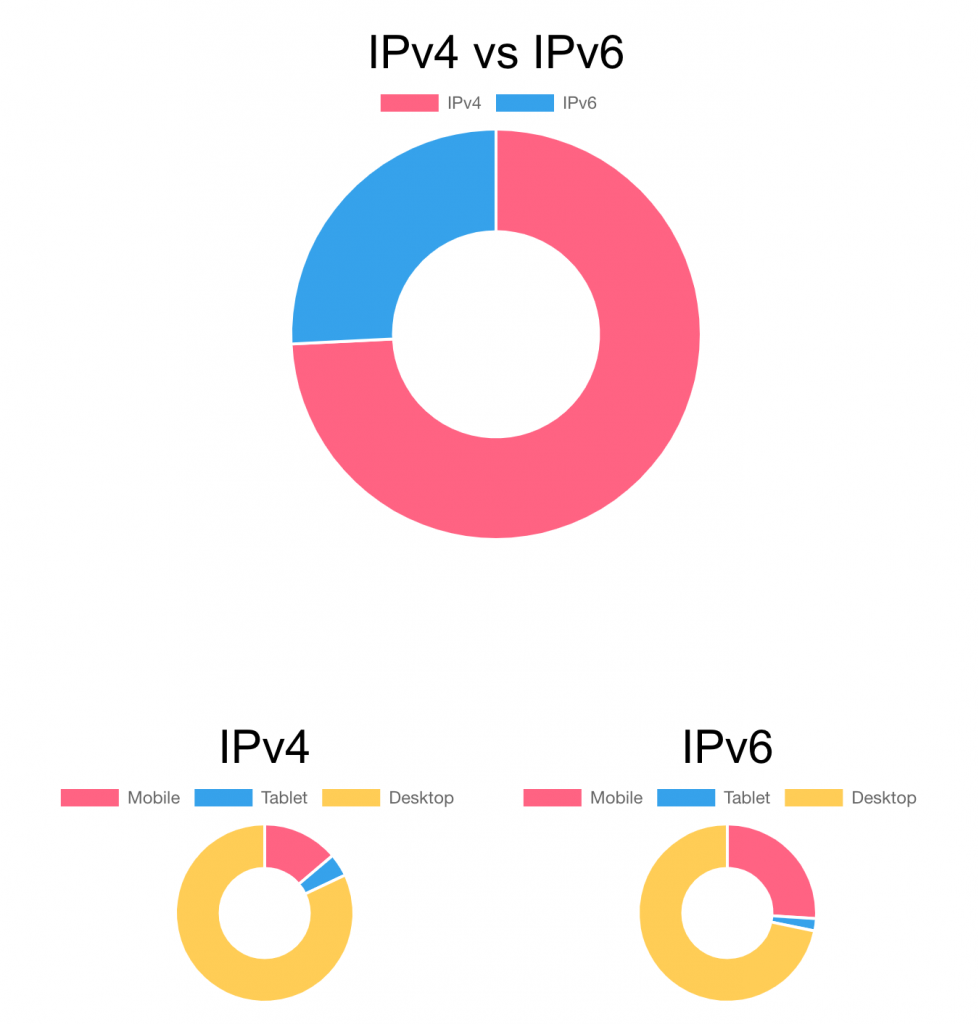
Figure 1 — Comparison of IPv4 vs IPv6 traffic to 6connect.com.
Interestingly, the ratio of IPv6 to IPv4 traffic on our site is nearly identical to the global adoption rate of just over 25%. Substantially more of the IPv6 traffic is on mobile devices, compared to IPv4.
IPv4 vs IPv6: Most common device brands
Looking at Google Analytics we see some differences in most common device brands between IPv4 and IPv6 traffic. In particular, Samsung has a larger percentage of IPv6 traffic than it does IPv4.
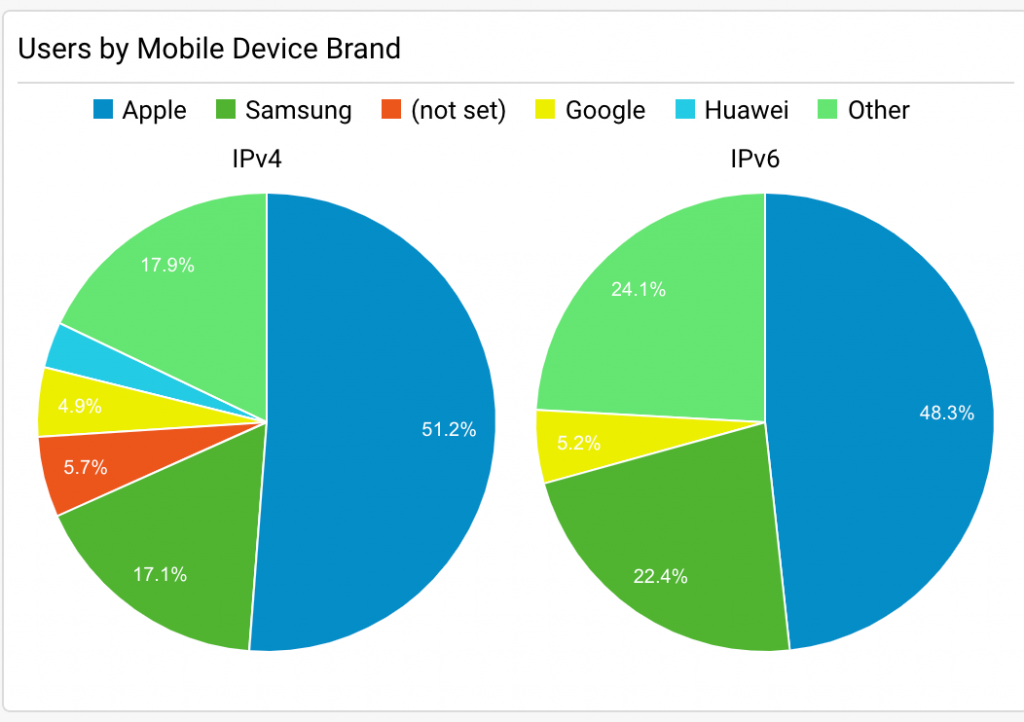
Figure 2 — Users by mobile device brand.
IPv4 vs IPv6: Most common web browsers
IPv6 traffic appears to come from a broader range of browsers than IPv4, which is completely dominated by traffic from Google Chrome.
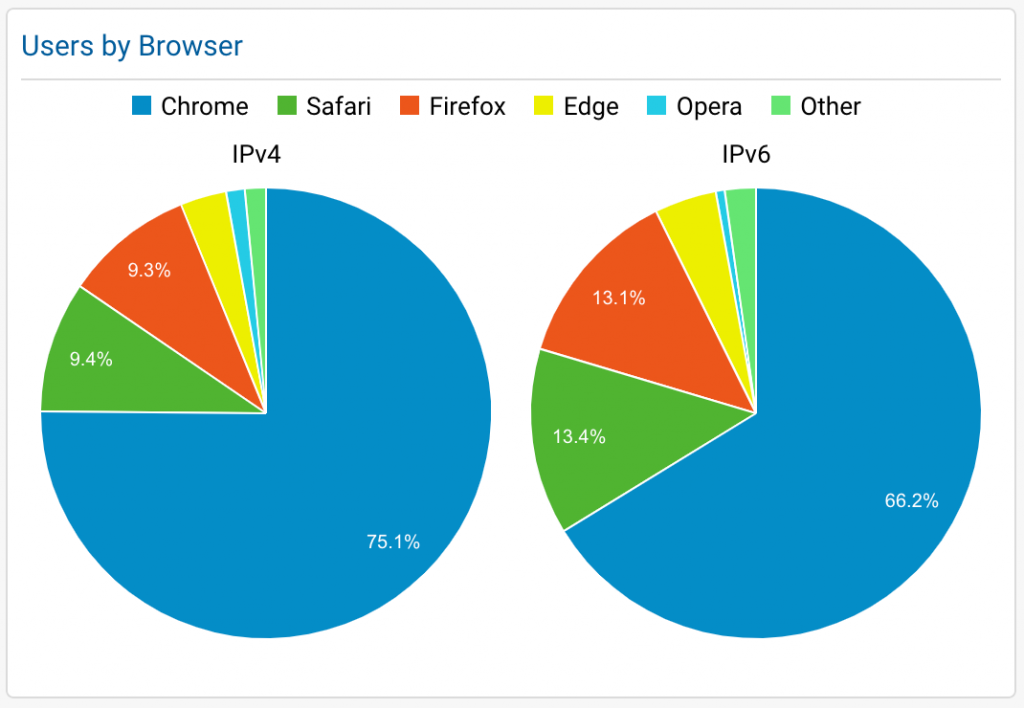
Figure 3 — Users by browser.
IPv4 vs IPv6: Most common economies
We also looked at economies for both IPv4 and IPv6 traffic and noticed that the United States has a larger share of IPv6 traffic. This matches our expectations based on global adoption.
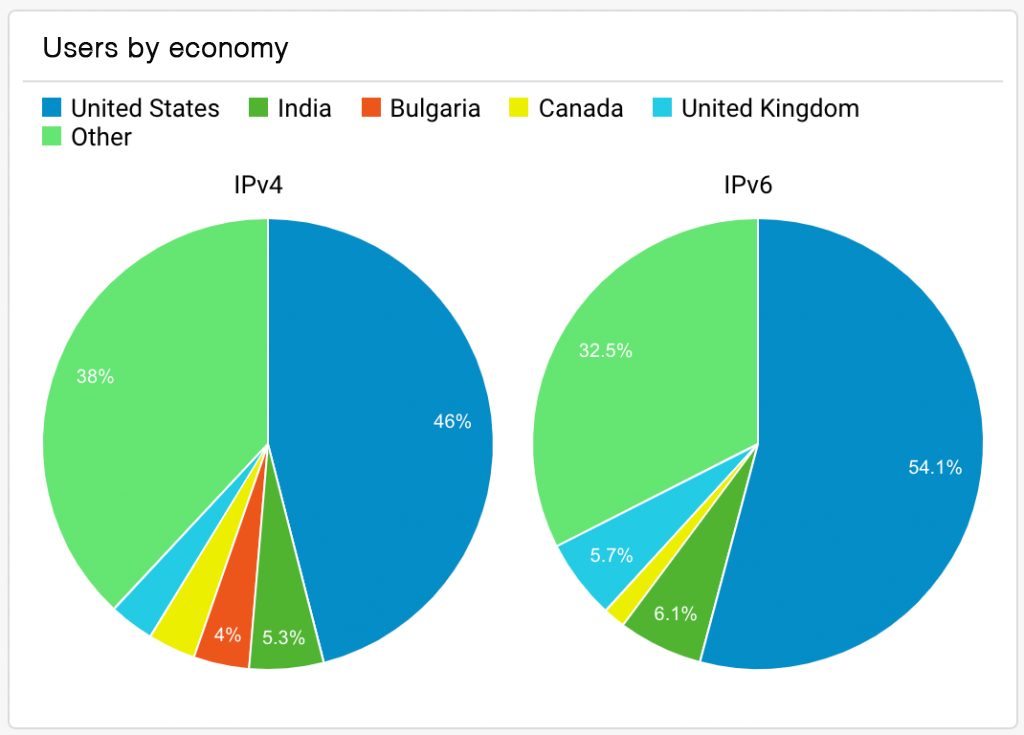
Figure 4 — Users by economy.
Spotting bots
We also noticed a spike in IPv4 traffic that did not have a corresponding spike of IPv6 traffic (see below).
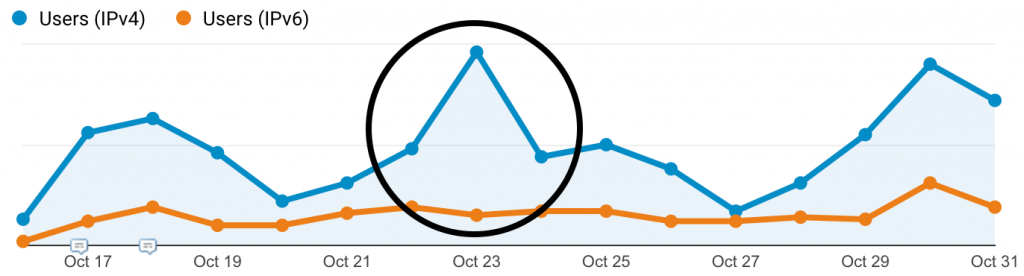
Figure 5 — A spike in IPv4 traffic.
We would expect organic spikes in traffic to affect IPv6 and IPv4 traffic similarly, but all of this traffic was over IPv4. After digging in a bit more we realized that this spike of traffic came from a network of bots. It gave itself away in part because none of the traffic was IPv6 capable.
What’s next
It’s been fun setting this up and measuring the results on our own site. Are there any other questions that come to mind? What else could we measure using this approach?
Take a look at the code and let us know in the comment section below if you have any questions or ideas.
Adapted from original post which appeared on the 6connect Blog
Pete Sclafani is COO and co-founder of 6connect.
The views expressed by the authors of this blog are their own and do not necessarily reflect the views of APNIC. Please note a Code of Conduct applies to this blog.
Thanks
Thanks for sharing Very Use ful Blog..