

Uninterrupted availability of the Internet has become increasingly critical these days, not just for end users but also for service providers who need to meet Service Level Agreements (SLAs). Yet, outages affecting end-user connectivity are widespread, whether they be unintentional fibre cuts, natural disasters, cyber attacks, or intended Internet shutdowns by governments for political reasons.
Such large-scale outages are relatively easy to detect and are often reported on various news sites and social media. More difficult to detect are the local, small-scale, more scattered outages (such as those caused by a power failure affecting a small neighbourhood).
These outages are typically not visible when studying the Internet’s control plane (the routing information exchanged between networks). Thus, detecting these potentially small events is similar to finding a needle in a haystack: only broad measurements in time and topological scope can find them.
In our new paper, Advancing the Art of Internet Edge Outage Detection (IMC 2018), my colleagues at MIT, University of Maryland, Akamai and I present a new approach to passively detect Internet edge outages: by leveraging access logs of a major Content Distribution Network (CDN) and tracking anomalies in the access patterns of end users.
The never-sleeping Internet: baseline activity
During our study, we analysed logs collected from a major CDN with more than 200,000 servers in 130 countries and 1,700 networks, serving trillions of requests from users around the globe on a daily basis.
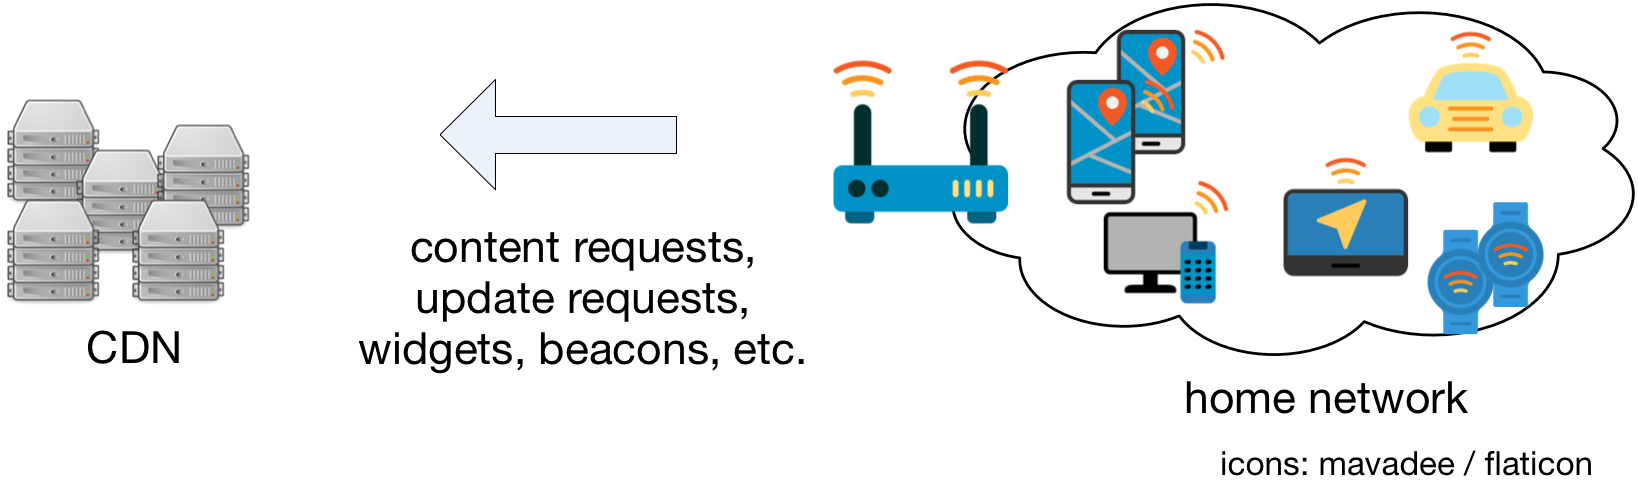
Figure 1 — The logs collected for the study contained hourly counts of requests to the CDN from individual IPv4 /24 address blocks.
Interestingly, for many address blocks, we saw requests to the CDN every single hour over long time periods — 24/7 activity. The figure below shows such an example, where we never saw fewer than 130 active IPv4 addresses in the /24 prefix in any hour during this month.
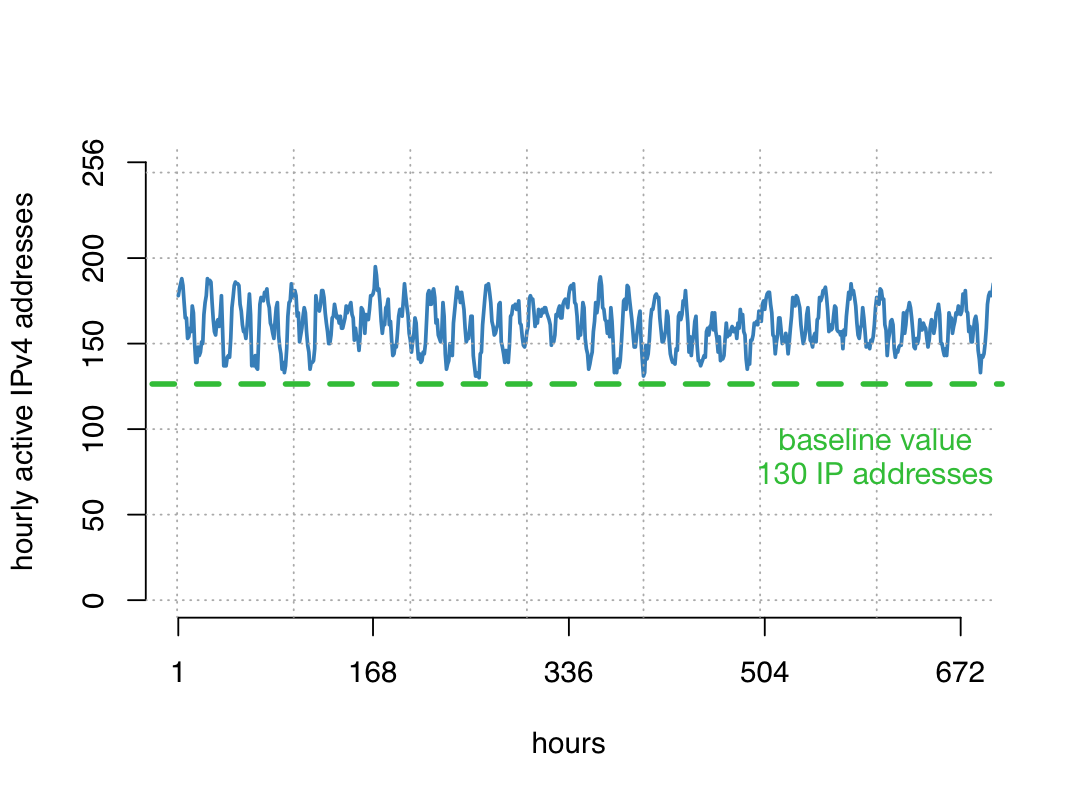
Figure 2 — Graph showing the number of hourly active IPv4 addresses for a sample /24 address block over the course of a month. An active IPv4 address here means that it contacted the CDN at least once in that hour.
Upon inspecting some of the requests, we found that — besides a huge number of user-triggered requests for content (for example, web and video content) — there was a sizeable number of requests that are not human-triggered.
While surprising at first, this can be explained by the increasing number of always-on devices in our homes: smartphone or Smart TV apps and widgets periodically update information (weather, stock market, calendar) and a variety of software installations issue frequent update requests. Thus, having a number of devices connected to your WiFi will cause the steady request pattern in the CDN logs. We term this observation baseline activity.
Detecting disruptions
Baseline activity is an ideal signal for outage detection: it is (i) largely independent of human-triggered activity, but is (ii) dependent on a functioning network.
We next developed a technique that detects disruptions in baseline activity on an hourly basis, instances where the constant CDN contact from devices from address blocks is temporarily absent or significantly reduced. We can only detect disruptions that last at least one hour.
We used a sliding window to calculate a baseline value for each block and hour, and detect significant disruptions (dips) from this activity. This technique allows us to track millions of address blocks in more than 12.5K networks around the globe. We refer to our paper for more details on the detection technique, how we calibrated it for robustness, and our global coverage.
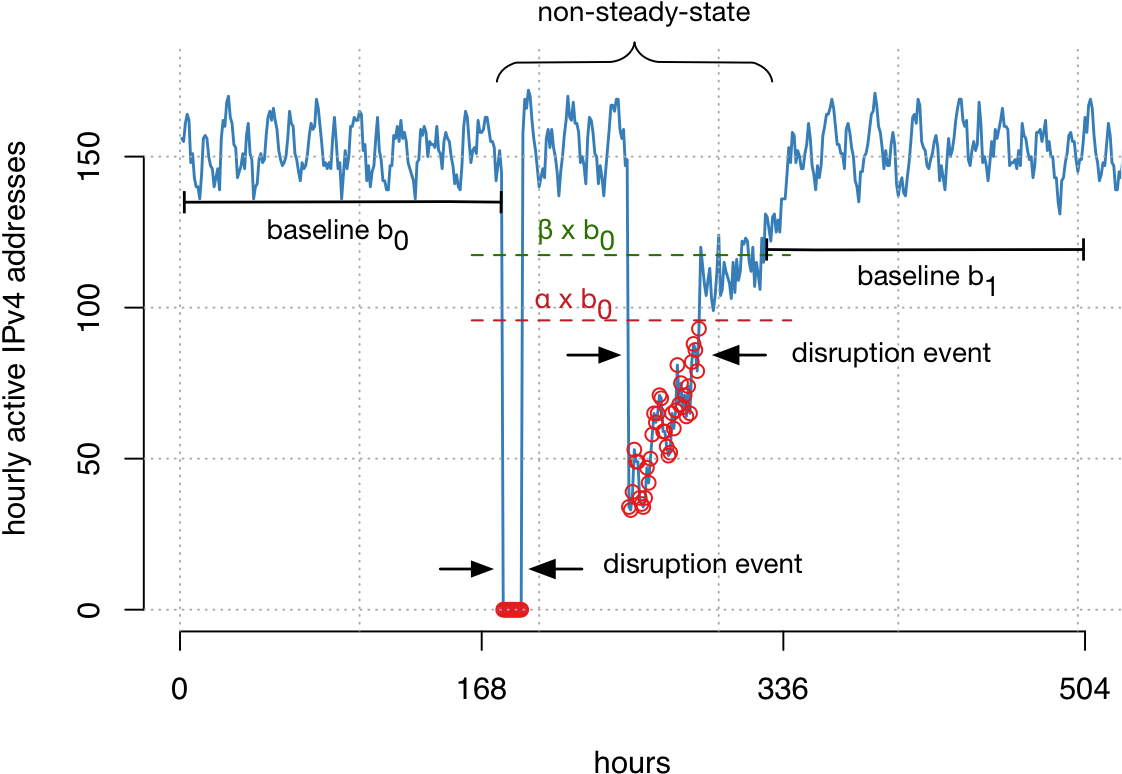
Figure 3 — A sliding window was used to detect significant disruptions (or dips) in activity across more than 12,000 networks.
We ran our disruption detection mechanism over CDN logs that spanned one entire year (Figure 4) from which we were able to make a number of interesting observations.
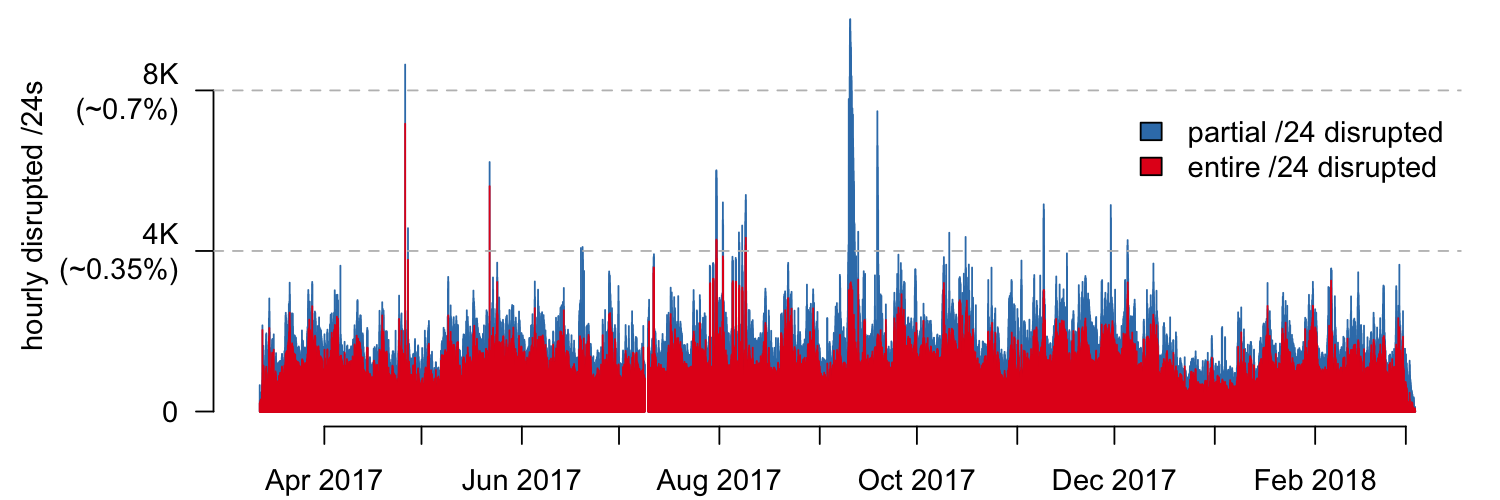
Figure 4 — Partial and entirely disrupted /24 address blocks from more than 10,000 networks detected hourly from March 2017 to March 2018.
Micro-disruptions
Globally, there are always disruptions and edge outages. About 0.2% of the monitored address space is disrupted in any given hour! Many of these disruptions are small in scale, affecting end users in specific ISPs or geographic regions. They can be caused by a variety of factors ranging from fibre cuts and power outages, to failures in individual ISP networks.
Major external events
Major external events, most notably Hurricane Irma in September 2017, often cause large-scale Internet outages in multiple providers. Such events and their representation in our dataset allow for assessing the reliability and resilience of Internet access in the face of natural disasters. But outages due to natural disasters are only the tip of the iceberg of what we found; we also observed large-scale outages in individual networks, which can be caused by major misconfigurations, Denial of Service attacks, or even be the result of intended Internet shutdowns for political reasons.
Scheduled maintenance
Another intriguing pattern was a weekly recurring ‘jump’ in detected disruptions, excluding the week between Christmas and New Year’s Eve.
We located the physical location and local time of disruptions and found that disruptions are more likely to occur on Tuesdays, Wednesdays, and Thursdays shortly after midnight. These times correspond precisely with the scheduled maintenance interval of major ISPs.
We found that for many ISPs, the majority of all disruptions start and end within their advertised maintenance interval. This is an important observation when it comes to pinpointing Internet edge outages to actual reasons. A service outage during scheduled maintenance can have different significance with respect to SLAs and regulatory reporting, as compared with outages caused by unplanned events, such as natural disasters.
We refer to our paper for a more detailed study of network and timing aspects of the identified disruptions.
Scheduled maintenance more likely cause of disruptions than natural disasters
To illustrate the effect that just a single natural disaster — Hurricane Irma — and scheduled maintenance have on the overall number of detected disruptions, we selected the seven largest ISPs offering broadband Internet in the United States. Of all /24 address blocks belonging to these ISPs, we wanted to know how many were only disrupted during Hurricane Irma or during scheduled maintenance windows (Monday to Friday, midnight to 06:00).
| ISP A (Cable) | ISP B (Cable) | ISP C (Cable) | ISP D (DSL) | ISP E (DSL) | ISP F (DSL) | ISP G (DSL) | |
| % /24s only disrupted maintenance window | 67% | 54% | 75% | 29% | 60% | 71% | 62% |
| % /24s only disrupted during Hurricane Irma | 11% | 1% | 2% | 23% | 1% | 0% | 3% |
For all but one of the ISPs, most disrupted address blocks (up to 75%!) were only affected during the scheduled maintenance window. This observation has important ramifications when it comes to identifying root causes of outages and their eventual impact for SLAs and policymaking.
Further, two of the ISPs were severely affected by Hurricane Irma. Looking at ISP A, we can — just by leveraging timing of disruption events — provide likely explanations for almost 80% of all disrupted address blocks!
Looking ahead
With our detection mechanism in hand, we plan to further explore the root causes of disruptions and Internet outages, if and to what extent they correlate with external events (power outages, weather, disasters and censorship), how many users they affected, and what their recovery time is. Stay tuned!
Philipp Richter is a postdoctoral researcher at the Massachusetts Institute of Technology. His current research centers around developing data-driven methods to assess Internet reliability and security.
The views expressed by the authors of this blog are their own and do not necessarily reflect the views of APNIC. Please note a Code of Conduct applies to this blog.