

As available IPv4 address space becomes scarce, ISPs extract more use from their address space by having customers share the same address.
Addresses can be shared simultaneously in several scenarios. ISPs can deploy Carrier Grade NATs (CGNs), which multiplex many customers over the same address (or set of addresses). Universities and enterprises can use proxies that share an address among many users. When many users use the same public hotspot, they could be sharing an address.
Address sharing presents challenges to applications that use IP addresses as their unit of measurement. For example, at the University of Maryland (UMD), we have built a system that remotely detects outages affecting IP addresses; knowledge of how addresses are shared can provide additional context to detected outages. Host reputation systems that score IP addresses based upon the risk of malicious activity from addresses, such as BRBL and Dshield, would also benefit from knowing how addresses are shared.
For these reasons, we developed a project to identify IPv4 addresses shared simultaneously by many users — we call such addresses ‘gateway’ addresses— and understand the nature of the shared address, that is if they are being used as a company/campus proxy, a CGN, or public hotspot.
Measuring 700 million loglines, 69 million unique IP addresses in a month
To perform this analysis, we used logs recorded from a large CDN’s deployed download manager installations. The download manager, installed on users’ desktops and laptop machines, records loglines containing the timestamp, the globally unique identifier (GUID) of the download manager installation on the machine, and the public IPv4 address seen by the CDN’s recording infrastructure at the time. Since GUIDs are unique per user device, we investigated gateway addresses by analysing addresses that are used by many different GUIDs over a short period of time.
We reported on our analysis of 700 million loglines containing 18 million distinct GUIDs and 69 million unique IP addresses for January 2016.
We began our investigation of gateway addresses by analysing how the loglines were distributed across each hour in the month. If there were specific hours which saw many loglines, those hours may yield more gateway addresses. Figure 1 shows the distribution of loglines and unique GUIDs observed in each hour. While there do not appear to be any hours with an exceptional number of loglines, there are hours with exceptionally few loglines. On enquiry, we found that the logs can sometimes miss data. However, ignoring these hours with missing data, diurnal patterns are evident. Most requests are between 13:00 to 20:00 (UTC), which corresponds to 8:00 to 15:00 (UTC -5) (American Eastern Standard Time) and 00:00 to 7:00 (UTC +11) (Australian Eastern Standard Time), suggesting that the download manager is biased towards Western Europe and the Americas.
Figure 1 also shows decreased activity during weekends compared to weekdays. New Year’s day in 2016 was a Friday; the figure shows that the long weekend has lower download manager traffic. Subsequently, traffic increased during the weekdays and decreased over the weekends.
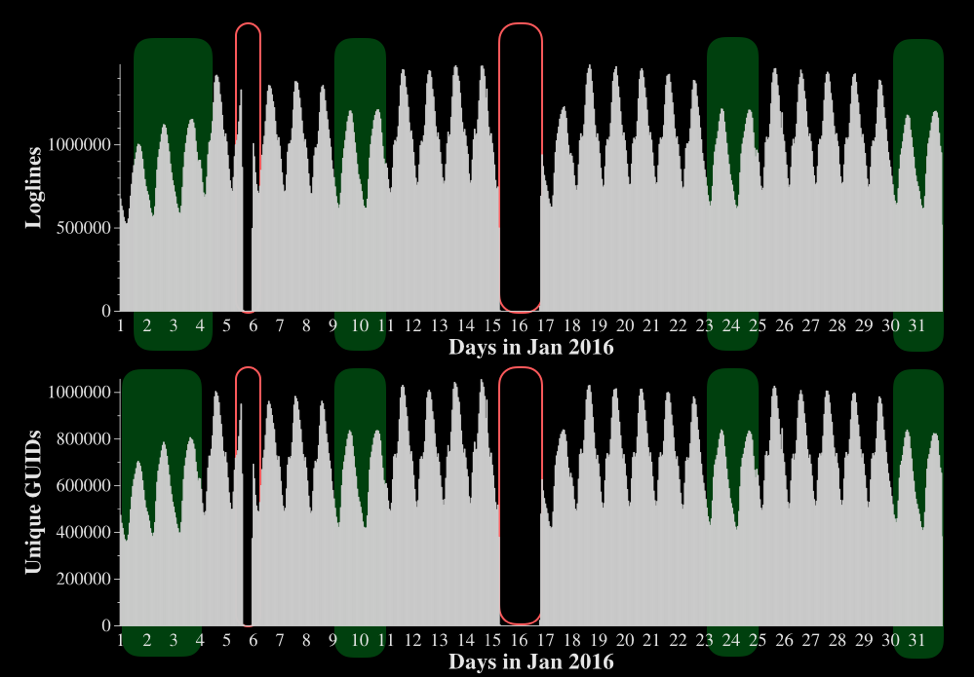
Figure 1: Number of loglines (top) and unique GUIDs (bottom) seen in each hour of Jan 2016. Weekends are highlighted in green. Red areas indicate periods without any data.
Finding IP addresses associated with GUIDs
After characterizing the download manager dataset, our next step in the investigation of gateway addresses was to find IP addresses that were associated with many GUIDs over a short period.
For each day in January 2016, for each address seen on that day, we first found the number of unique GUIDs associated with that address: we call this count of GUIDs the daily-unique-GUID-count per address. At the end of this step, each address seen in the logs in January 2016 has at least one daily-unique-GUID-count. However, addresses that had been seen in the logs on multiple days have multiple daily-unique-GUID-counts; we found the maximum of these values for each address. By finding the maximum, we ensured that addresses that had only occasionally been associated with many GUIDs would be identified as potential gateways.
The complementary cumulative distribution function (CCDF) of this maximum count in Figure 2 shows the presence of gateway addresses in the dataset:
- 3 addresses were associated with more than 4,000 GUIDs on some days
- 1,236 addresses were associated with more than 100 unique GUIDs on at least one day
- 56,019 addresses were associated with more than 10 unique GUIDs
For this preliminary analysis, we hypothesized that these 56,019 addresses are potential gateways and analysed them further.
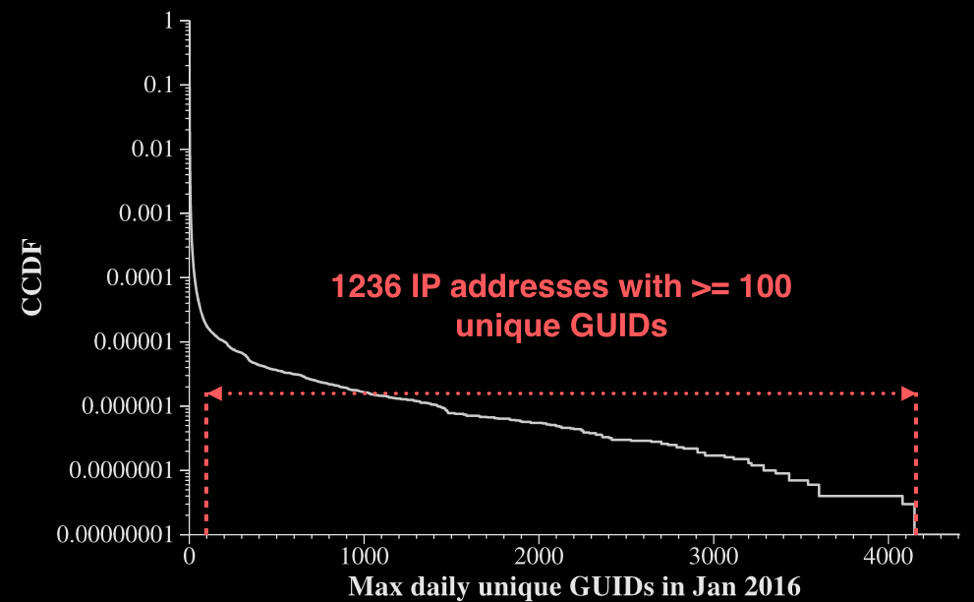
Figure 2: CCDF of MAX (daily-unique-GUID-count) per address for the 69 million addresses seen in Jan 2016.
Characterizing gateway addresses from enterprise, university, and cellular networks
Next, we investigated which Autonomous Systems (ASes) gateway addresses were from, and found that gateway addresses belong to different kinds of ASes — enterprise, university, cellular, and other large providers.
Some of these gateway addresses were easy to classify. For example, 129.2.180.46 belongs to AS 27 (University of Maryland) and its PTR record is 129-2-180-46.wireless.umd.edu., indicating that it is likely being used as the proxy address for UMD’s wireless network. Private communication with UMD’s IT department confirmed that this address is indeed a wireless NAT address.
However, other addresses belong to large multipurpose ISPs such as KDDI or Comcast. The AS and PTR records do not typically contain enough information to identify these gateway addresses’ categories. We, therefore, turned to the traffic patterns in the download manager logs observed from these addresses and looked for potential features that could aid in classifying detected gateway addresses.
To investigate the potential for classification, we identified two ASes of each type (enterprise, university, cellular) and studied their traffic patterns in the logs. We used the union of all unique GUIDs seen across all gateway addresses belonging to an AS as our metric for traffic patterns – it is possible that an AS uses a set of addresses for address-sharing purposes. We plotted the size of the union for each hour of January 2016 for two enterprises ASes in Figure 3, two university ASes in Figure 4, and two cellular ASes in Figure 5.
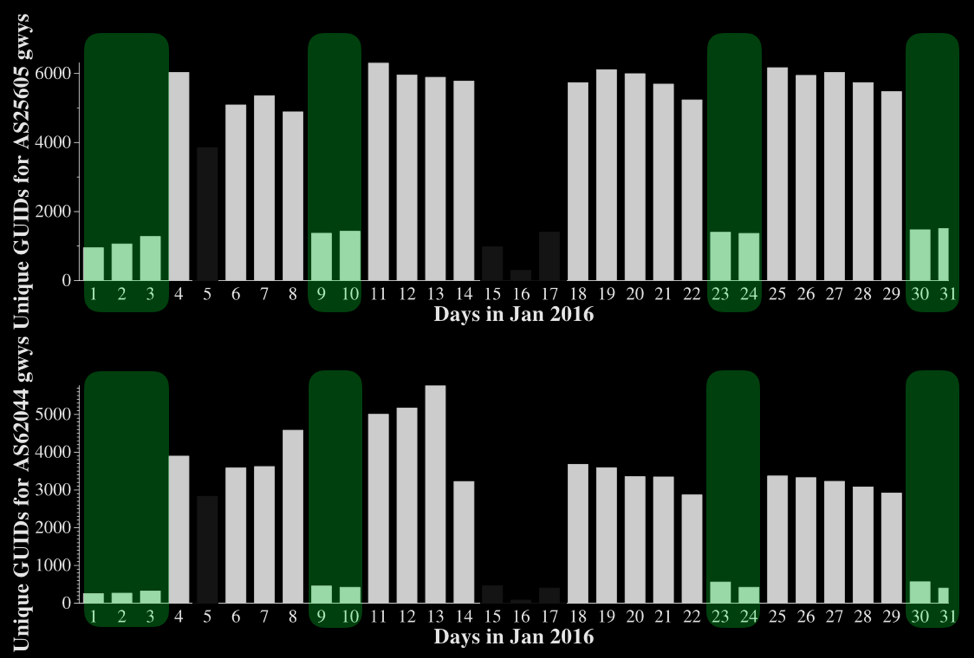
Figure 3: Unique GUIDs observed per day by all identified gateway addresses belonging to two enterprise networks. The top plot shows AS25605 (ScanSafe Services, U.S.) and the bottom plot shows AS62044 (Zscaler, Switzerland). Weekends are highlighted in green. Dark areas indicate days with missing data.
Enterprise gateway addresses are typically associated with substantially higher unique GUIDs on weekdays compared to weekends, as seen in Figure 3. Corresponding to the New Year’s long weekend in 2016, we see three days with lower unique GUIDs for both networks.
Figure 4 shows that university gateway addresses also saw higher unique GUIDs on weekdays compared to weekends. For AS27, we saw that the number of GUIDs remained low until Jan 25 and then traffic increases; this period of low activity corresponds to UMD’s winter break. We suspect a similar explanation for the low observed GUIDs in the first week of Jan for AS137 as well.
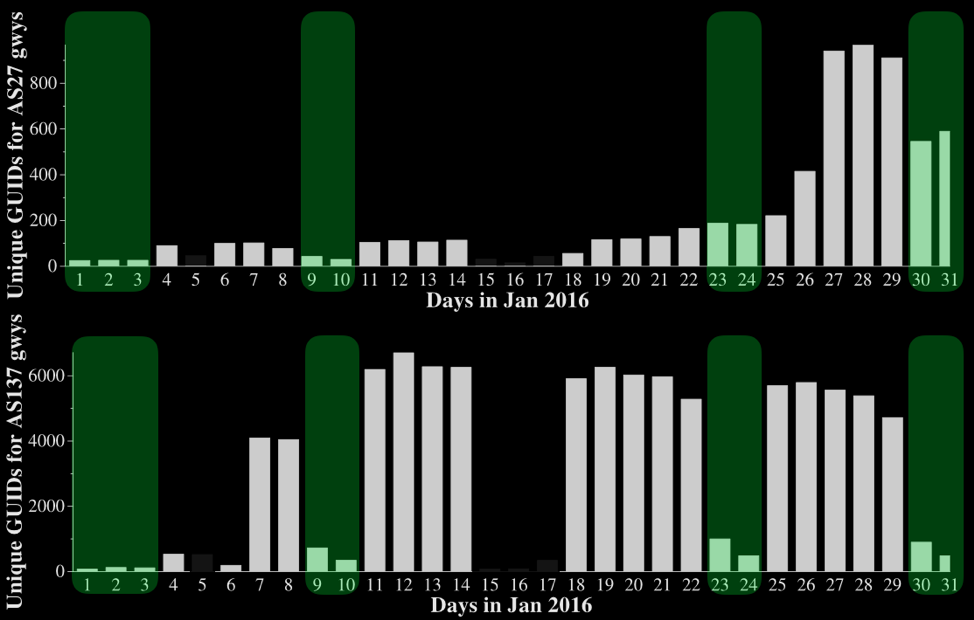
Figure 4: Unique GUIDs observed per day by all identified gateway addresses belonging to two university networks. The top plot shows AS27 (University of Maryland, U.S.) and the bottom plot shows AS137 (Consortium GARR, Italy). Weekends are highlighted in green. Dark areas indicate days with missing data.
Cellular ASes do not appear to see any pronounced weekday-weekend effects, as shown in Figure 5. The number of unique GUIDs across gateway addresses remains more or less stable on all days of the week. However, these results do not yet inform whether the gateway addresses from the cellular ASes are CGN addresses or addresses belonging to public hotspots; further classification is ongoing work.
Exploring more parameters will aid in detecting and classifying gateway addresses
These preliminary results suggest that observed traffic patterns in the large CDN’s download manager logs can be used to detect and categorize gateway addresses.
However, in this study, we chose to only analyse the 56,019 addresses that were associated with more than 10 GUIDs in a day; this threshold may be unnecessarily high. We chose this threshold because a lower threshold could confuse gateway addresses with addresses that are frequently dynamically reassigned.
In ongoing work, we are exploring other parameters to aid with detection. For example, when an address is shared simultaneously across many users, we expect GUIDs to be interleaved over time since many users’ download managers may be active simultaneously. On the other hand, for an address that is undergoing frequent dynamic reassignment, we expect to see fewer interleaved GUIDs.
Another potential approach that can help with this disambiguation is our observation that gateway addresses tend to cluster in the IPv4 address space. Thus, numerically adjacent addresses observing many GUIDs over short periods of time are more likely to be gateway addresses.
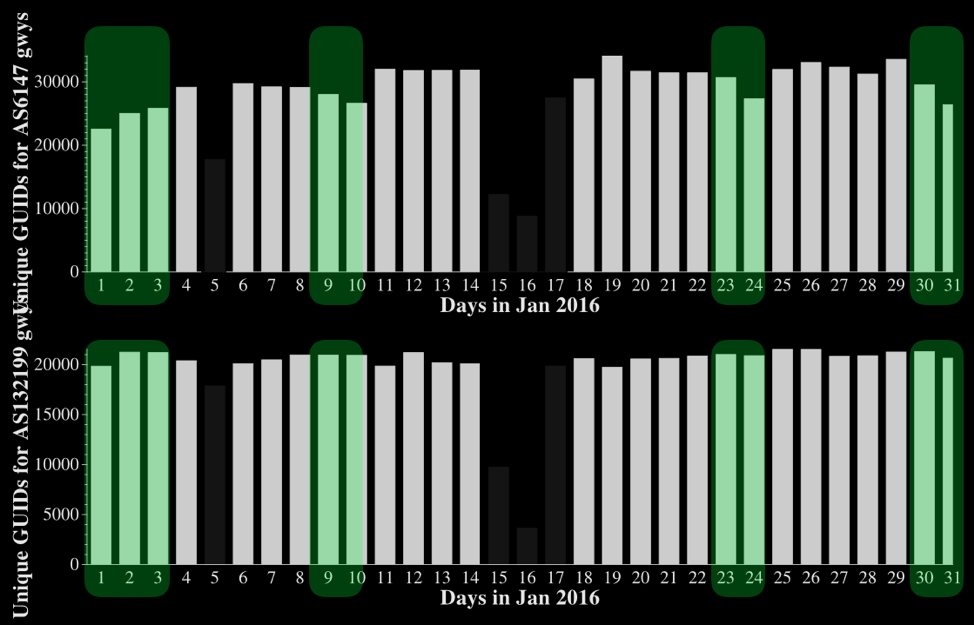
Figure 5: Unique GUIDs observed per day by all identified gateway addresses belonging to two cellular networks. The top plot shows AS6147 (Telefonica Del Peru) and the bottom plot shows AS132199 (Globe Telecom, Philippines). Weekends are highlighted in green. Dark areas indicate days with missing data.
| Number of GUIDs | Times of activity | Day-to-day GUID variation | Gateway Address Category |
| Few | Active weekdays, inactive weekends | Low | Small enterprise |
| Many | Active weekdays, inactive weekends | Low | Large enterprise |
| Few | Active days, inactive nights | High | Small WiFi hotspot (like Starbucks) |
| Many | Active throughout | High | CGN or large public hotspot |
For classifying detected gateway addresses, we are currently looking into using a combination of features from our dataset as shown in Table 1. In addition to the number of observed GUIDs and the times of activity, the day-to-day GUID variation can aid in classifying gateway addresses. For example, if the same set of GUIDs are associated with an address every day and are active on weekdays and inactive on weekends, then it’s likely that the address is that of an enterprise’s proxy. If there is high day-to-day GUID variation, then the address may belong to a public hotspot or a CGN.
The results in this post are based upon an earlier presentation; we continue to actively pursue our gateway address analyses. More recent results suggest that we can also geolocate gateway addresses: for example, in Nov 2017, addresses in the U.S. observed reduced traffic over Thanksgiving holidays, whereas gateway addresses in other countries continued to observe normal traffic. Similarly, addresses in Israel observe reduced traffic on Saturdays.
As we hone our techniques further, we would love to have your feedback. Ground truth that can confirm our observations would also be very helpful.
Ramakrishna Padmanabhan is a PhD student at the University of Maryland who loves to measure networks — their topology, connectivity and performance.
The views expressed by the authors of this blog are their own and do not necessarily reflect the views of APNIC. Please note a Code of Conduct applies to this blog.