
This week we launched our new look APNIC statistics portal.
The new portal continues to display the same data APNIC is collecting on Internet resource distribution in the Asia Pacific region but in a more interactive and user-friendly form. And like all good websites, the portal is mobile friendly.
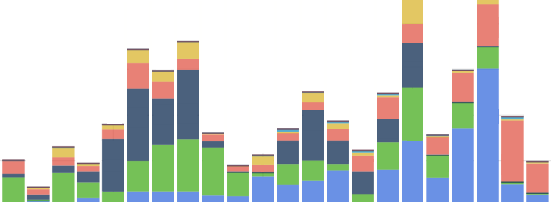
One new feature that we’re excited about is you will now be able to view, download and compare the number of resource delegations for each year by economy, sub-region and region, instead of just a cumulative snapshot. This will allow you to see what changes have happened over the years in your economy/region of interest.
These statistics are publicly available for use in research and analysis, and allow you to analyse IP addressing trends.
Check it out and let us know what you think. https://stats.apnic.net/

The views expressed by the authors of this blog are their own and do not necessarily reflect the views of APNIC. Please note a Code of Conduct applies to this blog.