

The Paris 2024 Olympics marked a pivotal moment for Radiotelevisione Italiana (RAI), with its streaming platform RaiPlay playing a central role in delivering 360 hours of live coverage. This Internet distribution was achieved by cutting-edge Content Delivery Networks (CDNs) that served the long tail (small/medium network operators) through the interconnection infrastructures of national Internet Exchange Points (IXPs) ensuring smooth access for millions of viewers.
Under the Olympeaks observatory (a Namex monitoring initiative), we’ve tracked the impact of RaiPlay’s coverage on Italy’s Internet traffic. The platform attracted record-breaking engagement, with major events like the women’s volleyball final drawing nearly 7M viewers and capturing an impressive 50% audience share. Italian victories, in particular, drove social media buzz, with clips and highlights going viral on platforms like Instagram and TikTok. As the games unfolded, RaiNews also reported a spike in traffic, peaking at 6.5M visits per day and driving 25M video views.
So what was seen in the IXPs?
NOTE: This article’s Internet traffic graphs and examples refer to Namex, the IXP in Rome. The traffic aggregate of one of the CDNs (distributing RaiPlay) and one of the access network operators (ISP) in the IXP will be shown. CDN and ISP traffic in the examples is missing from the y-axis for reasons of data confidentiality.
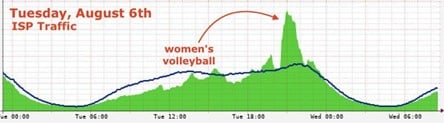
The Italian women’s volleyball team’s gold medal victory was not only a triumph on the court but also a standout moment in Internet traffic, generating one of the most significant spikes and unique traffic patterns.
Although the Olympics started on 26 July 2024, on the Internet, it opened on Saturday, 27 July 2024 with the debut of the Italian men’s volleyball team against Brazil.


One can see the sets played in detail at the CDN and ISP traffic. Italy was beaten by Brazil three sets to one.
The Internet traffic during the Olympics is particularly interesting from a profile point of view, in Namex we did not record any large quantities compared to the peaks seen in the past in relation to Serie A football (DAZN) and the Wednesday Prime Video exclusive Champions League matches. So what is interesting to observe is the shape of the graph rather than its quantity.
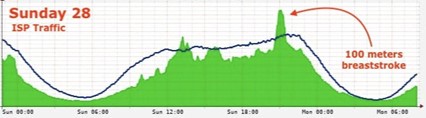
It is also interesting to note the duration of the peaks, they are usually short and related only to the event being streamed. As, in the next example, the 100-metre breaststroke event on Sunday, 28 July.


There were many events during the 2024 Olympics, but the biggest and most interesting ones are highlighted in the Internet traffic statistics. For example, events in swimming and foil fencing drew significant attention, as shown in Figures 7, 8, and 9.

Back to the star of these Internet Olympics in Italy — volleyball. Italy vs Poland on 3 August 2024. The four peaks you see in Figure 9’s red circle reference the four sets played.

On 6 August 2024, you can see this pattern reflected during the three sets between Italy and Serbia (Figures 10, 11, and 12).


Also noteworthy were the tennis matches and the 100 metre event, both of which had a significant impact on Internet traffic on 4 August 2024, as shown in Figures 13, 14, and 15.


These examples of Internet traffic passing through an IXP illustrate the growing shift towards digital content distribution, moving away from traditional broadcast methods. Recently, I’ve also explored the impact of live streaming on Italian football, demonstrating how these traffic spikes have become more frequent and examining the traffic patterns during events like the Sanremo Music Festival.
There is a cultural shift taking place, with watching sports on smartphones and other devices becoming second nature for millions of users. These traffic analyses show that networks are well-equipped to handle these surges.
Flavio Luciani is Chief Technology Officer at Namex (Roma IXP) and co-author of the book ‘BGP: from theory to practice‘.
The views expressed by the authors of this blog are their own and do not necessarily reflect the views of APNIC. Please note a Code of Conduct applies to this blog.
significant information