Low Earth Orbit (LEO) satellite networks are quickly gaining traction with promises of impressively low latency, high bandwidth, and global reach.
My colleagues and I introduce HitchHiking, a methodology to actively measure LEO satellite network characteristics at scale.
Key points:
- The new HitchHiking methodology builds on the key insight that probing publicly exposed devices on LEO satellite networks can reveal characteristics of the underlying satellite network.
- With HitchHiking, we complete the largest study to date of Starlink network latency, measuring over 2,400 users across 27 economies.
- HitchHiking uncovers unexpected patterns in latency that surface how LEO routing is more complex than previously understood.
LEO satellite background
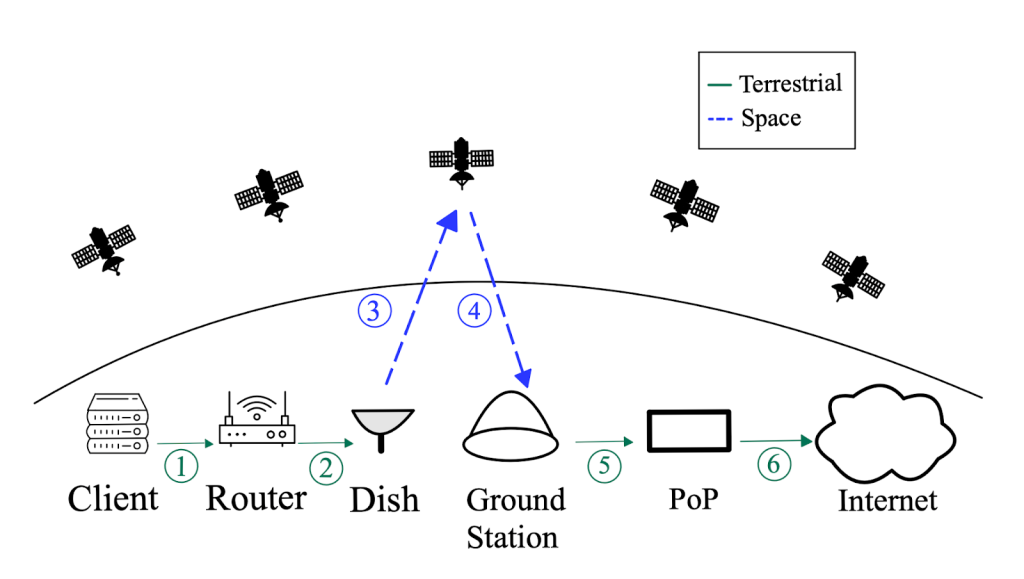
LEO satellite networks comprise hundreds to thousands of satellites that orbit 180 to 1,300 miles from Earth. The most basic and widely deployed LEO architecture follows a ‘bent pipe’ routing scheme (Figure 1) — when a LEO client sends a packet to the public Internet, the packet is sent to a satellite using a dish, and is received by a ground station before forwarding to a Point of Presence (PoP). Some newer satellite architectures are equipped with Inter-Satellite Links (ISLs), which allow satellites to relay packets to each other in space until a ground station is in view.

The drawbacks of existing LEO measurement methods
Up until now, three primary methods have been introduced for studying LEO satellite networks:
- Buying and deploying one’s own specialized hardware (such as a dish) to connect to the satellite Internet, capturing real data but providing little coverage.
- Recruiting others with existing hardware, providing greater coverage at the cost of increased labour.
- Using theoretical models provides the most coverage but no real data.
Unfortunately, these methods face an inherent tradeoff between collecting real data, coverage of vantage points, labour, and monetary cost. Thus, the research community knows relatively little about LEO operation and performance in practice.
LEO HitchHiking: A new LEO measurement methodology
We introduce LEO HitchHiking, a general methodology to measure LEO satellite network characteristics at scale. HitchHiking builds on the key insight that probing publicly exposed satellite-routed devices can reveal the underlying satellite network architecture and performance characteristics. In contrast to previously used ‘inside-out’ methodologies (connecting a measurement instrument to a satellite dish), which require physical access to privileged vantage points, the ‘outside-in’ HitchHiking methodology requires no specialized hardware or painstaking recruitment. HitchHiking can measure wherever satellite clients are already located across the globe.
Broadly, HitchHiking consists of three steps:
- Identify publicly accessible endpoints (servers, routers) that transit LEO satellites for connectivity
- Isolate where in the network path LEO satellites are used (for example, steps 3 and 4 in Figure 1).
- Craft an experiment to measure a desired characteristic (for example, latency or availability) of the satellite link.
HitchHiking is open-sourced and can be found at GitHub.
HitchHiking LEO satellites to measure world-wide latency
We perform the most geographically diverse data-driven analysis of LEO satellite latency to date. We use HitchHiking to collect Starlink latency data between 18 May to 23 June 2023, allowing us to measure over 2,400 users across 27 economies.
Customer latency varies dramatically depending on their geographic location. In Figure 2, we show that Nigerian-PoP customers experience the highest average RTT.

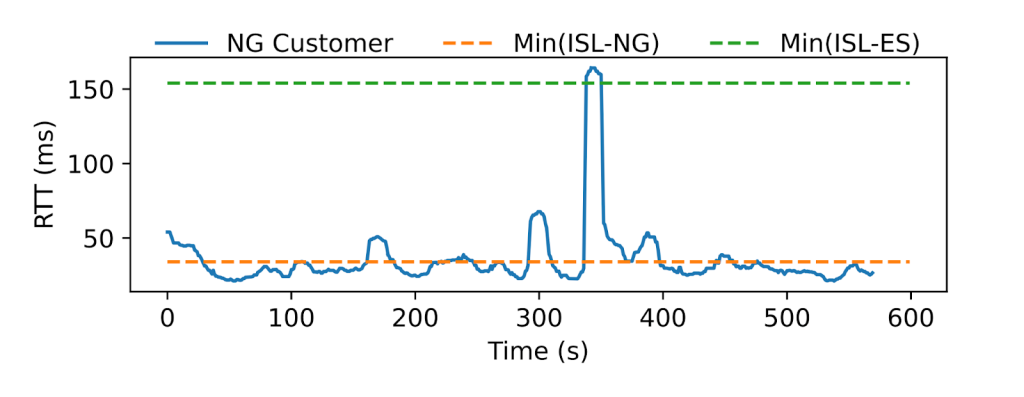
To better understand latency patterns in Nigeria, we study the latency of individual customers. We plot the latency of one such customer in Figure 3. One-third of the time, the Nigerian customer’s RTTs increase between two–to-five fold the median, indicating that Starlink is likely connecting customers with distant ground stations. Indeed, Starlink engineers confirm that these sustained latency spikes are due to customers using ISLs, which route through ground stations located anywhere in the world — not necessarily in close geo-proximity.

We find that customers who must fully rely on ISLs (such as customers near Nigeria) experience substantially worse latency than the expected direct ISL routing latency, which Starlink independently confirms.
Sustained latency spikes are widespread and constant; at least 70% of customers experience at least one sustained latency every day during our month-long five-minute data collection. Starlink engineers share that they are still building their ISL ‘mesh’ and hope to improve edge case performance over time.
This work was presented at SIGMETRICS 2024. The paper is available to read.
Liz Izhikevich is an Assistant Professor at the Electrical and Computer Engineering Department at the University of California, Los Angeles. Her research brings a data-driven approach to understanding the Internet’s performance and security.
Adapted from the original at Internet Society’s Pulse Blog.
The views expressed by the authors of this blog are their own and do not necessarily reflect the views of APNIC. Please note a Code of Conduct applies to this blog.
