
Readers of this blog will know that I have a passing interest in the potential and limitations of Low Earth Orbit (LEO) Internet satellite systems, mostly in the context of connecting users in remote Pacific islands and other hard-to-get-fibre-to places. SpaceX’s Starlink is currently the only commercially available system with over 3,000 satellites (and counting) in space. Yet several issues I discussed in my four-part blog series last year are still not widely discussed out there, and it’s always better to talk from experience rather than theory.
The setup
Well, the opportunity to obtain some real-world experience came in late 2022 as the University of Auckland Computer Science’s (my workplace) annual OPEX budget provided enough spare cash to obtain a Starlink user terminal (of the new, rectangular kind) along with a roaming subscription.
For those unfamiliar with how it all works: Starlink’s end user terminal (called ‘Dishy McFlatface’ or ‘Dishy’ for short) consists of four parts out of the box — a power cable, a Wi-Fi router it plugs into, the dish, and a stand for the latter. The Dishy isn’t actually a dish — it’s a phased array antenna, and basically looks like a futuristic coffee table from the 1970s. Unlike a real coffee table, it comes out of the box somewhat inclined, so any temptation to put your cuppa on it after putting it into the stand is thwarted right away. It’s a clever design! Dishy itself comes with a long cable permanently attached. The far end of the cable plugs into the Wi-Fi router, and that’s as much electrical know-how as you need to wire it all up.
As for the roaming subscription, it’s a little more complex. Starlink originally only offered fixed subscriptions, meaning that you had to specify the address of operation to Starlink at the time of your order, and then stay within a relatively small geographical cell around that address or risk losing service. Why? Well, there are only so many Starlink satellites your Dishy (and all the others in your cell) can see at any one time, and each satellite has a limited capacity to carry traffic.
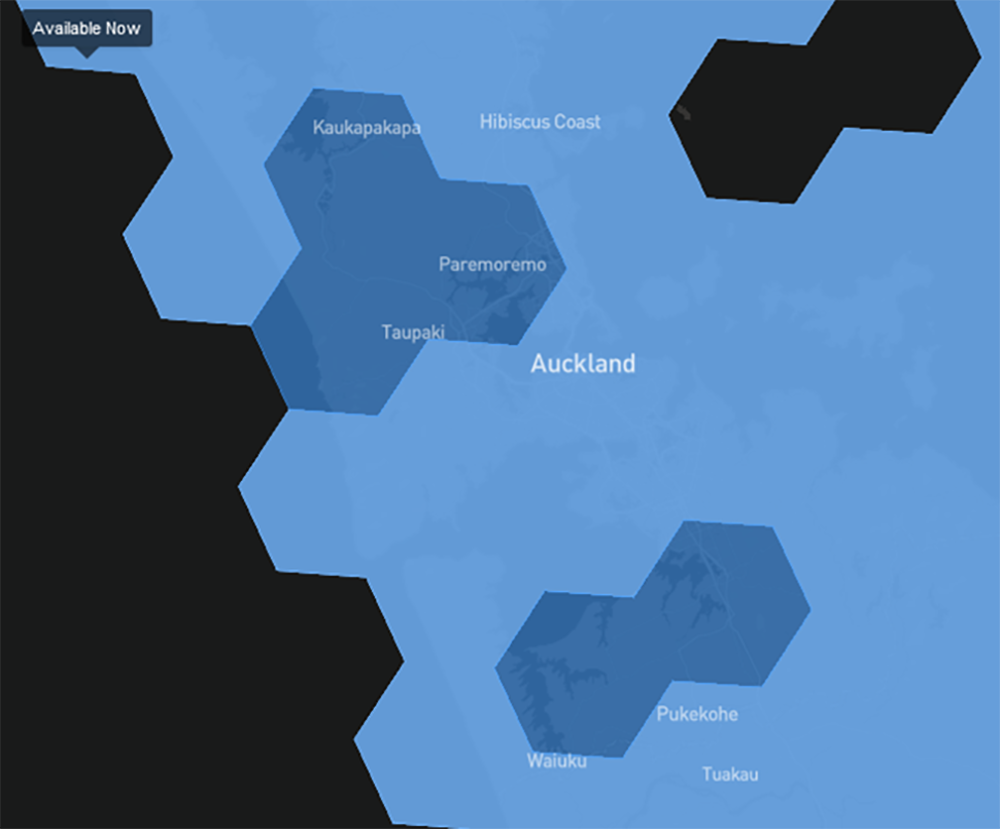
Starlink can’t have too many Dishy’s huddling together in the same neighbourhood lest the satellite(s) in sight run out of capacity. You can currently still see this effect on Starlink’s availability maps if you go to areas with high user demand density and few alternative options (typically small towns in the US mid-west where TV cable companies hold network monopolies, or in the lifestyle block belt around larger cities in Australia and New Zealand where the advanced broadband initiatives have yet to arrive) and Starlink is available all around but not in those spots. As the number of Starlink satellites has increased, so has the capacity to accommodate a small number of ‘surprise guests’ in each cell, which is where the roaming subscription comes in. It is aimed at RV (motorhome) users, costs around 25% more and promises a little less ‘speed’.
We went for the roaming subscription as our campus is so densely built up now that there are few places if any from which we can see significant sections of the sky. Running around on a roof with a bunch of students is regarded as a health and safety nightmare these days. The roaming subscription allows us to take the unit off campus, so it can be used for field trips and demos as well. We also got ourselves a portable power station to make sure we wouldn’t need to look around for a suitable power outlet.
Out of the box and beyond
In your urge to unbox your Starlink unit, be aware that you’ll also need a smartphone with Wi-Fi and the Starlink app.
Before you power anything up, you’ll want to place your Dishy into a spot where it can see a good portion of the ‘right’ part of the sky. If you are well south of the Equator, the right part of the sky is the southern sky (unless you’re close to or south of 53° latitude, in which case it’s probably the sky right above you or even to the north). If you are well north of the Equator, the same rules apply, just substitute ‘north’ for ‘south’ and vice versa. If you’re in the tropics, you’re probably out of luck, but try and see what Dishy will say / see. Eventually, you’re meant to get service there, too. My guess is probably southern sky if you’re south of the Equator and vice versa.
As you power the unit up for the first time, you’ll notice a Wi-Fi network called ‘STINKY’ pop up – yes that’s Starlink toilet humour and it is the Wi-Fi router speaking. We have clearly moved on from the days of Her Majesty’s Post Office Wireless Section! You’ll probably want to rename it though and give it a password as you configure the unit via the app – reboots may be required.
While you’re busy setting up the router configuration, Dishy will go about its own business finding satellites. This includes it going initially into the true coffee table position (again, do not place your cuppa …). Eventually, if like most current users, you’re in a moderate southern / northern latitude, it will swivel and tilt so it’s facing the southern / northern sky. Our experiments showed that the current version of Dishy’s control software will do so even if that part of the sky is heavily obstructed and other parts are not.
Last but not least: When you’re ready to power the unit down, don’t forget to go to your Starlink app and use it to put Dishy into the stowage position. Otherwise, you’ll have a hard time getting it back into the box.
Useful extra bits
Our first outing with our unit was to a local park with near-perfect take-off to the sky in all directions. In Auckland, that also means it’s windy, and if you want to keep Dishy from toppling over in a field setting, take a few tent or weed mat wire pegs — the stand has the requisite holes to accommodate them.
Doing any sort of performance measurement is also tricky unless you know what it is that you are measuring. Out-of-the-box Starlink is a particularly bad candidate for such measurements as the link between your device and the Wi-Fi router is all about your local Wi-Fi environment and mostly not about Starlink, so it’s hard to tell whether your drop in goodput is really Starlink’s fault or maybe just a burst of traffic on a neighbouring Wi-Fi hotspot. Luckily, there is an Ethernet adapter available from Starlink that you insert between Dishy and the Wi-Fi router, and which allows you to connect whatever you want to talk directly to Dishy (make sure you push the connector in all the way so it’s flush).
First experiments
Confession: I have to plead unfair advantage here. All our experiments to date were carried out within a 10km radius of the Auckland Central Business District. Why does this matter? It’s very simple: Starlink’s choice of satellites to connect your Dishy to one of its teleports currently still requires these satellites to be visible by both your Dishy and a teleport. If your Dishy and the nearest teleport(s) are very close geographically, they’ll both see more or less the same set of satellites, which maximizes this choice.
Auckland has three teleports in close proximity: Clevedon, a rural suburb to the southeast about 30km from the CBD; Te Hana, a rural settlement 70km away just beyond the far edge of Auckland’s northern commute catchment; and Puwera just south of Whangarei, about 125km away. Given Starlink satellites’ orbital height of about 550km, this is all in the neighbourhood, really. This minimizes outage probability; if you’re further away from your nearest teleport, then you might not be as lucky.
Also — unfair advantage number 2: New Zealand’s efforts to get fibre to most homes mean that around NZD 80 (USD 50) or so a month buys you a fibre connection that will get you data rates from local servers in town at 900Mb/s or above and at round-trip-times (RTT) of consistently under 5ms, which is pretty good by international standards. Most Aucklanders in the urban area at least have access to this service level now.
Starlink’s fixed service (which offers the higher rates) costs about twice that, usually clocks in at well under half my domestic fibre connection on Ookla speed tests, and does so with RTTs between 21ms and over 200ms. In other words — my neighbours have zero performance or financial incentive to move to Starlink. That’s different in rural areas, but for me and the Starlink cell(s), I’m in Auckland; it means little competition from other users, and that matters as we know from semi-rural areas with high demand where you simply can’t order a Dishy because Starlink has hit capacity there.
To summarize my disclaimer — don’t expect the performance we’ve seen if you live further away from a gateway, or your neighbours have been screaming out for better connectivity until they got their Dishy.
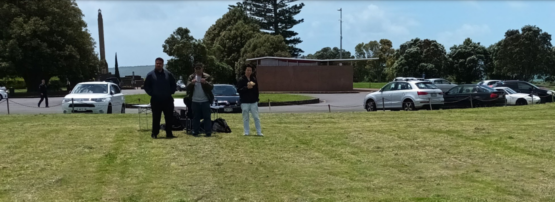
I’ve already pointed out that our first outing on 1 December 2022 — the local suburban park — ensured that we didn’t have to contend with a lot of interfering Wi-Fi signals. The inimitable Wayne Reiher and Lucas Betts came along for the ride, as did ‘Etuate Cocker (guest of honour from Wellington), who had found himself in Auckland that day with a few hours to spare. Fly in the ointment — what I thought was my laptop power supply turned out to be something else altogether, which restricted our experiments to the capacity of my laptop battery. Doh.
Dishy booted within about a minute and it then oriented itself south, which was expected. Auckland is roughly at 37° S, and as most Starlink satellites operate at 53° or 53.2° inclination, they crowd together just short of the 53rd parallel. So, this is where Dishy can see most satellites.
We measured mains power going from our power station into the unit, typically around 60-70W with peaks to just over 100W.
Dave Täht had tipped us off just before the outing that some Starlink twitterati had announced that Starlink was now using IPv6. Ipaddress.com showed ours at 206.83.102.102, but without any IPv6, so clearly the IPv6 rollout hadn’t been global.
We then did a series of round-robin ‘speed tests’ with speedtest.net to four servers based at a variety of ISPs in Auckland. The average RTT was 44.1ms, the average download rate was just under 100Mb/s, and the average upload rate was 8.64Mb/s. That said, there was considerable variation, with RTTs 33 to 92ms, download rates between 54.4 and 176.1Mb/s and uploads between 3 and 15Mb/s. I’m not going to reveal the ‘fastest’ ISP — the data set we were able to collect was just too small.
It occurred to me as an afterthought — what if Starlink gamed speed tests? To find out whether this might be the case, we ran a short iperf3 test to the University of Auckland, via a VPN tunnel so Starlink couldn’t ‘see’ the purpose of the transfer. 5.8Mb/s up — well within the range of the speedtest.net results. There’s no download data, sorry — the VPN didn’t let us reverse the direction (note to self — ask IT to open a port for us next time).
A marathon ping test to a university target showed RTTs between 22ms and 425ms. That’s an awful lot of buffer. We also observed oscillations in RTT over a roughly three-second period but almost no losses. This is characteristic of TCP queue oscillation in a FIFO byte buffer.
It was time to turn the video on. A Zoom call to a colleague hiding down in the countryside went perfectly well with a good resolution both ways and no noticeable artefacts. The wind was atrocious though and the only reason I can comment on the audio quality was that we recorded the session. Just to give Starlink a bit of a workout, we also invited ‘Etuate to run a work Zoom call from his mobile in parallel; again Starlink managed both calls with ease.
Dave had also asked us to run a bunch of Flent tests, which we got to run about 20 of before the laptop shut down. Result: Bufferbloat.
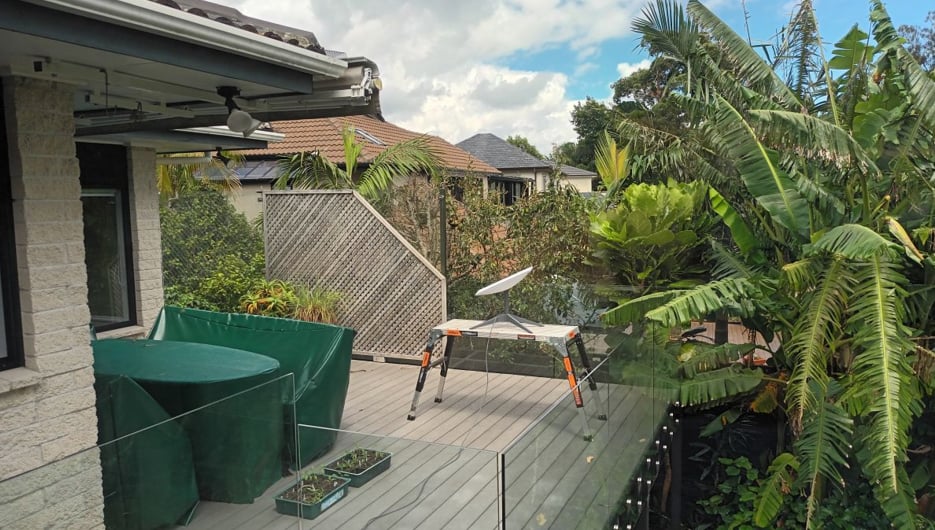
Fast-forward to the middle of January 2023. The summer holiday was rained out, it was back to work, and since nobody is at university at that time of year, I grabbed the Starlink unit and took it home. The pros — mains power, and an opportunity to see what happens when you put Dishy into a position where it can’t see all the sky. Plus, there were two extra props — a newly-arrived Starlink Ethernet adapter, to bypass the Wi-Fi altogether, and a painter’s trestle. The location? My first-floor deck (Figure 2).
This looks out to the northwest, with the southern sky obscured by my house and a 2m tall 12mm glass pane. The western and northern aspects aren’t much better with vegetation, but as it turned out, this was irrelevant. An interesting insight up front: Dishy is hell-bent on turning itself southbound no matter how badly obscured that direction is compared to the northern sky. It’s clearly going by the geographical direction it expects to see most satellites in, not by where it can see most satellites. It would happily stare at my living room with almost no sky within view of its front face, and complain about obstruction, with plenty of open skies just above and behind it. That seems a bit dumb.
I first tried on the floor of the deck and then subsequently in the same position but elevated by 80cm on the painter’s trestle as shown here, with Dishy duly pointing itself southward as shown below. In both positions, there is some obstruction from the roof and the glass pane between the house and trellis as well as the neighbour’s house. In the ground position, the take-off angle to the sky was completely blocked to at least 40° of elevation, from the trestle a little less so.
The Ethernet adapter exposes a network with gateway 192.168.1.1/24 and DHCP. The gateway exposes an HTTP (but not HTTPS) server that serves an SVG graphic of a rocket and a little blurb that states you are connected to Starlink.
Again, no IPv6 is seen from the wider world vantage point. In the ground position, the speedtest.net pings in four tests each to five local ISPs averaged just over 46ms, which is not significantly different from the unobstructed tests at the local park. Downloads averaged 75.53Mb/s, with a range of between 23.3Mb/s and 183.6Mb/s. Uploads between 3Mb/s and 21.8Mb/s averaged at 13Mb/s. Again, it’s probably too few tests to be significant.
What was noticeable, however, were the ping and traceroute test results to our university server. These gave RTTs between 21 and 328ms only, despite a much longer observation period (nearly 19 hours), suggesting that something had changed on the buffering front. Or maybe that was just the fact that I’d bypassed the buffer in the Wi-Fi router by using the Ethernet adapter. The traceroute showed again that the vast majority of the RTT is spent in the Starlink network itself. Do I still smell Bufferbloat here? Yes!
The overall ping fail rate was 1.45% with fairly regular burst losses. The longest burst loss seen was six seconds long.
Putting Dishy on the trestle gave no significant improvement in speedtest.net rates (to the contrary, but again the differences weren’t huge and dwarfed by the huge variations between individual tests, so it’s not safe to draw any statistical inferences here). It did however result in fewer ping losses — 0.81% over 24 hours with the longest burst loss being three seconds.
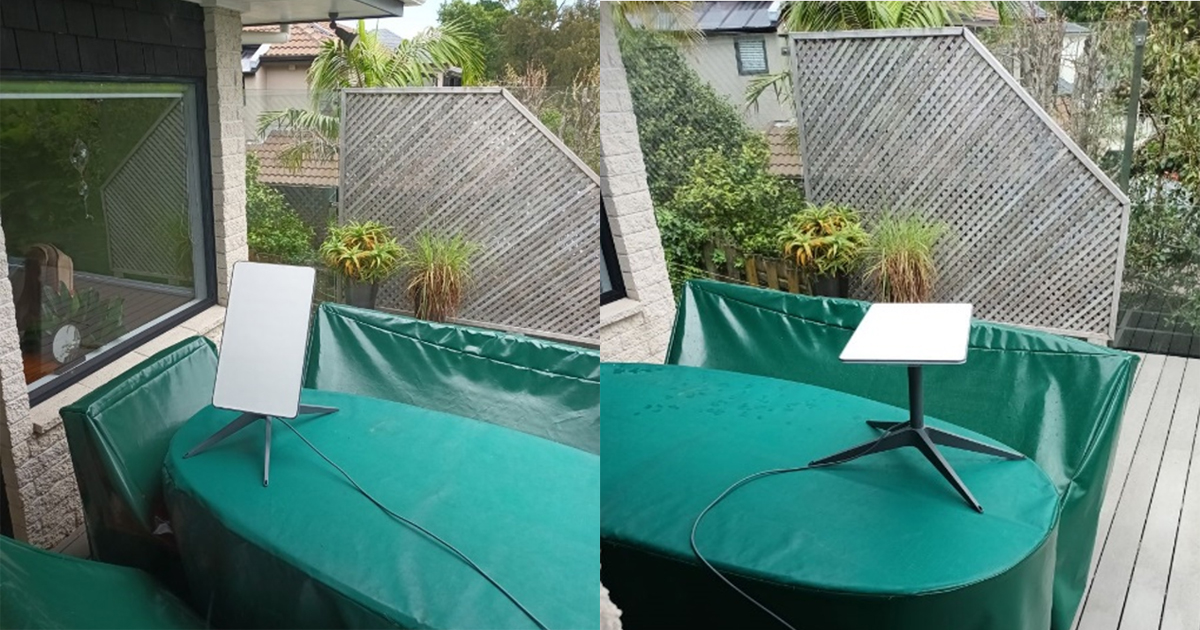
Overall, this seemed quite encouraging, so I tried Mission Impossible — putting Dishy under my eaves trying to force it to seek northbound (Figure 3, left). It didn’t work. Even a bit further away from the eaves it wasn’t willing to commit and remained just off the coffee table position (Figure 3, right):
The cyclone
Just as I was about to wrap up this blog post, along came Cyclone Gabrielle, touted as the worst storm this century. What an opportunity to see how our Starlink kit would fare under the heavy rain. As the university sent us all home, I took the Starlink with me again and set it up on the painter’s trestle once more, secured with a few cable ties and some bricks even though it is in a sheltered location. My main question this time — what would the impact of rain fade be on the performance? Would Dishy just disconnect completely, rate down, or what?
We used the following experiments — a long-term series ping with large packets to maximize the chance of fade-induced bit errors and, at varying intervals, sets of four speedtest.net tests to a local ISP’s server. During the 24-hour period, we clocked up a measly 152mm of rain — just over half of the deluge we had two weeks earlier.
Then again, other users and ground stations are also part of the equation. The three aforementioned ground stations are all in affected areas: Clevedon curiously sits in a ‘white spot’ surrounded by a large outage area; the outage started on the morning of Sunday, 12 February 2023 before my observations began. Te Hana is in the middle of a large outage zone, too, as reported at 22:57 (UTC +12) on 12 February, and the teleport at Puwera in Northland was also part of an outage zone. Quite how badly they affected each station is something only Starlink knows. Google Earth doesn’t show much in terms of generator stations or batteries in the vicinity.
The good news is that connectivity was never lost for long — the longest stretch of lost pings was 22. Packet loss was just under 2.5%, somewhat higher than the 2.1% seen a couple of weeks later in better weather.
What was noticeable was that until 23:00 (UTC +12), not a single of the 24 download ‘speed tests’ taken resulted in rates of 100Mb/s or more, and some gave abysmal rates in the single digits. Yet, thereafter, higher rates were seen regularly. Our own pings with the large packets resulted in slightly higher RTTs than the speedtest.net ones. At first, consistently high minimum RTTs of around 60ms were seen on the ping test, which then suddenly dropped to around 30ms at about 22:00 (UTC +12), before jumping around in discernible steps for the rest of the night. Average RTTs followed that pattern (Figure 4). What happened here?
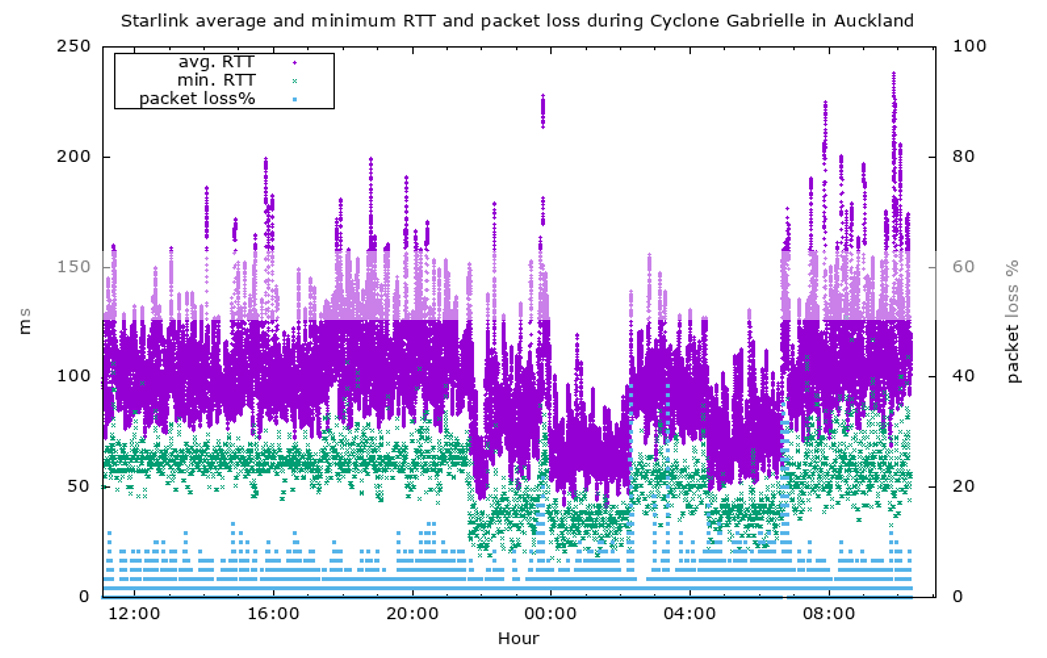
Long RTTs are usually a sign of congestion, and with the populous of the Starlink-rich lifestyle block belts around Auckland largely discouraged from commuting that day, perhaps that should have been expected. Similarly, these were the folk affected by most of the power outages.
So, did the drop in RTT and the improvement in achievable rates align with large swathes of semi-rural Auckland and elsewhere going dark? Perhaps, but the distinct steps seen in the RTTs suggest that it is more than that, such as a change in gateway configuration or availability. Whatever it was, I was able to follow events and Civil Defence notices easily with whatever service Starlink had left for me. Then again, my beaker collected only 152mm of rain during the experiment, and I know that some parts of New Zealand’s North Island saw vastly more than that.
Conclusion
Subject to my disclaimer above, Starlink worked in the locations we tried, with data rates somewhere between a mediocre ADSL connection and a low to medium-rate fibre-to-the-home connection. Average rates on our RV subscription were comparable to a VDSL link. That said, rates vary greatly over time, even with a clear view of the sky, suggesting that the amount of competing traffic on the relaying satellite(s) causes congestion, especially where traffic on RV subscription is given lower priority.
RTTs from pings and traceroutes give ample indication of excessive buffering within Starlink’s own network, and no it’s not their Wi-Fi router, or at least not just the Wi-Fi router.
The fact that moderate obstruction of the southern sky (Dishy’s target zone) didn’t cause overly serious drops in performance was a pleasant surprise, as was the fact that connectivity could, by and large, be maintained during the cyclone, albeit at somewhat depressed rates and raised RTTs. Maybe something for Civil Defence folk to think about for their centres and shelters, given widespread mobile and fixed network outages. Starlink does need a substantial power source, though, so should be paired with a generator and battery power station to last through the night and the days after.
The fact that Dishy wouldn’t use the northern sky or the sky overhead if it couldn’t see the southern sky seemed a bit odd. There are satellites there, too, even if not as many, and it’s not quite clear why Starlink won’t try to use them. It can’t all be due to geostationary arc protection, can it? Perhaps it’s something for a firmware update to fix in due course?
I presented this research during the APNIC Panel – Satellite broadband in the Asia-Pacific: Technology and policy at APRICOT 2023 / APNIC 55. Watch the panel discussion now:
Dr Ulrich Speidel is a senior lecturer in Computer Science at the University of Auckland with research interests in fundamental and applied problems in data communications, information theory, signal processing and information measurement. The APNIC Foundation has supported his research through its ISIF Asia grants.
The views expressed by the authors of this blog are their own and do not necessarily reflect the views of APNIC. Please note a Code of Conduct applies to this blog.