
When a packet travels across the Internet, it travels through multiple routers. The traceroute and My Traceroute (MTR) tools can be used to identify the routers a packet passes through between you and a given destination IP address.
Traceroute is a one-shot sort of tool, whereas MTR runs and aggregates the results of several traceroutes. If you simply want to find the routers your packet passes through, a traceroute is fine. If you want to diagnose a problem such as packet loss, MTR is the tool to use.
In this post, we’ll talk in the context of the output of MTR given it is more versatile.
Types of trace
Traceroute and MTR both support different types of tracing. The two main types are User Datagram Protocol (UDP) and Internet Control Message Protocol (ICMP).
Both trace types send a series of packets, with incrementing Time to Live (TTL) fields. The idea is that if a packet is sent with a TTL of 1, it will be rejected (with a TTL time exceeded ICMP message) at the first router in the network. We then send a packet with a TTL of 2 and it is rejected at the second router in the network, and so on. We use the source IP address and timings of the TTL time exceeded messages to build our path list.
Some routers will not send TTL time exceeded messages for UDP, ICMP, or both. In this author’s experience, ICMP is a more reliable type of trace so should be your first port of call. For traceroute you should call it traceroute -I for ICMP mode. ICMP is usually the default for MTR so no parameters are needed.
MTR fields
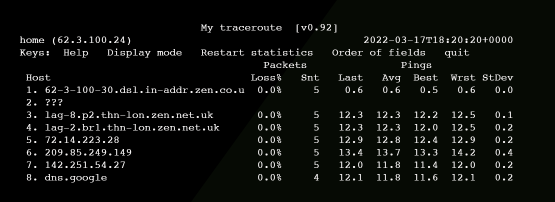
Output from the MTR command looks something like the following:
                             My traceroute  [v0.92]
home (62.3.100.24)                                     2022-03-17T18:20:20+0000
Keys:  Help   Display mode   Restart statistics   Order of fields   quit
                                       Packets               Pings
 Host                                Loss%   Snt   Last   Avg  Best  Wrst StDev
 1. 62-3-100-30.dsl.in-addr.zen.co.u  0.0%     5    0.6   0.6   0.5   0.6   0.0
 2. ???
 3. lag-8.p2.thn-lon.zen.net.uk       0.0%     5   12.3  12.3  12.2  12.5   0.1
 4. lag-2.br1.thn-lon.zen.net.uk      0.0%     5   12.3  12.3  12.0  12.5   0.2
 5. 72.14.223.28                      0.0%     5   12.9  12.8  12.4  12.9   0.2
 6. 209.85.249.149                    0.0%     5   13.4  13.7  13.3  14.2   0.4
 7. 142.251.54.27                     0.0%     5   12.0  11.8  11.4  12.0   0.2
 8. dns.google                        0.0%     4   12.1  11.8  11.6  12.1   0.2
You will see:
- The hostname or IP address of that particular hop on the network (run mtr -n if you don’t want it to resolve IPs to hostname).
- The percentage of packets lost by that hop.
- Number of packets sent to that hop.
- The round trip time (that is, how long it took to get a response) for the hop.
- The average, best, worst and standard deviation round trip times, since you started running the MTR.
MTR hops
In the above MTR, you will see eight hops. The second hop shows the host as ???. That is because it did not send a TTL time exceeded message in response to our probe.
This isn’t uncommon and is nothing to worry about if the missing hops are in the middle of the trace. The trace got beyond that hop, so it’s not a problem.
If all of the ??? hosts are at the end, then this might be indicative of a problem (that is, 100% packet loss from that point). Or it might just mean that none of the last few hops send TTL time exceeded messages. It’s hard to tell.
MTR hop DNS names
The DNS names shown by MTR can be very revealing. Many large providers put information about their routers in the DNS name. In the above example, you will see lag-2.br1.thn-lon.zen.net.uk. This is, most probably, link aggregation interface 2 on a router named br1 in the Telehouse North data centre in London, UK. As such, we can start to get an understanding of the physical path around the world a packet takes.
Look at the below MTR:
                             My traceroute  [v0.92]
home (62.3.100.24)                                     2022-03-17T18:32:05+0000
Keys:  Help   Display mode   Restart statistics   Order of fields   quit
                                       Packets               Pings
 Host                                Loss%   Snt   Last   Avg  Best  Wrst StDev
 1. 62-3-100-30.dsl.in-addr.zen.co.u  0.0%    18    0.5   0.5   0.4   0.9   0.1
 2. ???
 3. lag-8.p2.thn-lon.zen.net.uk       0.0%    18   12.1  12.3  11.9  12.7   0.2
 4. lag-2.br1.thn-lon.zen.net.uk      0.0%    18   12.1  12.6  11.9  15.5   1.0
 5. ge-3-3-0.mpr1.lhr3.uk.above.net   0.0%    18   11.9  12.3  11.7  13.7   0.6
 6. ae10.cs3.lhr11.uk.zip.zayo.com   88.2%    18   83.5  83.7  83.5  83.9   0.3
 7. ae5.cs1.lga5.us.eth.zayo.com      0.0%    18   82.9  83.8  82.7  90.4   1.8
 8. ae8.mpr3.bos2.us.zip.zayo.com     0.0%    18   87.3  83.6  82.6  87.3   1.5
 9. ???
10. ???
11. http-lb-02.us.cloudcall.com       0.0%    17   88.8  90.0  88.3  92.1   1.2
We can see that the packet goes via:
- Zen in London Telehouse North
- Zayo/AboveNet in London (lots of providers like to use airport codes for their router location. LHR is London Heathrow.)
- Zayo in New York
- Zayo in Boston
This also implies that the destination is, probably, a Zayo customer but we can’t tell for sure as hops 9 and 10 are blank.
Packet loss and Round Trip Times
You will see in the above MTR example that hop 8 (ae10.cs3.lhr11.uk.zip.zayo.com) has 88.2% packet loss. This is bad, right? No. Packet loss and increased round-trip time (RTT) on a single hop is expected if that hop limits the rate at which it sends TTL time exceeded ICMP messages.
The key thing that many people fail to understand about an MTR or traceroute is: Unless packet loss or increased RTT is seen on every hop between a given hop and the end of the trace, it is not a problem.
Take this traceroute, for example:
HOST: localhost                      Loss%   Snt   Last  Avg  Best  Wrst   StDev
   1. 63.247.74.43                   0.0%    10    0.3   0.6   0.3   1.2   0.3
   2. 63.247.64.157                  0.0%    10    0.4   1.0   0.4   6.1   1.8
   3. 209.51.130.213                60.0%    10    0.8   2.7   0.8  19.0   5.7
   4. aix.pr1.atl.google.com        60.0%    10    6.7   6.8   6.7   6.9   0.1
   5. 72.14.233.56                  50.0%    10    7.2   8.3   7.1  16.4   2.9
   6. 209.85.254.247                40.0%    10   39.1  39.4  39.1  39.7   0.2
   7. 64.233.174.46                 40.0%    10   39.6  40.4  39.4  46.9   2.3
   8. gw-in-f147.1e100.net          40.0%    10   39.6  40.5  39.5  46.7   2.2
We can see that hop 3 has 60% packet loss and that loss carries all the way to the end of the trace, which has 40% packet loss. This means that hop 3 is possibly (see the section below on forward vs return path) introducing packet loss and the total loss between you and your destination is 40%. The other 20% can be ignored.
What we can learn from RTT
The RTT of each hop is a useful metric to us because it tells us how long a packet took to get to that hop, as compared to the previous hop. Take this MTR:
                                      My traceroute  [v0.92]
home (62.3.100.24)                                                2022-03-17T18:57:17+0000
Keys:  Help   Display mode   Restart statistics   Order of fields   quit
                                                         Packets               Pings
 Host                                                  Loss%   Snt   Last   Avg  Best  Wrst StDev
 1. 62-3-100-30.dsl.in-addr.zen.co.uk                   0.0%     7    0.5   0.6   0.5   0.8   0.1
 2. ???
 3. lag-8.p1.thn-lon.zen.net.uk                         0.0%     7   12.2  15.8  12.2  25.2   6.2
 4. lag-1.br1.thn-lon.zen.net.uk                        0.0%     7   12.3  12.9  12.1  16.4   1.6
 5. ldn-b3-link.ip.twelve99.net                         0.0%     6   12.1  12.7  12.0  15.6   1.4
 6. ldn-bb4-link.ip.twelve99.net                        0.0%     6   12.2  12.3  11.9  12.9   0.4
 7. nyk-bb1-link.ip.twelve99.net                        0.0%     6   84.5  84.5  84.3  84.7   0.2
 8. nyk-b2-link.ip.twelve99.net                         0.0%     6   81.7  81.7  81.6  81.9   0.1
 9. choopa-svc071182-lag000971.ip.twelve99-cust.net     0.0%     6   88.5  86.9  81.3  95.9   6.5
10. ???
We can see that the RTT increases sharply between hops 6 and 7. We can see, by the DNS names, that hop 6 is in London, UK, whereas hop 7 is in New York, USA. As such, we would expect a significant increase at this point which we would expect to carry through to the end of the trace.
Remember: Unless packet loss or increased RTT is seen on every hop between a given hop and the end of the trace, it is not a problem.
This is useful because if it wasn’t obvious that hop 6 was the UK and hop 7 was the USA then we can quite clearly see where the packet crossed the Atlantic.
If we know that both source and destination are in the UK and we see big increases in RTT between a given hop and the end of the trace, then we know something is wrong. Maybe it’s going a really long way round (for example, to the US and back) or a particular hop is possibly introducing latency.
A note about MPLS
You might look at a trace between the UK and Australia and see the packet leave the UK on hop 5 then arrive in Australia on hop 6. In reality, it’s almost certainly not going directly between the two points. There will be an Multiprotocol Label Switching (MPLS) network in the middle, which will obscure the path to some extent. This doesn’t matter as if you are sure that a Zayo hop is introducing problems, it doesn’t matter whether it’s in London or Las Vegas, it’s still Zayo’s problem.
Fun tip: You can press e when an MTR is running to see MPLS labels from some of the hops:
                                      My traceroute  [v0.92]
home (62.3.100.24)                                                       2022-03-17T19:08:05+0000
Keys:  Help   Display mode   Restart statistics   Order of fields   quit
                                                         Packets               Pings
 Host                                                  Loss%   Snt   Last   Avg  Best  Wrst StDev
 1. 62-3-100-30.dsl.in-addr.zen.co.uk                   0.0%    74    0.4   0.5   0.4   0.8   0.1
 2. ???
 3. lag-8.p2.thn-lon.zen.net.uk                         0.0%    74   12.6  13.7  12.0  32.0   3.4
    [MPLS: Lbl 24012 Exp 0 S 1 TTL 1]
 4. lag-2.br1.thn-lon.zen.net.uk                        0.0%    74   17.7  14.2  11.8  35.4   4.4
 5. bbr02.lon01.networklayer.com                        0.0%    74   12.1  13.5  11.7  30.0   3.2
 6. ae5.cbs01.tg01.lon01.networklayer.com              64.4%    74   12.8  15.1  12.6  21.3   2.9
    [MPLS: Lbl 205039 Exp 0 S 1 TTL 1]
 7. ae0.cbs01.xn01.fra01.networklayer.com              41.1%    74   26.7  25.3  23.4  43.4   3.4
    [MPLS: Lbl 126402 Exp 0 S 1 TTL 1]
 8. ae0.cbs02.ic01.mil02.networklayer.com               1.4%    74   32.5  35.7  32.5  61.2   5.4
    [MPLS: Lbl 809963 Exp 0 S 1 TTL 1]
 9. ae7.cbs01.ic01.mil02.networklayer.com              21.9%    73   34.9  35.4  32.6  65.7   5.4
    [MPLS: Lbl 288384 Exp 0 S 1 TTL 1]
10. 61.13.2da9.ip4.static.sl-reverse.com               30.1%    73  242.4 244.3 242.3 254.7   2.6
    [MPLS: Lbl 423005 Exp 0 S 1 TTL 1]
11. af.13.2da9.ip4.static.sl-reverse.com                0.0%    73  242.3 244.1 241.8 257.6   3.7
    [MPLS: Lbl 499542 Exp 0 S 1 TTL 1]
12. cb.12.6132.ip4.static.sl-reverse.com                0.0%    73  242.8 244.1 242.5 254.5   2.5
13. po2.fcr01.sr03.sng01.networklayer.com              30.1%    73  261.2 277.6 260.8 547.7  52.5
14. sip3.nexmo.com                                      0.0%    73  242.4 243.4 242.1 258.0   2.5
Understanding forward vs return path
The path a packet takes between A and B is often not the same as the path it takes between B and A. So, if you were to ping a particular IP address then your ping (echo request) is likely to take a different path than the response (echo reply).
This means that when you use MTR or traceroute and see packet loss starting at a given hop, it is not necessarily that hop that is to blame. Imagine a trace that looks like the following:
You (Zen ISP) -> Zayo (A large transit ISP) -> Amazon Web Services (AWS)
In your trace, you see 40% packet loss somewhere near the edge of the AWS network. You don’t see any loss on Zen or Zayo… so the problem must be AWS, right?
Nope. AWS might have a different path to reach you from their network. Maybe it’s:
AWS -> NTT (Another large transit ISP) -> You (Zen ISP).
Maybe your ping packet got to AWS and it was, in fact, the response packets that are getting lost somewhere inside NTT.
The only way to know for sure is to take a traceroute from both ends (that is, trace from you to the destination and again from the destination to your IP). This isn’t always possible if the destination is somebody else’s website.
In reality, in the above case, the problem is still AWS’s. They have a contract with NTT, NTT is broken, AWS needs to speak to NTT. In some other cases where settlement-free (that is, free of charge) peering is at play, such as on Internet Exchanges, this can be politically tricky as nobody has a contract or support agreement to fall back on when things don’t work.
Adapted from original post which appeared on Phil’s Blog.
Phil Lavin is a Systems/Telco Engineer, currently working for Vonage.
The views expressed by the authors of this blog are their own and do not necessarily reflect the views of APNIC. Please note a Code of Conduct applies to this blog.
You will see in the above MTR example that hop 8 (ae10.cs3.lhr11.uk.zip.zayo.com) has 88.2% packet loss.
Should be hop 6 I guess.
I would add that intermediate packet loss can be misleading, and merely reflect routers not processing TTL expiry quickly (e.g. – in hardware). For example, if have this:
+++++
HOST: localhost Loss% Snt Last Avg Best Wrst StDev
1. 63.247.74.43 0.0% 1000 0.3 0.6 0.3 1.2 0.3
2. 63.247.64.157 0.0% 1000 0.4 1.0 0.4 6.1 1.8
3. 209.51.130.213 60.0% 1000 0.8 2.7 0.8 19.0 5.7
4. aix.pr1.atl.google.com 0.0% 1000 6.7 6.8 6.7 6.9 0.1
5. 72.14.233.56 0.0% 10 7.2 8.3 7.1 16.4 2.9
6. 209.85.254.247 40.0% 1000 39.1 39.4 39.1 39.7 0.2
7. 64.233.174.46 0.0% 1000 39.6 40.4 39.4 46.9 2.3
8. gw-in-f147.1e100.net 0.0% 1000 39.6 40.5 39.5 46.7 2.2
+++++
we are doing fine – 1000 pings made it to the target. We could not have gotten 100% to the target if we were really losing 60% or 40% along the way.
Very helpful information. Thanks Phil.
Very interesting post. I’ve learned a lot.