

Deploying large-scale wireless infrastructure is challenging. Cellular service providers invest a huge amount of resources to deploy millions of base stations, providing ubiquitous coverage for users across many regions. One reason why this works — good service is provided for a cost, which users are willing to pay for.
Deployment of such infrastructure that supports Internet of Things (IoT) networks is slow, and this process often needs to be repeated with the onset of newer generations of wireless protocols.
The Helium Network — an exponentially growing IoT network — employs a different strategy; have users deploy base stations instead. The incentive behind this? Helium’s cryptocurrency, a Helium Network Token (HNT).
People purchase these base stations — otherwise known as gateways or hotspots — for about USD 400 each. These hotspots can then earn HNTs by:
- Ferrying data from devices that want to send data over this network.
- Providing coverage.
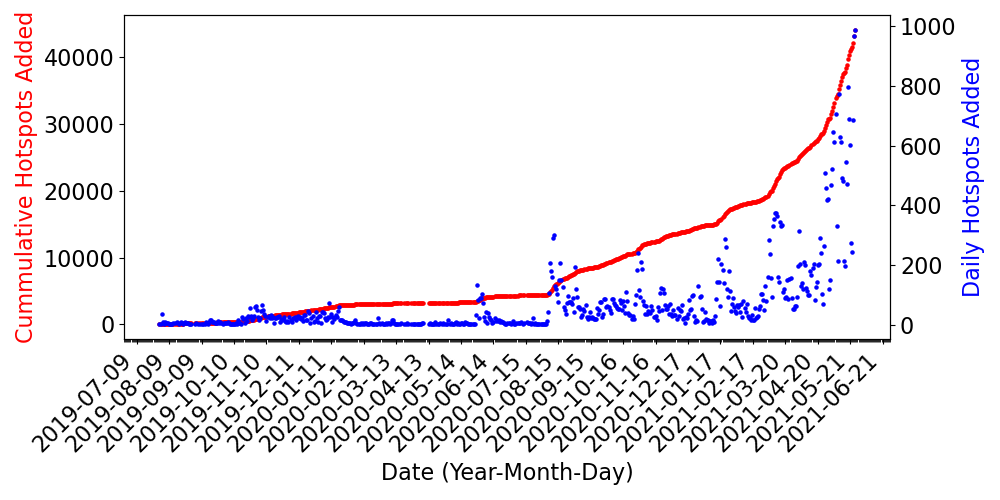
The first Helium hotspot was deployed in 2019. In March 2021, the number of connected hotspots was about 20,000. In November 2021, that number rose to 250,000 and now it’s at 400,000. More than 2,000 new hotspots are being added to this network every day. Clearly, something about the Helium Network is working, and the incentive strategy is piquing people’s interest.
This decentralized deployment strategy plays towards the benefit of Helium — rather than deploying millions of hotspots around the world, Helium invites millions of users to deploy one or two hotspots. No other decentralized network has achieved the scale that Helium has in such a short period. The success of robust and easily deployable wireless infrastructure carries the potential to enable Smart cities and a world of interconnected, embedded devices.
How does the Helium Network work?
There are four ‘components’ of the network, which route the data sent by users’ edge devices and allow them to recover the information for their applications:
- Edge devices.
- Hotspots or gateways.
- Helium routers.
- Endpoint applications.
Let’s start with a scenario by which a user wants to send information from their Helium compatible edge device and receive information through their end application.
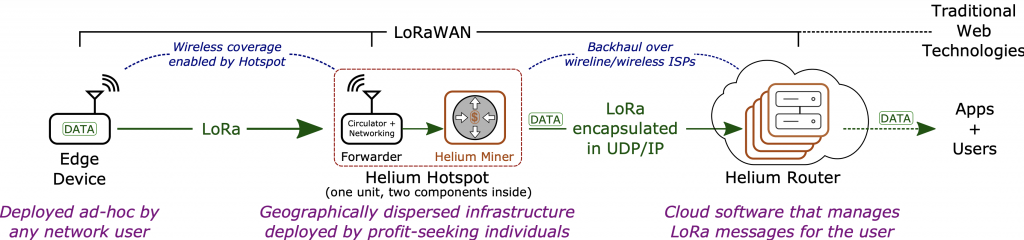
A user’s edge device might be a dog collar that can ping the location of their dog when the dog runs off and gets lost. The collar sends data to a Helium hotspot (or gateway) through the LoRa wireless protocol.
In a hotspot, there are two components: a forwarder and a miner. Forwarders right now are LoRa transceivers that receive the data from edge devices. This data is then forwarded to Helium routers (or servers) through the miners via a wired or wireless Internet connection.
Routers are responsible for authenticating and managing the devices on the network. Helium contains a public record of all hotspot transactions (for example, relocation assertions, proof of coverage challenges) that it maintains in its blockchain. Miners are responsible for carrying out all the activities to maintain this blockchain.
Hotspots don’t ferry this data for free though. For the data to make it to a Helium router, routers need to negotiate payments to the hotspots (in HNT) on behalf of the users for users to receive the data. Once hotspots have been paid for the data they want to send to Helium routers, the Helium router forwards the data, which then makes its way to an endpoint application set up by the user.
So, returning to the dog collar application, the collar might continuously send data to Helium hotspots through the LoRa protocol, which will then get forwarded to Helium routers after some payment transaction. Once that payment goes through, the data will make its way to a user’s end application.
What characteristics of Helium can we measure?
My colleagues and I at the University of California, San Diego recently presented a paper at IMC 2021 that sought to characterize the usage, patterns, and insights on the Helium Network.
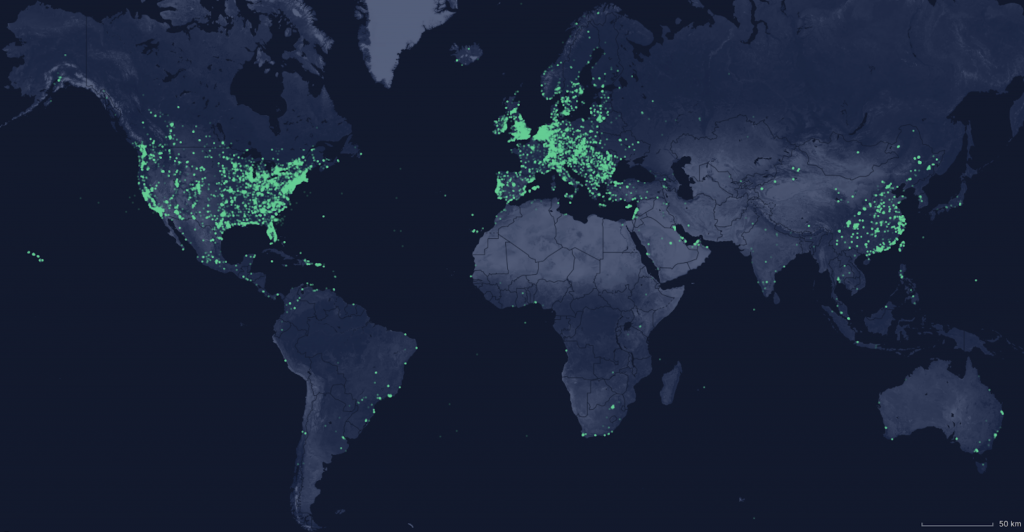
We found that hotspots are primarily deployed in the US, Europe, and China; hotspot location changes also indicate the majority of location changes are also between these three regions.
We found that most users only own one to two hotspots, hinting that the Helium Network isn’t managed by a few big players. However, we also found that while hotspot deployment and ownership is decentralized, backhauled data from hotspots to the Helium cloud can be centralized through ISPs. The data that is routed from hotspots to the Helium cloud servers still go through the Internet, and we found that many hotspots rely on major ISPs like Spectrum and Comcast.
Our initial findings also showed that over half of all connected hotspots are being relayed; this is due to some hotspots not being able to receive inbound connections because they are behind a firewall or Network Address Translation (NAT). This means that over 50% of all hotspots must rely on another hotspot to receive data, which is yet another point of dependency within the Helium Network.
In addition to our network analyses, we measured the reliability of the Helium Network and performed a real-world coverage analysis. Our first experiment included an edge device in the same room as a hotspot that attempted to continuously send data over multiple days. We found that the Packet Reception Ratio of this experiment was only 73% despite the proximity.
We then performed an outdoor experiment, as shown in Figure 4.
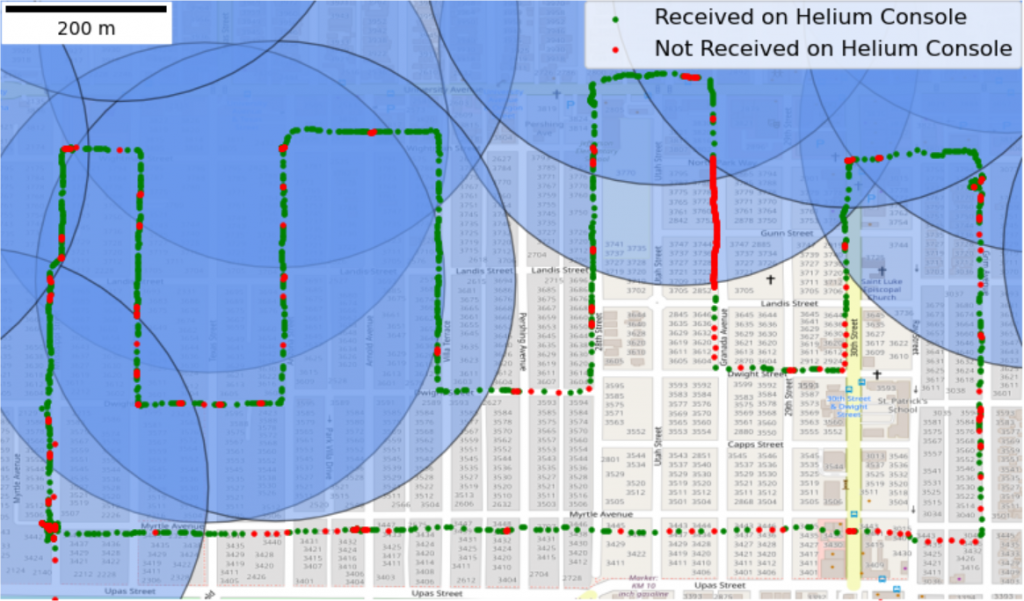
We walked a predetermined path while attempting to send packets to hotspots in the area. The green dots represent ACK’ed messages from the Helium Network, and the red dots represent NACK’ed messages. The big blue circles represent a basic 300 metre radius coverage model with the hotspots at the centre of each circle. The reasoning for this is derived from the Helium Improvement Proposal 15 (HIP 15), in which hotspots must be at least 300 metres apart to be valid witnesses (that is, to receive rewards for validating a hotspot’s actual location). We found that this basic model does not accurately represent the actual hotspot coverage, and we note a need for a more complex coverage model.
Our initial results attempt to measure the reliability of the Helium network, which will be conducted more thoroughly in our future work. To learn more, check out our IMC paper. Also, leave a comment if you’ve had any experience with the Helium Network.
As an extra note, the work in our paper wouldn’t have been possible without the help of our co-author Huanlei Wu, and advisors Pat Pannuto and Aaron Schulman.
Contributors: Dhananjay Jagtap.
Alex Yen is a PhD student at the University of California San Diego.
The views expressed by the authors of this blog are their own and do not necessarily reflect the views of APNIC. Please note a Code of Conduct applies to this blog.