

In part 1 of this series, I talked a bit about how encryption is shaping Network Performance Monitoring (NPM). Let’s dive in deeper.
Most NetOps and DevOps professionals today hear complaints about network performance when employees work from home. Unless the complaint is coming from all remote users of an application, individuals suffering from slowness are on their own to figure out how to optimize connection speeds. Users who have technical expertise to isolate the performance problem often admit there is nothing they can do to fix a sluggish connection.
Simple Network Management Protocol (SNMP) and packet capture will be used for many years to come to manage the on-premises network. These technologies, however, are generally not effective at trying to gain visibility into traffic patterns traversing the Internet. When it comes to the World Wide Web, we simply can’t put a packet analyser in every ISP in the path of a connection. We can’t telnet to the routers in the path because different companies in different economies own them. How then can we gain visibility into why a connection is slow for a given user?
Tools like Microsoft’s Packet Monitor (Pktmon) can be installed on work-from-home computers to regain packet visibility. But this doesn’t scale, and it is a reactive troubleshooting tactic. Ideally, we should stay proactive and uncover problems like brownouts before they surface as blackouts.
NPM must evolve
We have to think differently. In part 1 of this blog, I made the case that vendors such as Google and standards bodies such as the Internet Engineering Task Force (IETF) create the need to rethink how NPM solutions are designed and deployed. This means backing up a bit and thinking about the goal of optimizing network connections to make sure the applications we depend on stay responsive. By focusing on the goal, we start to think outside the box of traditional monitoring techniques. We must consider new ways of gaining performance insights.
What do we have access to that hasn’t changed and isn’t impacted by the IETF’s mission to stop pervasive monitoring?
- BGP monitoring and correlation with flow-based telemetry allow companies to gain clear visibility into how corporate and remote-user traffic is traversing the Internet. Using BGP, public IP addresses can be associated with a business’s Autonomous System, but this doesn’t always reveal the actual application (for example, AWS currently hosts Intuit’s TurboTax).
- By properly labelling interfaces (such as transit, public peer, backbone, and so on) and using flow data, traffic taking unoptimized paths can be identified and even rerouted.
- Locating synthetic monitors in the locations where an organization has a significant user base provides performance insights that most organizations have never had in the past. These tiny agents measure for latency, packet loss, jitter, and conduct traceroutes to identify hops and potential trouble spots in the path to cloud-hosted applications.
Synthetic testing as a recent advance in NPM
Synthetic testing is a more recent development in the NPM space and has the advantage of using synthetically generated traffic to measure connectivity performance to cloud offerings. Synthetic testing allows for deterministic performance measurement without involving actual user traffic. Although synthetics is considered a more recent advance in network monitoring, its root goes back several decades to protocols such as PING and traceroute.
Distributed network performance testing
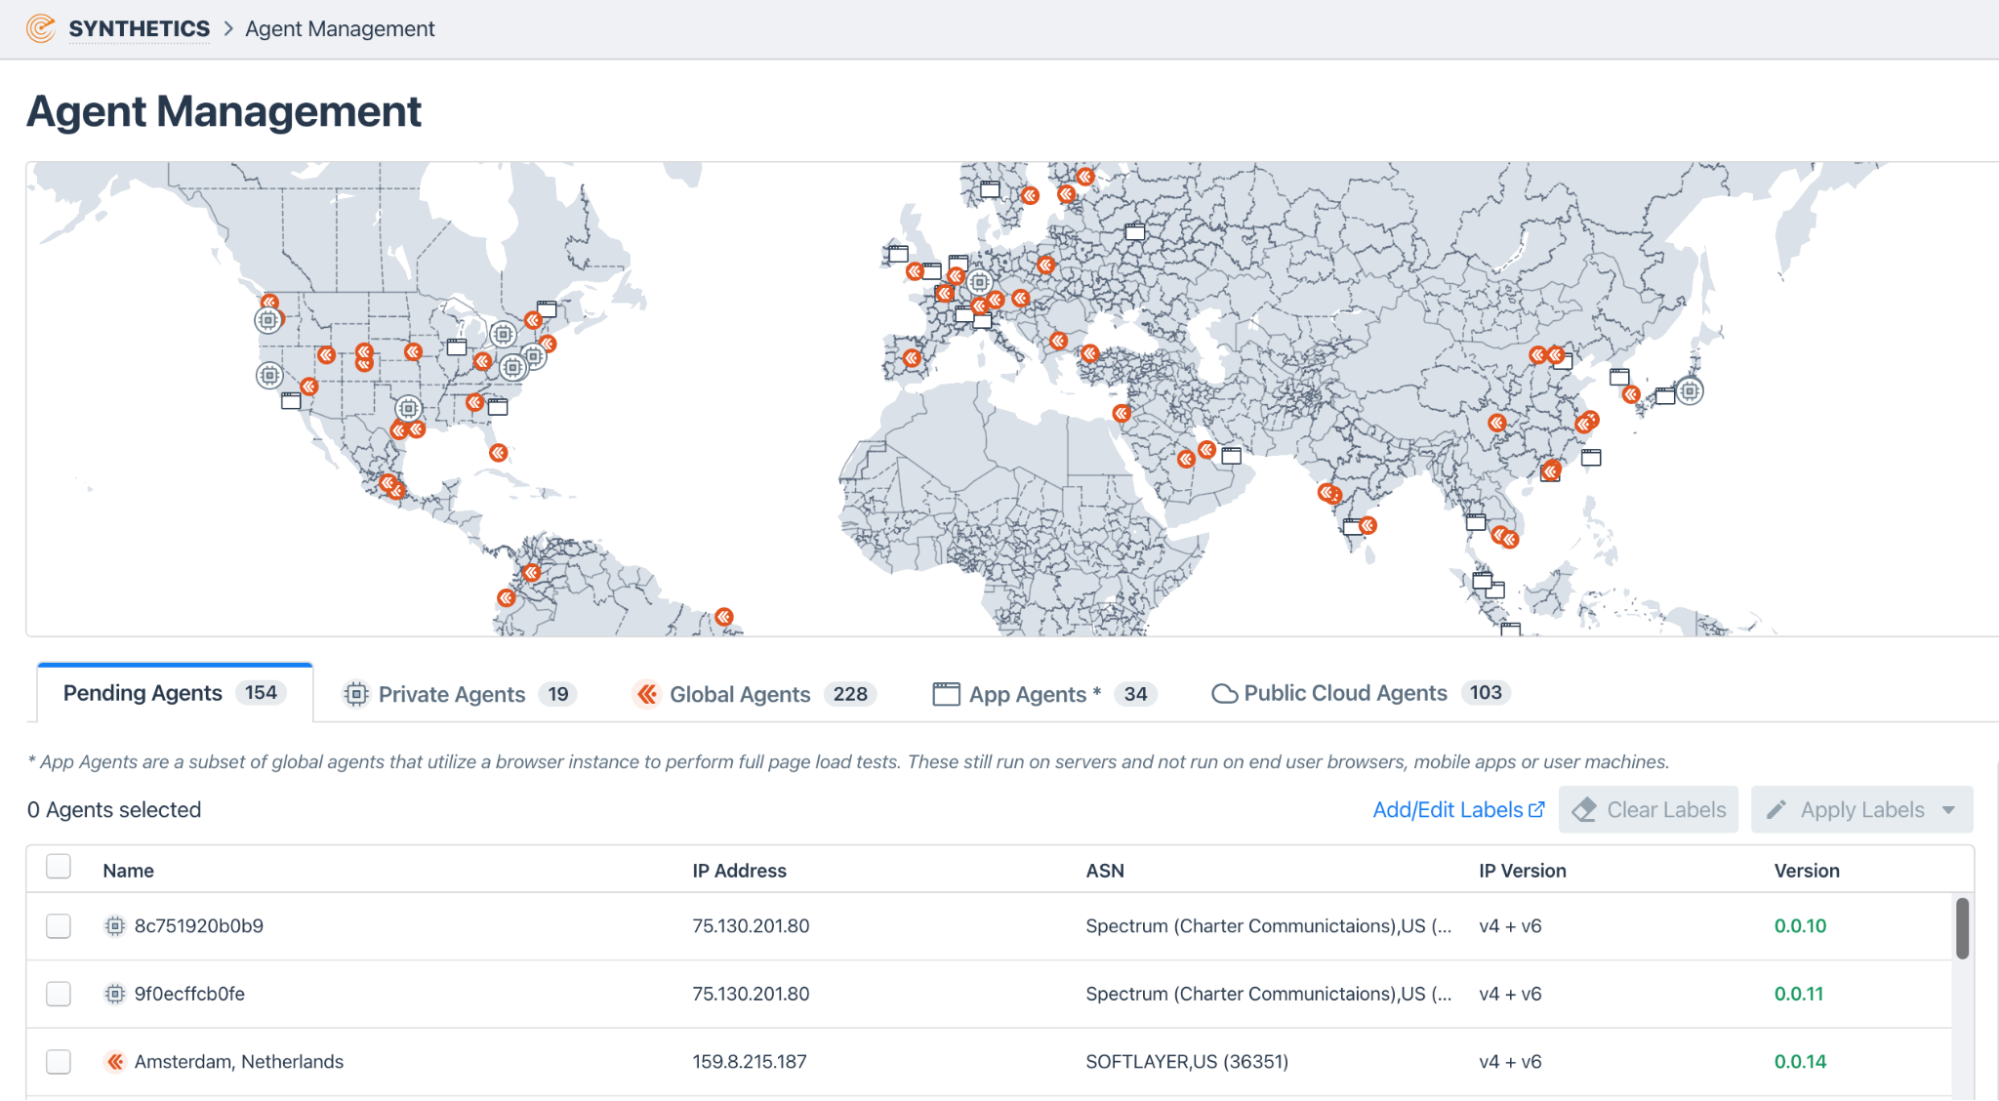
Below is an example of locating synthetic monitors everywhere that users are accessing business-critical applications. With this solution, multiple customers can share monitors securely, making it easy to bring additional viewpoints online.
API testing
Beyond the tests mentioned above, synthetics can also test APIs to verify availability and the response time of the applications employees connect to complete their work. The theory is that if the synthetic monitor has issues, then the end users in the same region are probably suffering. Customers are finding that this is precisely the case.
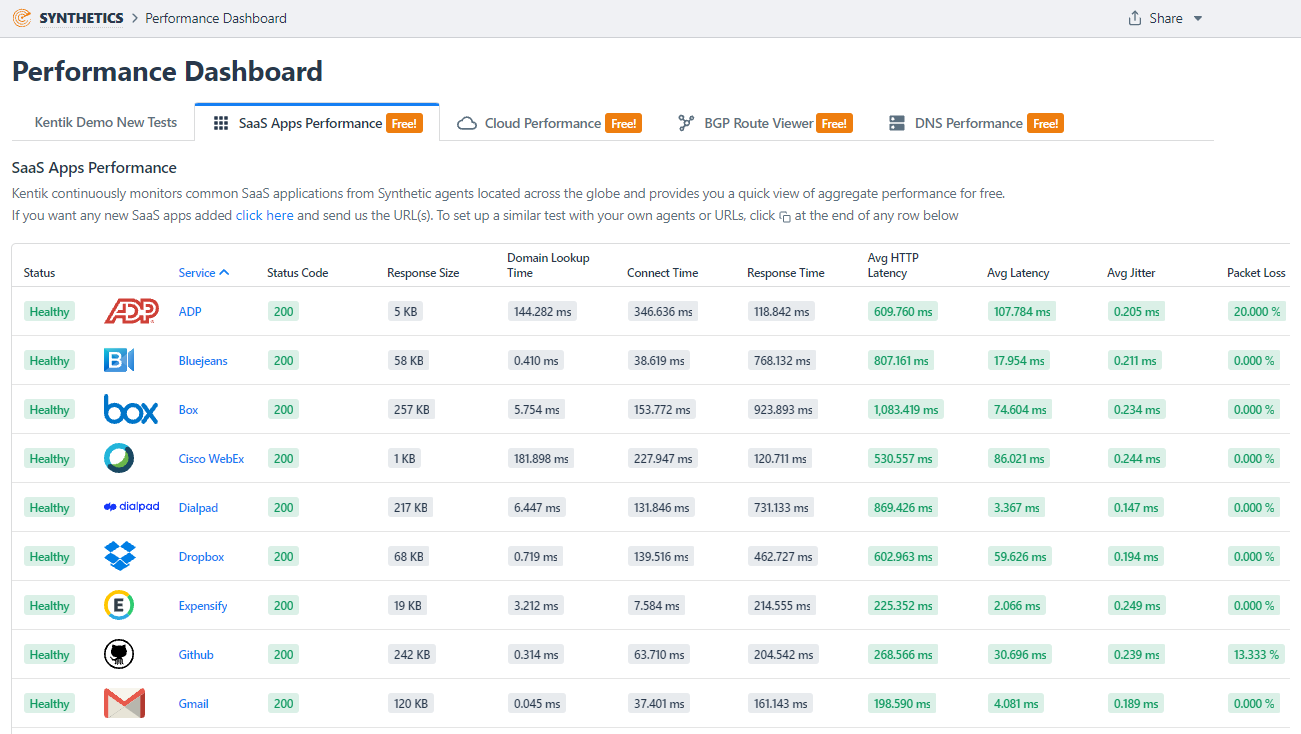
Below is an example of some of the Software as a Service (SaaS) applications that are actively monitored with synthetics. Drill in, of course, for further details such as historical trends.
Synthetics also perform traceroutes, allowing NetOps and DevOps to identify specific routers within service providers that are consistently causing problems. Contacting the service provider may help with rerouting connections around the trouble spot. If not, peering or new transit can be considered.
NPM wrap-up
Just as electricity eventually became much more reliable, so has network connectivity. Twenty years ago, we needed to constantly ping servers, switches and routers to make sure they were still up and running. Hardware and operating systems have since become much more reliable. With connectivity a lesser issue, today we need to focus on performance brownouts as they indicate the areas where we could eventually have blackouts.
It’s hard to let go of our traditional tools and familiar telemetry. This is why we need to focus on the goal — to optimize network connections and ensure the applications we depend on stay responsive. The use of synthetics stays in line with this objective.
If you’d like to learn more about how to get involved with an NPM solution that is evolving to overcome the challenges in today’s network traffic visibility space, reach out to our team for more information.
Michael Patterson is the founder and former CEO of Plixer. He now works as an advisor for Kentik.
This post was originally published on the Kentik Blog.
The views expressed by the authors of this blog are their own and do not necessarily reflect the views of APNIC. Please note a Code of Conduct applies to this blog.