
Capturing network traffic and extracting packet features allows operators and researchers to characterize traffic flows and related network services. Quantifying changes of flow characteristics, like flow duration, size, and flow rate supports network providers to plan, optimize, and better understand their users and service infrastructure.
My colleagues and I at the Technical University of Munich have recently conducted measurements on a long-term data set of Internet traffic captured between 2008 and 2019 provided by CAIDA to understand how flow characteristics changed over this time. Each of the analysed traces provided one hour of network traffic captured on Internet backbone links in Chicago (2008-2016) and New York (2018-2019) with a bandwidth of 10 Gbit/s. In total, we analysed 2.6 billion TCP flows.
This post builds on our recently published work that provides more technical details regarding our approach, data set, and results.
What characterizes a flow?
We determined flows based on the IP 5-Tuple, which consists of the sender’s and receiver’s IP addresses, ports, and the used transport protocol.
In cases where we observed an IP 5-Tuple not seen before, we started tracking a new flow. For our measurements, we only considered TCP flows for which we observed the 3-way handshake to avoid the impact of not fully captured flows. For example, a long-lived TCP flow might be characterized as a small flow if a capture only includes the end of that flow.
TCP terminates a connection with a teardown. However, if we did not observe the connection teardown but an idle time of five minutes, we assumed the flow had terminated.
For each flow, we defined three characteristics:
- Flow duration is measured as the time interval between the first and last packet of a flow.
- Flow size is the sum of the Layer 4 payload sizes of all packets of a flow.
- Flow rate refers to the average data rate of a flow, calculated as the fraction of size and duration.
Does every flow count?
No! As mentioned before, we focused on studying characteristics of TCP flows, as our measurements show that TCP transmits at least 80% of all bytes throughout our data set. More specifically, over 90% of all captured bytes rely on TCP for most traces.
Further, we were interested in the characteristics of data transmissions and the rates of such flows. Therefore, we filtered our data set for flows shorter than 100 milliseconds. Filtering short flows was motivated by removing single packet flows, with a duration of zero, making rate calculation unfeasible. The same applied to very short flows that potentially falsify flow rate calculations, as all packets might be sent back-to-back.
However, such filtering had little impact on the number of analysed bytes as the remaining flows carried over 99.9% of all bytes, while the share of ignored flows was 20% for traces captured in Chicago and 35% of flows captured in New York.
Heavy hitters — longer, bigger, faster?
Researchers have identified a group of flows that exceeds other flows in different characteristics. These flows are of interest as they use network infrastructure more intensively than other flows, for example, flows with a higher rate claiming larger shares of available network bandwidth. Such flows are referred to as heavy hitters, respectively Tortoise flows (long-lived), Elephant flows (big-sized), and Cheetah flows (fast).
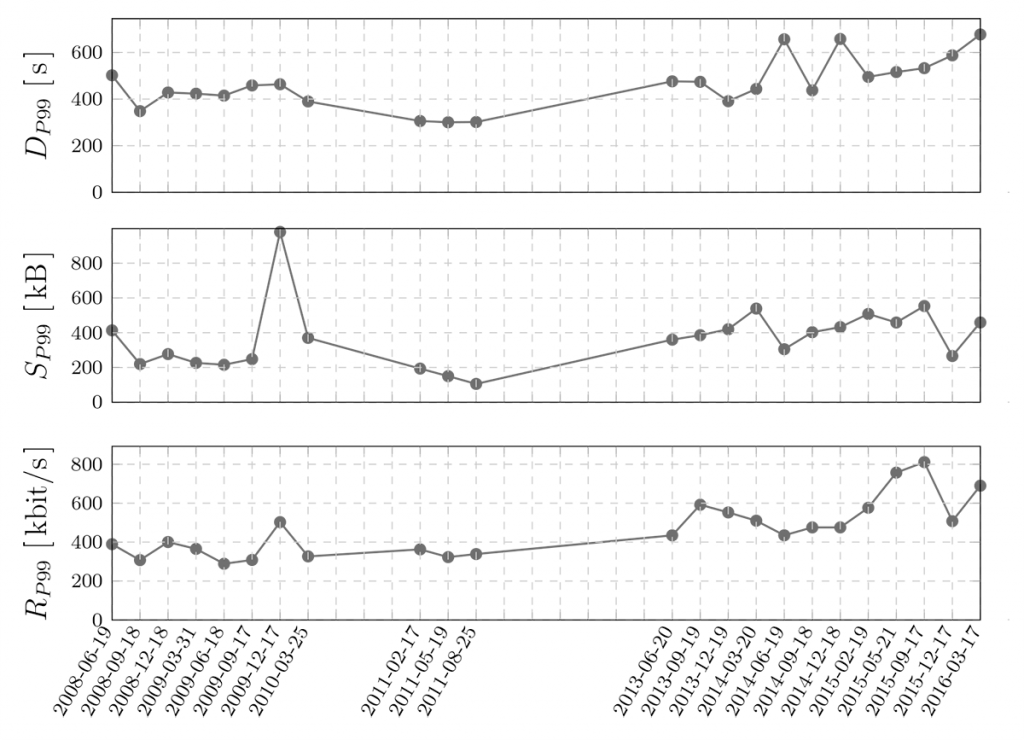
We determined heavy hitters by calculating the 99th percentile of a characteristic from all flows, that is, heavy hitters are flows that exceed the 99th percentile of duration, size, or rate. This definition of heavy hitters motivated us to survey the 99th percentiles of characteristics over time, revealing significant changes during our data set.
We observed an increase of the 99th percentiles of all three characteristics for traces captured in Chicago between 2008 and 2016 (Figure 1). The 99th percentile of flow duration increased by a factor of 1.5, the 99th percentile of size increased from around 200kB to 400kB, and the threshold for the fastest 1% of TCP flows nearly doubled.
Do these heavy hitters really matter?
Yes!
Calculating the shares of bytes transmitted by heavy hitters shows that such a small share of flows hold substantial shares of the data transmitted in total.
For example, on average, nearly 90% of all bytes transmitted by TCP are transmitted by flows within the 99th percentile of flow size. Further, over 55% of traces captured in Chicago, are transmitted by the 1% of fastest flows. For traces captured in New York, we measured an even higher share of 68%.
The disproportionate relationship between the share of flows and transmitted bytes becomes evident when looking at intersections of heavy hitters of different characteristics, as shown in Table 1. We found that the set of flows within all three 99th percentiles still carried around 20% of bytes, respectively; over 30% for traces captured in New York.
| Flows in | Share of flows (Chicago) | Share of bytes (Chicago) | Share of flows (NY) | Share of bytes (NY) |
| DP99 | 1.000% | 40.5% | 1.000% | 43.1 % |
| SP99 | 1.000% | 89.2% | 1.000% | 88.4 % |
| RP99 | 1.000% | 55.9% | 1.000% | 68.0 % |
| DP99∩SP99 | 0.185% | 39.9% | 0.142% | 42.6 % |
| DP99∩RP99 | 0.009% | 19.9% | 0.005% | 31.4 % |
| SP99∩RP99 | 0.337% | 54.8% | 0.332% | 67.2 % |
| DP99∩SP99∩RP99 | 0.009% | 19.9% | 0.005% | 31.4 % |
Table 1 — Share of bytes transmitted by flows in the intersections of 99th percentiles.
The rise of big and fast flows
Next to the definition of heavy hitters based on the 99th percentiles, we also surveyed the relevance of so-called big-fast flows.
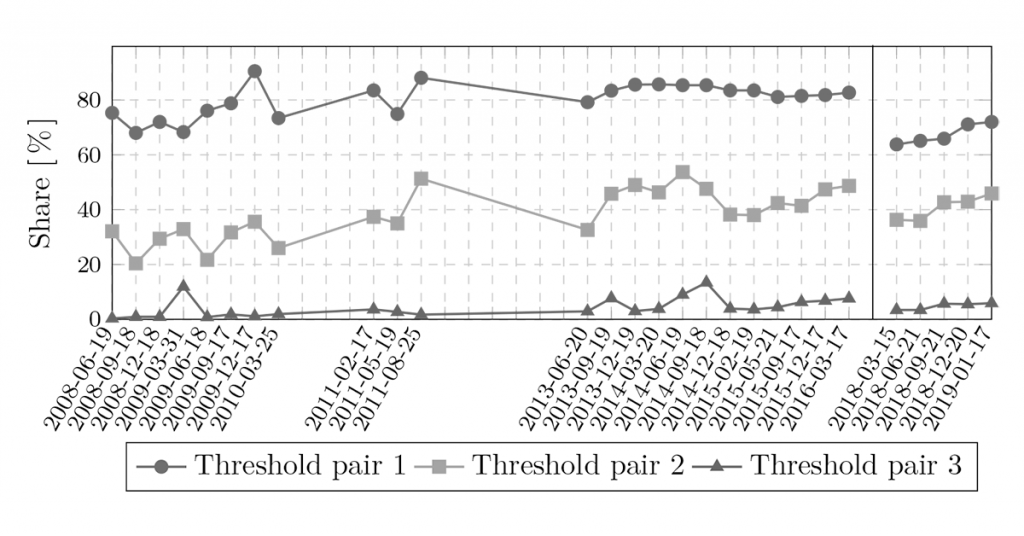
Threshold values can be selected arbitrarily, as they are not used as a statistical measure but for comparing a set of flows. In our case, we compared the share of flows and bytes transmitted by big-fast flows over time. We defined three pairs of threshold values: 100kB and 10kB/s (Threshold pair 1); 1MB and 100kB/s (Threshold pair 2); and 10MB and 1MB/s (Threshold pair 3).
According to the first threshold pair, big-fast flows carry between 70% up to over 80% of bytes for traces captured in Chicago. The second threshold pair results in a more significant change of the relevance of big-fast flows from around 30% up to over 50%.
The share of big-fast flows is relatively small, with 2% of flows for the first threshold value pair and far less than 0.5% for the second and third threshold pair.
Interested in the characteristics of flows passing your network?
Well you can analyse them for yourself!
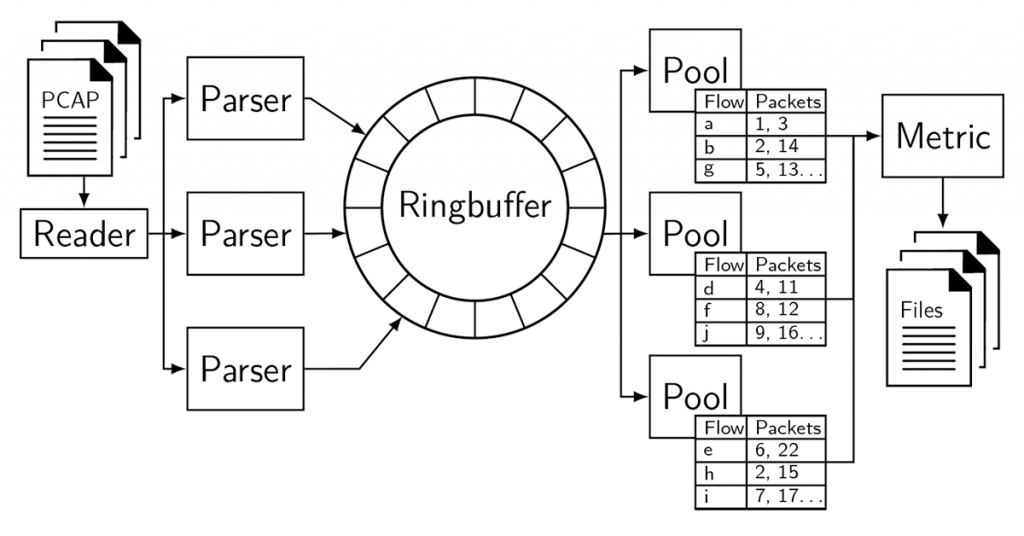
Together with our paper, we published a highly scalable and easy to extend flow analyser as free and open-source. The analyser, written in Go, provides fully parallelized packet parsing and aggregation of flow characteristics. So far, the analyser expects captured traffic as PCAPs, while the used GoPacket library also is capable of online packet processing.
Find further details in our paper!
Simon Bauer is a PhD student at the Chair of Network Architectures and Services at the Technical University of Munich.
The views expressed by the authors of this blog are their own and do not necessarily reflect the views of APNIC. Please note a Code of Conduct applies to this blog.
Nice Job!