

2020 presented an enormous learning curve for network operators. Demands for Internet usage surged at a time when lockdowns, travel restrictions and stay-at-home orders posed new logistical challenges.
So, how did the Asia Pacific region respond? What were the trends, and what did the data show us?
In my presentation at APRICOT 2021 (APOPS 2), I explored connectivity trends in the Asia Pacific from three key angles:
- Internet bandwidth trends
- Co-location and on-ramps
- IP transit pricing trends
First and foremost, it was important to get an idea of how Internet deployment had been disrupted given the impacts of COVID-19. In Oceania, in particular, COVID-19 appears to have accelerated bandwidth growth.
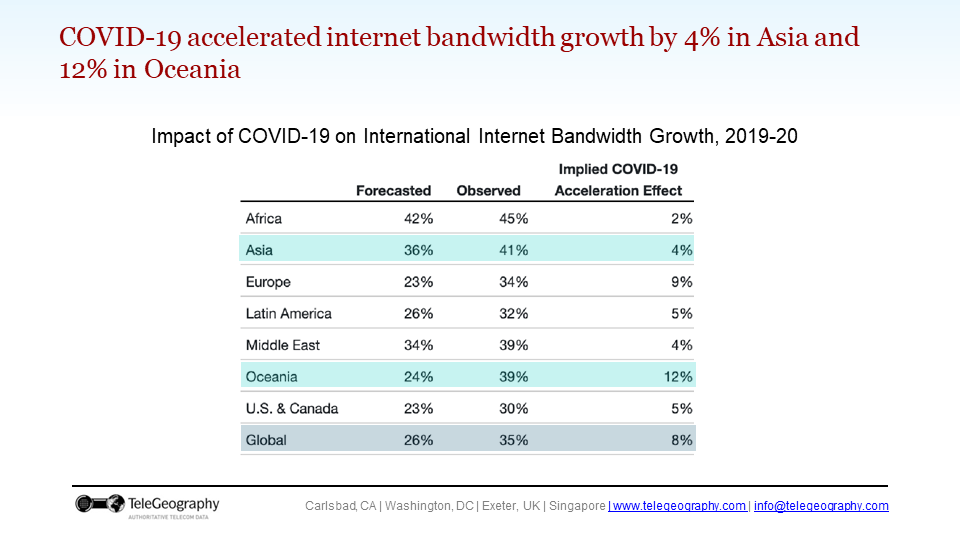
It’s important to keep in mind that international bandwidth was going to grow anyway, even if the pandemic had not occurred. The Asia Pacific had seen consistent growth in recent years in terms of its international bandwidth usage — we expected Asia to experience 36% growth, and Oceania to experience 24% growth. The 2020 growth in bandwidth accelerated by COVID-19, then, could imply that there was an additional amount of bandwidth added by operators to cope with the unplanned surge in traffic.
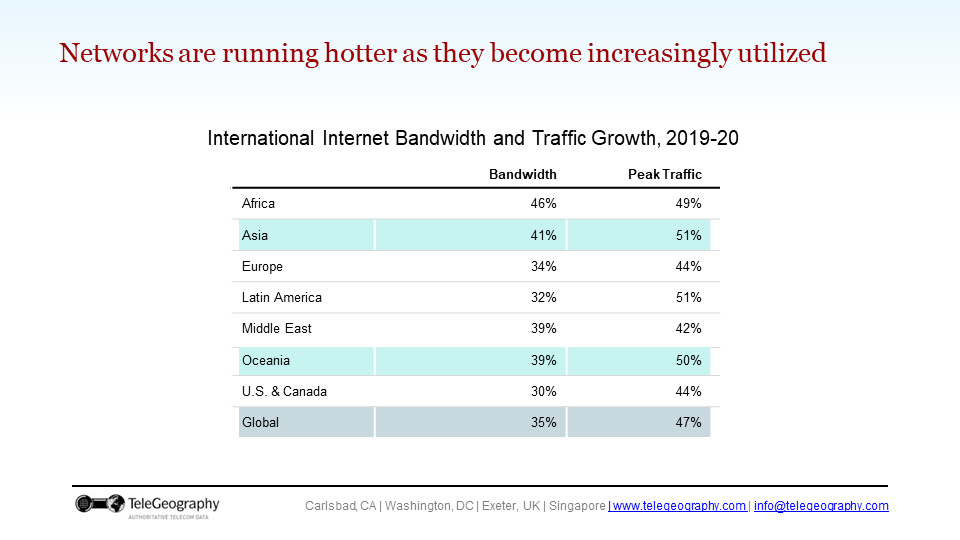
The rapid growth in bandwidth also meant networks were suddenly running hotter.
Although bandwidth growth accelerated, it does not necessarily mean the growth was sufficient to meet traffic surges. In 2020, we saw that peak traffic grew faster than bandwidth did. This means the utilization rates of networks increased. If operators seek to return their network utilization rates to pre-pandemic levels, we might expect even more bandwidth growth this year.
In 2020, Asia experienced the second-highest bandwidth-growth of any region, behind only Africa.
The figures also indicate that China (inclusive of Hong Kong), Japan and Singapore continued to act as the key Internet hubs in the Asia Pacific. At the city level, Singapore is by far the leader in both bandwidth usage and growth in the region.
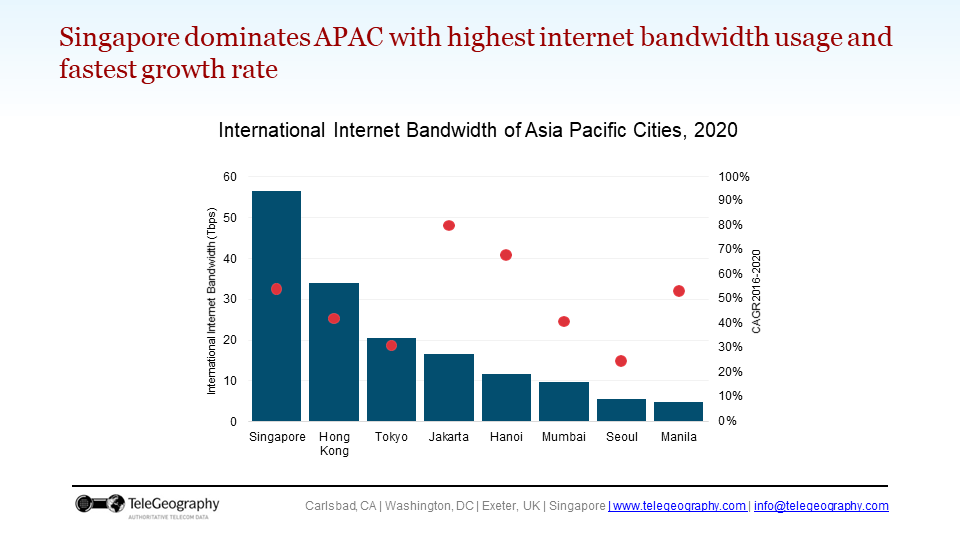
One way of understanding Singapore’s large size is that the economy has cemented itself as a major hub for traffic exchange and content hosting. It is also geographically situated nearby to many maturing South East Asian economies that have a growing demand for content.
One indicator of the Asia Pacific’s growth in 2020 can be clearly seen in this milestone: For the first time ever, an intra-Asian route overtook a trans-Pacific route in terms of traffic.
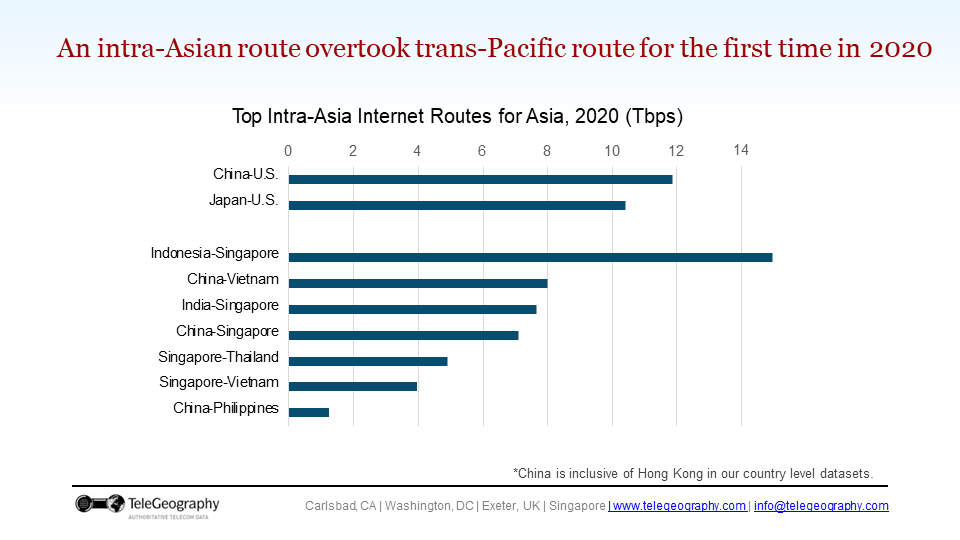
Indonesia tops the chart as the fastest growing economy in the Asia Pacific in terms of international Internet bandwidth demand. Its compounded growth rate in the past five years was an astonishing 80%. Its route to Singapore — its proximate neighbouring hub — has thus also grown dramatically.
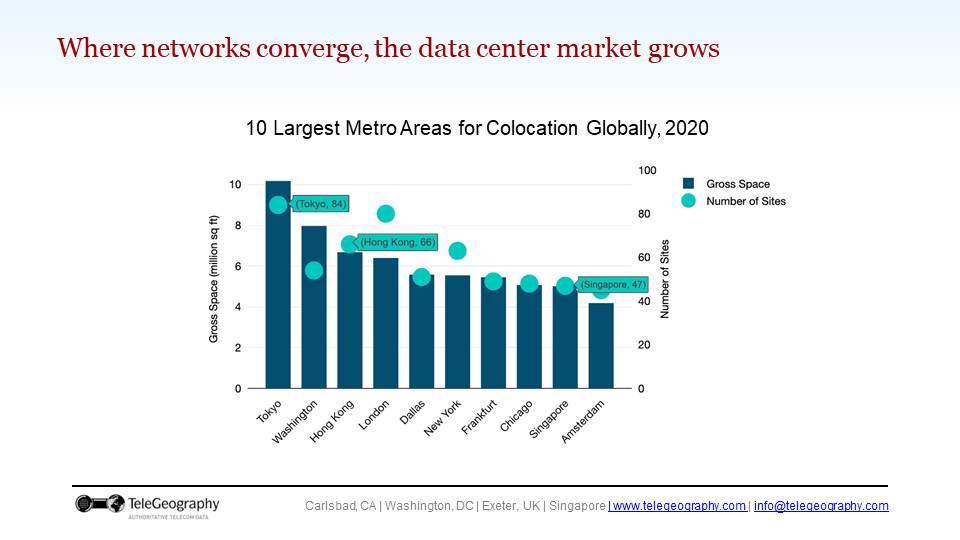
We can also see how areas with multiple converging networks were the most fertile grounds for new data centres.
And, of course, the growth in bandwidth is having impacts on prices throughout the region.
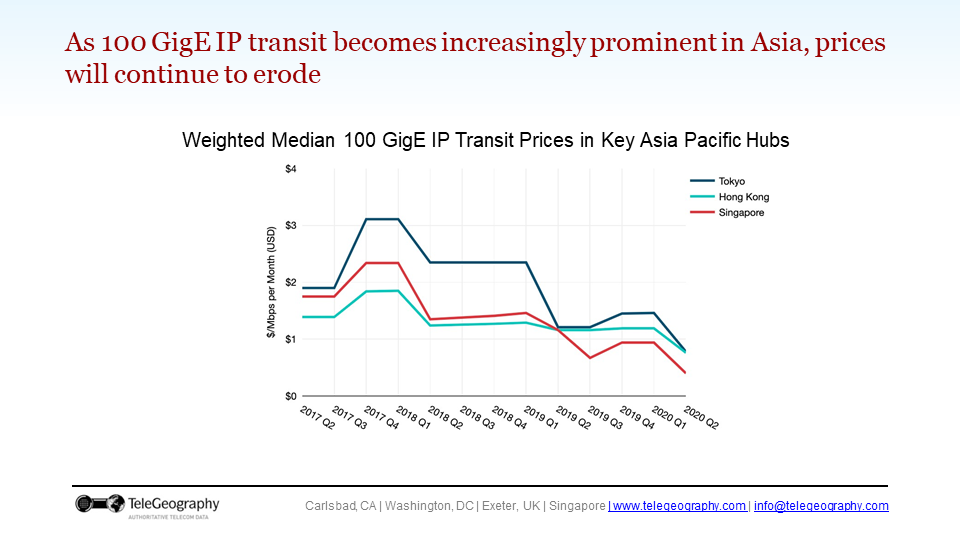
As the three cities with the highest usage (Singapore, Hong Kong, and Tokyo) act as the region’s hubs for traffic exchange and content hosting, the prices in their markets are also extremely competitive.
It is in these cities integral to regional traffic exchange, that we see higher capacity IP transit services gaining more traction. As a larger number of carriers deploy 100 Gbps technology across their IP networks and the premium associated with 100 GigE card costs continue to decline, we expect prices will continue to erode.
A few concluding remarks to consider what’s next for the region’s network:
- Thus far, Asia Pacific carriers have managed to cope with COVID-19’s impact by employing a wide variety of measures. The rate of traffic acceleration shows signs of moderating, but new capacity will continue to be needed.
- Hong Kong, Singapore, and Tokyo will remain dominant hubs, but there is an increasing focus on developing secondary hubs in the region.
- The postponement of several subsea cables to Hong Kong is leading providers to focus on alternative trans-Pacific routes, but new intra-Asian cables to the city are still planned.
- Price erosion remains constant and within our expected bounds, suggesting that COVID-19 has thus far not caused disruption to pricing schemes.
You can catch the full presentation as part of the APOPS 2 session in the video below, or via this link at around 42 minutes.
Shermaine Yung is an APAC Research Analyst at Telegeography.
The views expressed by the authors of this blog are their own and do not necessarily reflect the views of APNIC. Please note a Code of Conduct applies to this blog.