
I’ve been deep in the domain of observability over the past year. I thought I should take a step back and try to explain some concepts of a project I’ve been working on, OpenTelemetry.
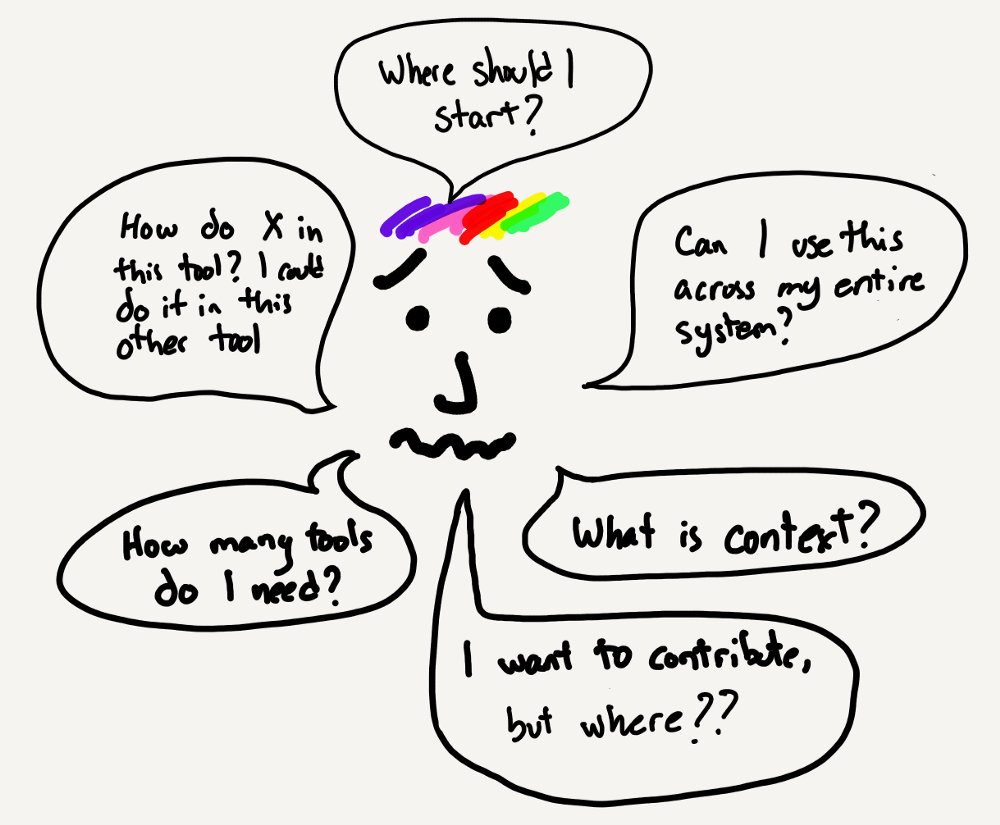
Figure 1 — This is what I feel I look like when explaining observability.
Before learning about OpenTelemetry, it’s helpful to know what the term observability means.
First, what is observability?
Observability is a field of software engineering focused on combining different methods and tools to help humans answer questions they have about their services. It gives people building and managing complex software a better understanding of their systems and how they behave.
Technology has become central to many aspects of our lives. We stream movies, order food through apps and video conference with our doctors. We access information within milliseconds all thanks to countless systems working together, occasionally flawlessly. This is supported by millions of people who maintain increasingly complex systems built to fulfil this demand.
For example, here is a simplified diagram of the systems that may be involved in you reading this article on your laptop right now:
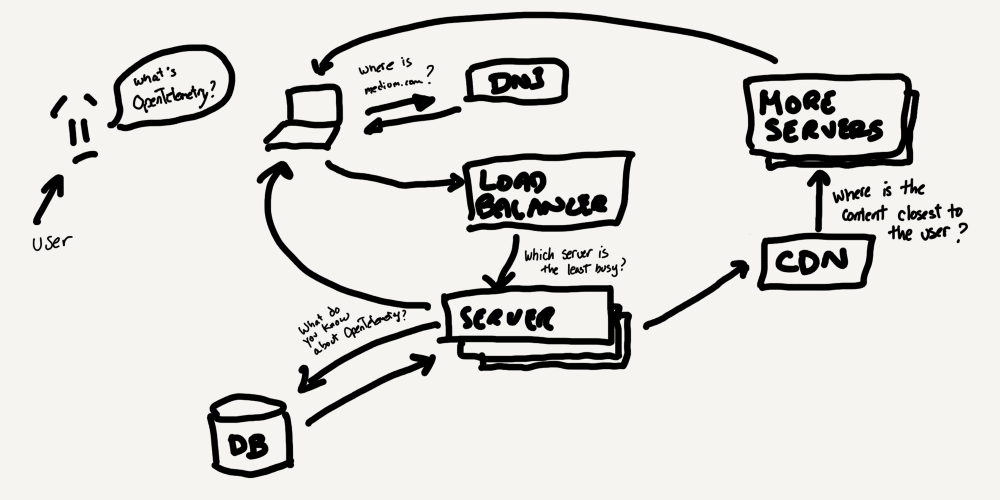
Looking at the diagram, we can see that the request to view this article required collaboration between multiple servers, as well as a database service, a Content Delivery Network (CDN), and a load balancer. This example is by no means a complex system by today’s standards. As you can imagine, identifying problems in a distributed system like this gets complicated pretty quickly. There are many points of failure to consider.
Without observability, system operators struggled to get to the bottom of issues with the limited tools at their disposal. Someone would complain about something not working or being slow. The distressed system administrator would then embark on a quest to find the issue. Sometimes, these quests would take hours or days, and often required assistance from many others along the way. Observability was born out of a need to make this process easier.
Let’s take a look at a few of the common practices that exist today to make systems easier to observe.
Collecting data about each application in a system
Information about the number of requests it’s fulfilling, the duration of time it took for a request to be fulfilled or if an application has triggered errors were collected. These metrics are then rendered in dashboards used in monitoring and alerting system operators.
Adding logs at certain key points in your application
A second common practice is to add logging to an application, traditionally when an error condition occurs. Examples of useful logs to collect would be an invalid request was sent to the server or the load balancer was too busy to respond to a request. These logs are often centralized, to make searching through them more easy.
Instrumenting code inside an application
A more recent development in observability has been to add code snippets in the applications themselves, also known as instrumenting. This allows context about a particular request to be carried through as it travels across different components in a system — this is known as distributed tracing.
So many tools, so little time
Ok, so now we have a rough idea of what observability is. Let’s take a look at how observability has been evolving and why it needs OpenTelemetry.
Over the past 10 to 15 years, many companies have come along to address the needs of engineers for more visibility. Each one came with its own set of tools and technologies, often very focused on a particular problem. Often, competing vendors used inconsistent words to identify the same concepts. How logs, metrics or traces were collected was often also vendor-specific. This meant that switching from one tool to another was difficult and time-consuming.
In 2016, an open-source project aiming at providing vendor-neutral instrumentation and Application Programming Interface (API) for distributed tracing was launched and OpenTracing was born. Then, in 2017, another open-source project came along, OpenCensus, which aimed to provide standard libraries to collect traces and metrics.
The two projects caused confusion and problems for users. Some libraries were only supported by one project or the other. There was no easy way to share information between them. This confusion then led to friction in the open-source communities maintaining the projects. Everyone was having a bad time.
There were clear signals that the software industry was looking for a solution, but the current state of things was very fragmented and utterly confusing.
Enter OpenTelemetry
This is finally where we get to OpenTelemetry. In May 2019, the OpenTracing and OpenCensus communities announced the merging of the two projects as a new project named OpenTelemetry.
So what is it? It’s an open-source project aiming to standardize how applications are instrumented, how telemetry data (traces, metrics and logs) is collected, and how that data is transmitted. The work behind OpenTelemetry is a collaboration among 185+ organizations and has involved thousands of individuals.
Standardizing instrumentation
The initial work in OpenTelemetry has been to create a specification around the different components of telemetry. This guides how the implementation of the specification should behave, and it also documents expectations for users. This ensures that any implementation of OpenTelemetry should work the same way.
The standardization goes beyond the specification, by also organizing communities in different languages. So far, there are groups in ten different languages implementing OpenTelemetry APIs and SDKs, with no doubt more to come. Contributors include vendors as well as individual contributors.
OpenTelemetry Protocol (OTLP)
Once you have all this data, you need a way to send it somewhere. This is why the OpenTelemetry protocol was developed. The initial goals behind the protocol were to provide a highly reliable and high-performance transport mechanism for the data. The protocol is implemented using protocol buffers, which provides a language-agnostic definition, as well as the tools to generate code in any languages that support protobufs.
Collector
The last component of OpenTelemetry that I’ll cover here is the collector. It serves as a point of collection of OpenTelemetry data. The collector can receive data in various formats through its receivers. The data can then be processed before being exported to observability backends via the exporter interface. The exporters also support multiple data formats, and the collector can be configured to send data to multiple backends at the same time or to send traces to one backend and metrics to another. The term backend, as used here, describes a system that provides analytics and storing capabilities for telemetry.

OpenTelemetry is a project fast approaching its first release, and I for one, am a firm believer that this project will change the world of observability for the better; reducing on-call stress significantly and increasing all around happiness for all.
Additional resources
- Official project website
- OpenTelemetry Blog
- OpenTelemetry Docs from Lightstep
Adapted from original post which appeared on Medium.
Alex Boten is a software problems solver and aspiring writer.
The views expressed by the authors of this blog are their own and do not necessarily reflect the views of APNIC. Please note a Code of Conduct applies to this blog.