
Packet capture tools regularly have problems with performance. The three tasks of reading packets from network interfaces, doing any needed processing, and sending results to disk/screen may seem like tame things to do, but they’re asked to do this to millions of packets per second.
We want to share some of the most common techniques that help packet capture programs keep up with the load. To illustrate them, we’ll show how to actually use these techniques with three common packet capture tools; Tcpdump, Zeek, and Wireshark. This is the first post in a three-part series — the other two will cover processing and output.
Measuring the problem
The operating system library used to make packet capture possible (libpcap on Linux and Mac, winpcap/Npcap on Windows) uses a shared data area to which it writes the packets (and from which the packet capture program reads them). Once the packet is retrieved by the packet capture tool, the space used by the packet is freed for use by another incoming packet. If the operating system is supplying packets faster than the capture tool is reading them, that space will fill up. When that happens and a new packet arrives, the oldest packet in that space is discarded and the library remembers this by incrementing a counter for each dropped packet.
When a packet capture tool is shut down it can poll libpcap for a number of statistics like ‘total number of packets received’ and ‘how many packets had to be discarded’ this way. If your capture tool is regularly unable to keep up, the loss might be anywhere from 5% to 90+% of the total packets received. If your tool reports this at shutdown, look to see if this loss is under 3% — probably acceptable — or over 5% — time to look for performance fixes.
tcpdump reports these statistics at shutdown; here’s the output when I pressed ctrl-c in a window running it:
8392934 packets captured
92990354 packets received by filter
10466 packets dropped by kernel
In this run, almost 93 million packets arrived on the network interface. Of those, around 8 million were considered interesting (the other ~85 million packets were not even handed to tcpdump for processing; see the ‘Filtering’ section below for how this is done). Just over 10 thousand were dropped — the kernel received them and put them where tcpdump could see them, but tcpdump couldn’t retrieve them in time and so they were never processed. In this example, 0.12% of the interesting packets were lost because tcpdump was running too slow. Had I not had that filter in place, tcpdump would have had to process more than 11 times as many packets, and would almost certainly not have been able to keep up with the flow.
Input
First, we’ll look at the data coming in from the network interfaces. In this discussion we’ll be talking just about capturing packets live. While there certainly can be performance problems with reading packets from a pcap file (file containing packets previously captured from a network interface), when that happens it just takes longer for the analysis to finish, as opposed to losing incoming data entirely.
Filtering
The first thing to note is that the Linux kernel (we’re assuming you’re using Linux; we’ll talk more about this in the third blog in this series ‘Choice of operating system’ section) is totally capable of keeping up with massive data streams (both lots of total bytes and lots of individual packets). The performance limitation is almost always in the program accepting these packets. For this reason, one of the most effective ways to handle heavy loads is to simply stop sending all packets to the capture program — just send the ones the program wants to inspect.
BPF
BPF, the Berkeley Packet Filter, is a way of describing the packets the program wishes to see. When we start up the sniffer we provide a block of text with this description, and the libpcap/winpcap/Npcap library only provides those packets to the sniffer.
For example, the dnstop program only wants to see DNS traffic going to or coming from UDP port 53. By default, it uses ‘udp port 53‘ as its filter. When it first starts and sets up sniffing, it tells the kernel to use that filter. From that point on the kernel will listen for incoming packets, but only hands up packets that are UDP and have 53 as their source or destination port.
This discards probably more than 95% of the packets that show up on the network, letting dnstop focus on just the ones that have dns requests and replies.
Building an ‘Include’ filter
All of these filters are (mostly) readable text like this:
udp port 53
To filter on more than one criteria, separate them with ‘and’ or ‘or. For example, to only inspect dns traffic to or from Google’s primary dns server, use this:
(host 8.8.8.8) and (port 53)
Note that I left off ‘udp’ there; BPF allows you to use just ‘port NN’ to include TCP or UDP port NN. I also surrounded the individual checks with parentheses; while they’re not needed in this simple example, it’s a good idea to get into the habit of using them. Some of the more complex ones are terribly difficult to get right without them.
Building a ‘Discard’ filter
Any network includes benign traffic, malicious traffic, and unknown traffic. When you’re working with a sniffer that deals in network security, it’s not possible to use the above approach to decide what to monitor; we can’t construct a BPF that would include just malicious and unknown traffic.
Instead, we turn the task around and discard some benign traffic. This lets the security tool focus on malicious and unknown traffic.
As an example, let’s say that this particular office has heavy file transfer traffic over ssh to five machines at a co-location site, and constant database replication between two postgresql servers. To discard this traffic, we’ll use:
not( (tcp port 22 and net 17.18.19) or (tcp port 5432 and host 10.0.0.8 and host 99.88.77.66) )
This filter asks the kernel to send up all traffic except: 1) ssh traffic to/from hosts whose IPs start with 17.18.19; and 2) postgresql traffic back and forth between one specific internal IP address and one specific external address. The parentheses allow us to group items together without worrying about whether and, or, or not takes precedence. The ‘not‘ at the beginning reverses the logic; without it we’d only see that ssh and postgresql traffic. With it, we see everything else.
By filtering this way we can drastically reduce the amount of traffic to process, allowing a sniffer program to keep up with all other traffic.
One thing to note is that you don’t have to characterize all of your benign traffic. Simply providing a filter that matches some of your heaviest traffic can reduce the load on your sniffer enough that it can keep up with the rest.
tcpdump
To include a filter like this, place it at the end of the tcpdump command line in single quotes, like:
tcpdump -i eth1 -qtnp 'udp port 53'
If you’re using windump (the version of tcpdump used on windows), use double quotes instead of single quotes, like:
windump -i 1 -qtnp "udp port 53"
Neither program uses a specific command line parameter in front of the BPF; it’s recognized because it’s the last item on the command line.
The quotes are important; they stop the command processor from interpreting some of the odder characters that are sometimes placed in these expressions, such as ‘&’.
Zeek
Find zeekctl.cfg on your system. If you’re having any trouble finding zeekctl.cfg, Linux includes a find command that may take a minute or two, but will locate it no matter where it is on the system:
sudo nice find / -name 'the_filename_you_want_to_find'
If you don’t already have a zeekargs line, add:
zeekargs=-f "udp port 53"
If you already have this line, merge your new filter into the existing one. Save, exit, and run the following:
sudo zeekctl deploy
Bro
(Bro is the old name for the Zeek sniffer. We cover Bro here separately from Zeek since the filename, line to add, and command to run are all different.)
Find broctl.cfg on your system (if you need to locate it, you can use the same file-searching technique referenced above). If you don’t already have a BroArgs line, add:
BroArgs=-f "udp port 53"
If you already have this line, merge your new filter into the existing one. Save, exit, and run this:
sudo broctl deploy
Wireshark
While capturing packets you can specify a BPF. Go to the Capture menu and select Options. The screen will look different, but there will be a box near the bottom where you can enter a filter to use:

Note that you can only use a BPF at capture time. To filter what’s displayed when Wireshark runs, you’ll need to use a Wireshark display filter.
Capturing less of the packet
Most sniffers will capture the entire packet by default — all of the headers and the entire packet contents. In some cases, they don’t need to — they can capture just the first part of the packet and discard the rest. This reduces the amount of memory needed, the amount of processing needed, and the amount of disk space needed if the packets are being saved to disk.
As an example, think about Etherape. It summarizes the traffic between all pairs of hosts by placing them in a ring on your display and drawing coloured lines between those whose size corresponds to how much traffic is currently flowing between them.
In order to do this, we obviously need the source and destination IP addresses, the protocol (TCP, UDP, other), and the total size of the packet — all of which live in the IP header. We also need the port numbers used in TCP and UDP packets, which are found in the TCP or UDP headers, respectively. To keep these headers and discard most of the packet payload, we should capture 96 bytes at the beginning of the packet (96 bytes should cover most cases, and while it will commonly include part of the payload, it’s still less than 1/15th of a 1,500-byte packet).
The commonly used name for ‘how many bytes to capture’ is ‘snaplen.
In addition to all the performance benefits, reducing the snaplen helps preserve privacy. You get what you need to do general analysis without capturing and saving the full contents of those conversations (though you will occasionally get a few bytes of user payload). This may help when you have policies concerning the privacy of communications on your network.
tcpdump
To tell tcpdump to only capture the first N bytes of a packet while sniffing, use the ‘-s’ parameter:
tcpdump -i eth0 -s96 -qtnp -w headers_only.pcap
When you later go back to look at or process the packets in that file, you’ll see that the IP, TCP, and UDP headers are there along with some of the payload, but most of the payload has been discarded.
Zeek
Zeek allows you to set the snaplen inside local.zeek (local.bro if you’re running Bro) with the following option:
redef Pcap::snaplen:96;
Wireshark
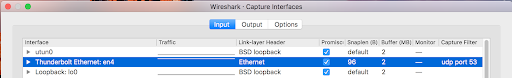
Go to the Capture menu and select Options. To the right of the interface on which you’ll listen, double click on the ‘default’ value in the ‘Snaplen (B)’ column and you can enter a new value for the number of bytes to capture:
Spreading packet streams to multiple capture boxes
If you’ve tuned the capture process as best as you can but still can’t keep up with the load, it may be necessary to: 1) Split the data stream into N parts; and 2) Clone your packet capture system N times, one for each part. Each clone then gets 1/Nth of the traffic, reducing its load to a manageable level.
The tool to split the data into multiple streams is a hardware or software load balancer. These are specialized routers/applications that not only split up the load but do so in a way that all packets that are part of a specific conversation stay together.
Here are some potential vendors to consider:
This blog post is is the first in a series of three entries and was adapted from a post on the Active Countermeasures blog.
Bill Stearns has been working in the network security community for decades, contributing open source software and training.
The views expressed by the authors of this blog are their own and do not necessarily reflect the views of APNIC. Please note a Code of Conduct applies to this blog.