

Booter services continue to provide popular DDoS-as-a-Service platforms and enable anyone (irrespective of their technical ability) to execute DDoS attacks with devastating impact. Since booters are a serious threat to Internet operations and can cause significant financial and reputational damage, they also draw the attention of Law Enforcement Agencies and related counter activities.
In this post, I’ll share the results of an investigation conducted by DE-CIX, BENOCS, the University of Twente, and Brandenburg University of Technology into booter-based Distributed Denial of Service (DDoS) attacks in the wild and the impact of an FBI takedown targeting 15 booter websites in December 2018.
We investigated and compared the attack properties of multiple booter services by launching DDoS attacks against our own infrastructure. To understand spatial and temporal trends of the DDoS traffic originating from booters, we scrutinized five months worth of inter-domain traffic.
Self-attack and DDoS traffic observations
We took a victim’s perspective to study the potential damage that booter-based DDoS attacks can directly cause to their targets and the collateral damage to Internet infrastructure caused by carrying attack traffic.
We did so by purchasing different services from four popular booters to attack our dedicated measurement infrastructure at an IXP between April and September 2018. This provided us with a unique picture of current booter service capabilities in the wild.
Figure 1 shows the results of ten self-attacks on our measurement platform from booter services.
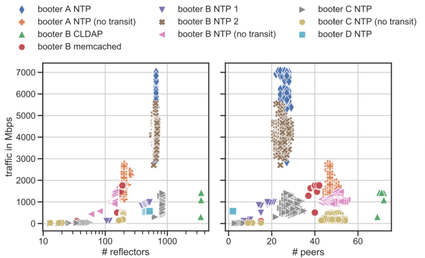
We learned that Network Time Protocol (NTP) amplification attacks are the most potent attacks delivered by the booters included in our tests. Depending on the protocol used for amplification, we observed that most booter attacks use between ∼100 and ∼1000 reflectors distributed over 20–55 peer ASes.
When we studied how the attack traffic is handed over to our AS, we learned that, for NTP, the majority of the traffic (80.81%) is delivered by our transit provider, whereas in our measurements for Memcached we experience almost the opposite, with 88.59% transferred via Internet Exchange Point (IXP) peering.
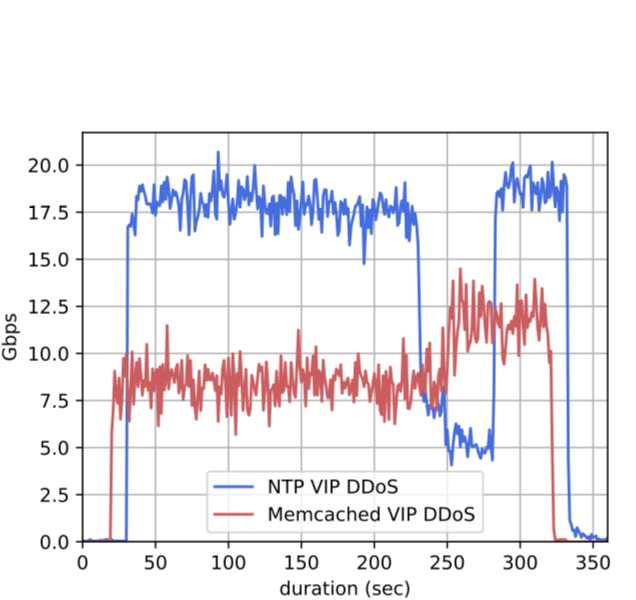
Booter services advertise higher-priced premium services. For our exemplary booter service, VIP offerings charge USD 178.84 compared to USD 19.83 and promise higher attack traffic rates of 80 – 100 Gbps instead of 8 –12 Gbps for non-VIP services. We validated this claim and launched two VIP attacks. Figure 2 shows that the NTP (blue line) and Memcached (red line) attacks generated traffic rates with a peak of about 20 Gbps and 10 Gbps, respectively. This is roughly 25% of the traffic rate compared to that which was advertised.
In Figure 3, we take a look at how the set of amplifiers within our self-attacks change over time and between different booter services.
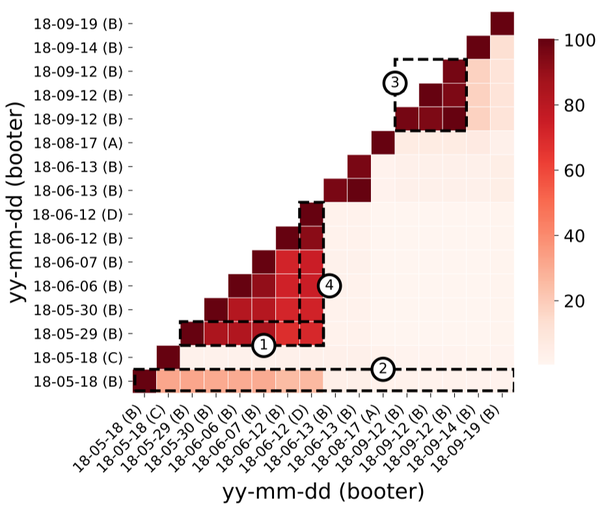
We found that:
- Amplifiers used by different booter services occasionally overlap ((4) booter D and B on 18-06-12).
- The same amplifiers are used in consecutive attacks, that is on the same day (3).
- The amplifiers used for one booter service have a moderate churn over short timeframes (1), but a high churn over longer timeframes (2). This suggests that booter services update their set of amplifiers from time to time to a new set.
Moreover, we noticed that the self-attacks with VIP and non-VIP services use the same set of reflectors. Therefore, the difference in attack traffic is generated by a higher packet rate towards the same amplifiers.
We observed that it’s impossible to identify specific booter services by using the insight on the used amplifiers from another point in time.
NTP amplification traffic and DDoS attacks in the wild
We also took a closer look at NTP DDoS amplification traffic at our vantage points: a Tier-1 ISP, a Tier-2 ISP and an IXP.
From our self attacks, we observed amplified NTP packets either 486 or 490 bytes in size (98.62% over all observed packets) due to NTP monlist requests. Figure 4 shows the distribution of NTP packet sizes at the IXP.

We observed an almost bimodal distribution of 54% of the NTP packets that are smaller than 200 bytes (likely benign traffic) and 46% that are larger (likely attack traffic). Thus, we define a threshold of 200 bytes as an optimistic classification criterion towards the detection of DDoS attack traffic.
By applying our classification, we found 36k destinations at the Tier-1 ISP within three weeks, 95k at the Tier-2 ISP over four and a half months and 244k destinations over three months at the IXP. Figure 5 shows the size of the traffic levels towards individual targets in combination with the number of unique NTP traffic sources.
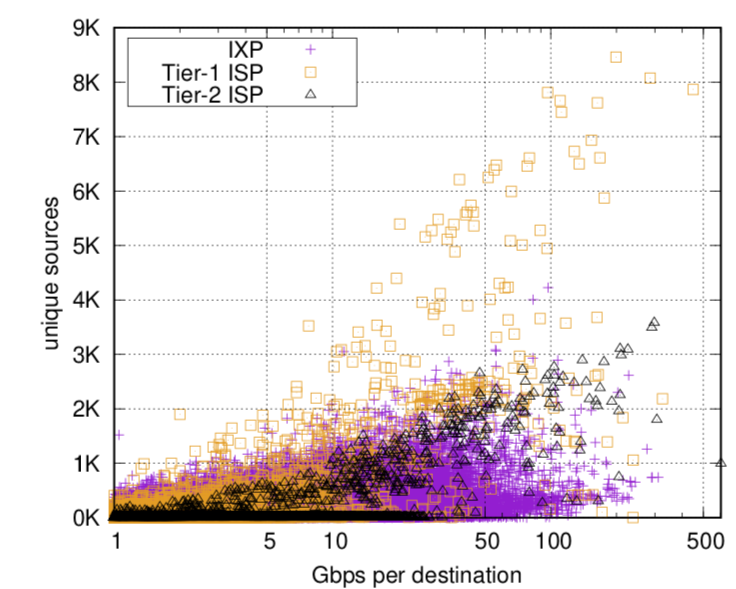
The majority of traffic rates are between 5 and 100 Gbps (avg 2.64 Gbps) and 224 victims received more than 100 Gbps. From our self-attack approach, we learned that in the case of NTP DDoS attacks, the traffic rates observed at the IXP are probably underestimated as most traffic within NTP attacks is not transmitted via the IXP.
Takedown of 15 booters and effects on inter-domain traffic
On 19 December 2018, the FBI seized the domains of 15 booter websites, including critical-boot.com and quantumstress.net. Smaller seizures of single booter domains had occurred previously, such as the seizure of web-stresser.org with more than 138k registered users by investigators in the US, UK and the Netherlands in 2018.
Beyond domain seizures, booter users and operators can face legal actions: the operator of Titanium Stresser was sentenced to two years in prison in 2017.
Within our study, we focused on answering the question: Did the takedown at the end of 2018 result in a significant reduction in DDoS attack traffic?
Domain perspective on takedown
Before we examined the traffic aspects of the takedown, we analysed the available booter domains. We observed the .com/.net/.org domains for over a year and identified booter websites by keyword matching. From this strategy, we identified 58 booter domains by manually visiting and verifying each domain matching the keyword search.
By observing the booter domains over time, we identified a new domain for a seized booter service that became active after the takedown and entered the global Alexa Top 1M list just three days after the seizure of their old domain. The new domain was already registered beforehand but remained unused until the takedown.
We learned that despite the seizure of fifteen domains, many alternative booter sites exist and seizing the front-end of booter services does not improve the situation for DDoS victims, as the underlying infrastructure of reflectors probably remains online and can be used without disruption.
Traffic perspective on takedown
For studying any effects on traffic patterns of the seizure of the fifteen booter services at our vantage points, we did a time series analysis, spanning 122 days over the seizure of the domains on 19 December 2018. We investigated any combination of suspicious protocol ports (NTP, Memcached, DNS, and so forth) as a source or destination port (to or from reflectors) for ingress and egress traffic.
The traffic patterns we observed show a correlation with the FBI seizure. We found significant reductions in DDoS traffic to possible DNS, NTP, and Memcached reflectors around the takedown operation (Figure 6).
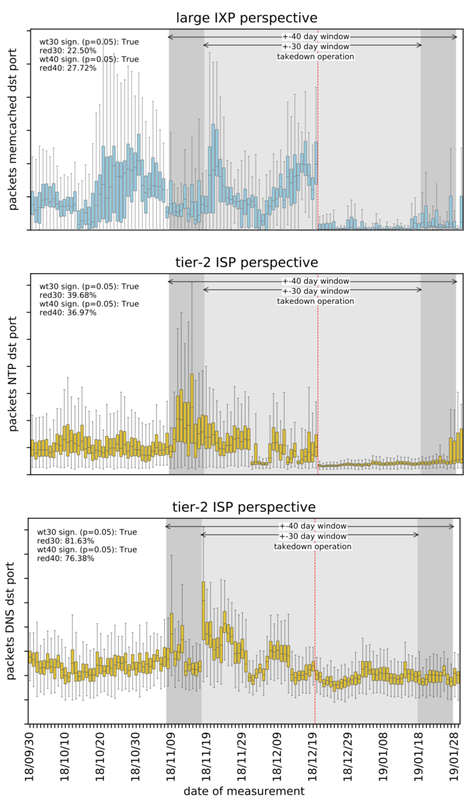
Nevertheless, we could not find any significant reduction in traffic from reflectors to victims.
To exclude false positives, we used more reliable filters for NTP DDoS learned from our self-attacks and measured the number of NTP DDoS attacks over time (Figure 7), which show no significant reduction after the takedown.
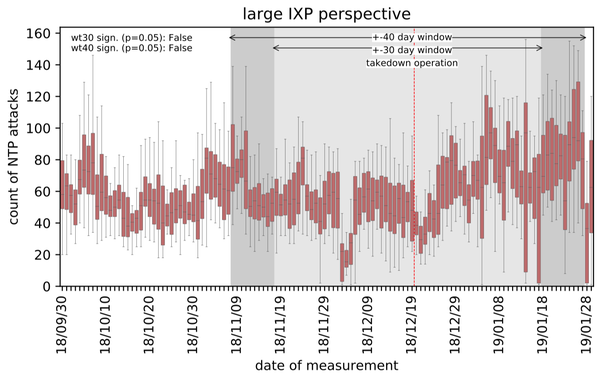
Again, we conclude that seizing the front-end of booter services does not improve the situation for DDoS victims, as the underlying infrastructure of reflectors remains online and can be used by third-parties without disruption.
Research can help law enforcement on booter economy
Our study aims to inform network operators to better understand the current threat-level and characteristics, but also for law enforcement agencies to recognize the need for additional efforts to shut down or mitigate open reflectors. Since our study is limited to technical parameters, the question arises whether this is sufficient to assess the health of the booter ecosystem. This motivates the need to better study the effects of law enforcement on the booter economy, which means on infrastructures, financing, or involved entities.
This research was presented at RIPE 80. The full paper was published at the ACM Internet Measurement Conference (IMC) 2019.
Contributors: Matthias Wichtlhuber, Ingmar Poese, Jair Santanna, Oliver Hohlfeld, Christoph Dietzel.
Adapted from original post which appeared on RIPE Labs.
Daniel Kopp is a member of the DE-CIX Research and Development team.
The views expressed by the authors of this blog are their own and do not necessarily reflect the views of APNIC. Please note a Code of Conduct applies to this blog.