

The Domain Name System (DNS) is an important component of the Internet and over the last 20 years or so, a great deal of attention has been directed at improving its inherently insecure aspects. This includes the deployment of DNS Security Extensions (DNSSEC) that enable cryptographic validation of DNS records, and more recently DNS-over-TLS and DNS-over-HTTPS which encrypt DNS transactions between hosts and resolvers.
The DNS, though, is also dependent on the global routing system for sending DNS queries from resolvers to servers and then returning the responses. The integrity of the routing system is extremely important for ensuring DNS transactions are delivered efficiently to the correct destination, yet few DNS registries are implementing Routing Public Key Infrastructure (RPKI) at present.
The Border Gateway Protocol (BGP) is the protocol used by the global routing system, yet has no built-in verification of whether IP prefixes announced on the Internet originate from their legitimate resource holders. RPKI is, therefore, designed to provide cryptographic verification of number resources (IPv4/IPv6 prefixes and Autonomous System Numbers (ASNs)) using Route Origin Authorizations (ROAs) that are attestations of BGP route announcements that an AS is actually authorized to announce the associate prefix(es).
ROAs allow BGP speakers to perform Route Origin Validation (ROVs) where incoming BGP advertisements can be cryptographically validated. As a result, invalid ROAs can be dropped or given a lower priority over valid ROAs, which has been adopted by several major ISPs around the world. This means it’s increasingly important to have valid ROAs for announcements, whilst safeguarding networks from possible hijacking and misdirection of traffic.
Deployment of RPKI at DNS registries
So how much deployment of Route Origin Authorizations (ROA), in terms of signing, is happening across DNS registries?
This blog post provides a look at observed deployment among the domain name Top Level Domain (TLD) registries (collectively the ccTLDs and gTLDs) and Regional Internet Registries (RIRs), as well as some dives into patterns of deployment.
What is measured is whether there is a valid ROA for a route origin (a BGP prefix plus a last-hop ASN) leading to an address for a nameserver serving a TLD and other zones it manages and the same for nameservers serving the top of the so-called reverse map run by the RIRs. For example, the name servers for “COM.,” “UK.,” “CO.UK.,” as well as “128.in-addr.arpa.” are included.
In the charts, there are counts of “zones” and “TLDs.” The count of TLDs is 1,780, comprising 1,201 gTLDs, 308 ccTLDs, and 271 reverse map zones. The count of Zones is 4,138, with the bulk of the difference from the count of TLDs being sub-ccTLD zones.
Overall adoption
Looking over 6,910 route origins for the TLDs and Reverse Map zones, 22% have a valid ROA (Figure 1).
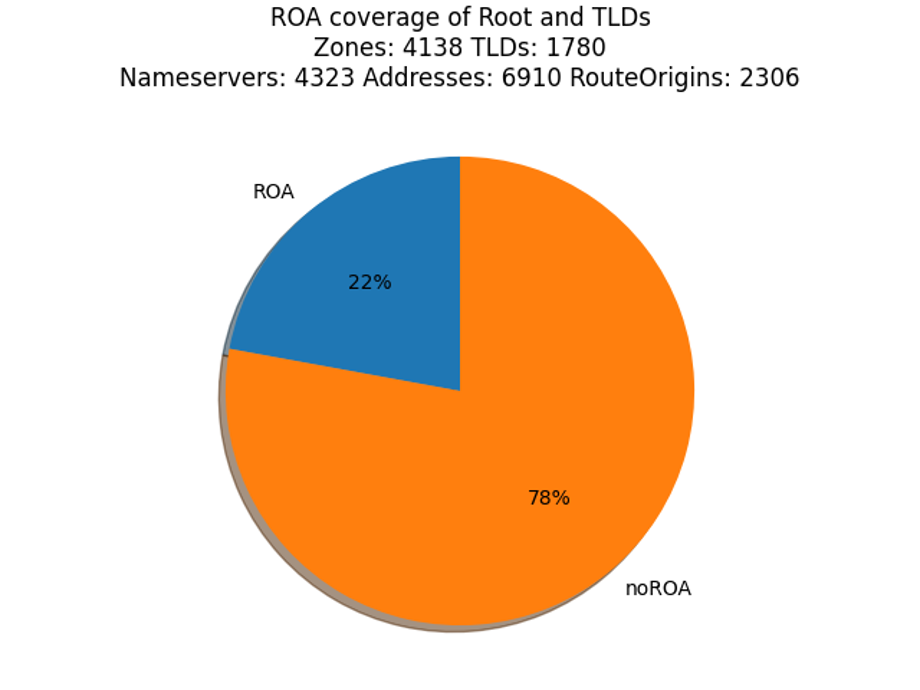
Two thoughts come to mind. First, with such a low adoption rate, can we look to identify where it has taken root and where it has not, maybe to give us hints on a future course? Second, the numbers of route origins (6,190) and nameservers (4,323) seem low compared to the count of TLDs and zones. Why is that?
The first thought suggests breaking down the data into categories. In this blog post, a few methods of categorizing the data are explored.
The second thought is roughly answered by “there is a lot of sharing happening”, such as many zones using the same set of nameservers, which suggests categorizing the data by service providers.
Adoption by IPv4/IPv6 address family
When looking at routing, the usual first step is to categorize by IPv4 or IPv6.
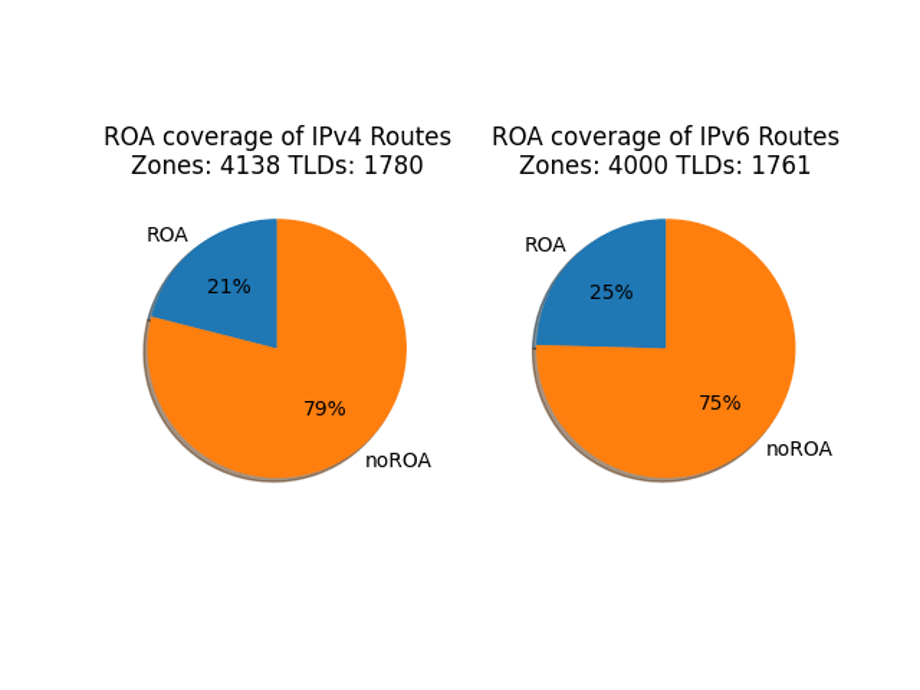
Dividing between IPv4 and IPv6 shows that the two address families are very similar, but not equal. It appears that routing managers treat IPv4 and IPv6 on par, which is encouraging to those who’ve been through an era where IPv6 was treated as something experimental.
But a closer look reveals that 19 TLDs do not have IPv6-addresses name servers (Figure 2)! This is seen in the count of TLDs above the two pie charts. (And that is an entirely different blog topic!)
Adoption by TLD “category”
When looking at behaviours of TLD zones, the first categorization is by the kind of zone.
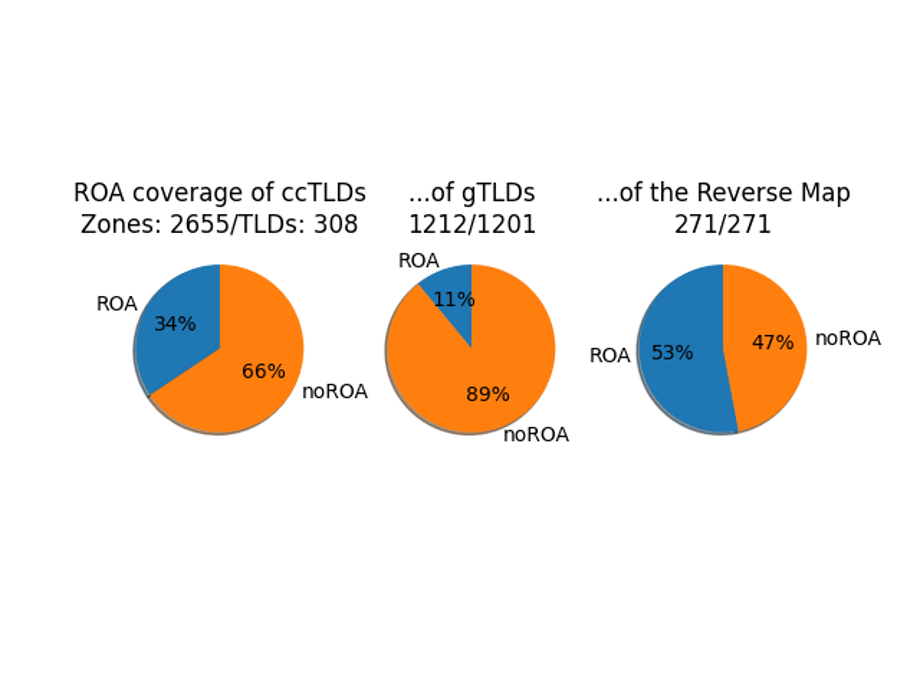
Dividing into the categories of ccTLDs, gTLDs, and the reverse map zones reveal differences in deployment (Figure 3). There are structural differences in the way each of these categories is operated, and it is very evident in these charts.
Distribution of deployment within a zone
For any particular zone, the routes leading to its nameservers are managed in very different ways. Some zone operators run all of their nameservers and have a uniform routing strategy, other zone operators outsource their DNS and therefore routing, still others trade services with other registries.
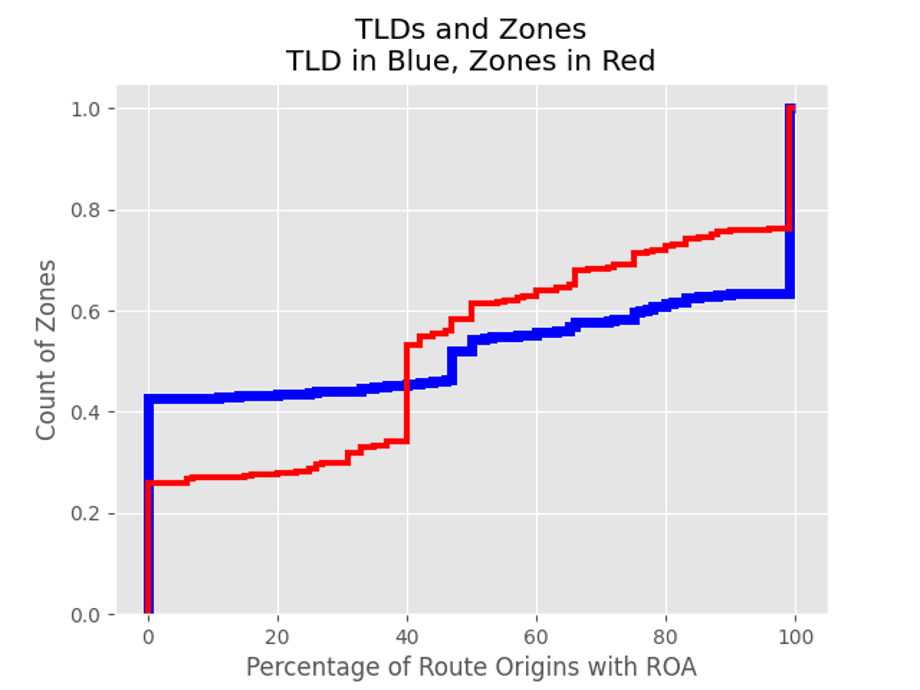
Figure 4 shows that about 40% of TLDs (in blue) have no ROA deployment and about 40% have full ROA deployment. The remaining 20% have varying levels. What this chart doesn’t reveal is the distribution of TLDs and zones across operators.
Categorizing by DNS Administrator, sorted by number of TLDs managed
Table 1 is generated by using the responsible name field in the Start of Authority DNS resource record and the name of the Technical Contact organization registered with the IANA Functions. The ordering of the table is from most TLDs managed downward.
| TLDs | ccTLDs | gTLDs | Rev Map | ROA Cover | Operator |
| 241 | 0 | 241 | 0 | 100% | hostmaster.donuts.co. |
| 209 | 3 | 206 | 0 | 14% | hostmaster.neustar.biz./support.ariservices.com. |
| 196 | 13 | 183 | 0 | 1% | noc.afilias-nst.info. |
| 154 | 2 | 52 | 0 | 0% | info.verisign-grs.com./nstld.verisign-grs.com. |
| 103 | 0 | 0 | 103 | 47% | dns-ops.arin.net. |
| 87 | 6 | 81 | 0 | 66% | hostmaster.centralnic.net./support.nic.coop. |
| 79 | 0 | 79 | 0 | 0% | hostmaster.nominet.org.uk. |
| 64 | 0 | 0 | 64 | 100% | dns.ripe.net. |
| 62 | 0 | 0 | 62 | 100% | read-txt-…-first-dns-admin.apnic.net. |
| 46 | 0 | 46 | 9 | 0% | cloud-dns-hostmaster.google.com. |
Table 1 — Categorizing by DNS Administrator, sorted by number of TLDs managed.
Only the top 10, by TLD count, are presented here. What the table reveals is that DNS administrators are operating many TLDs and “crossing the lines,” administering both gTLDs and ccTLDs. There is one example (not shown) of an administrator managing gTLDs, ccTLDs, and reverse map zones.
What we are looking for is any sort of pattern in the ROA Cover column, and there is nothing apparent. This suggests that the decision to deploy ROAs lies elsewhere, not directly with the DNS administrator.
Categorizing by AS, sorted by number of TLDs served
Table 2 highlights the routing layer supporting the studied zones. In this chart, rows for already listed operators are omitted, as indicated in the first column’s jump counting in the Row column. Only the first ten operators (not first 10 AS, or “AutNum”, numbers) are listed.
| Row | AutNum | TLDs | Prefixes | Addr | ROA Cover | Operator |
| 1 | 397238 | 618 | 29 | 658 | 13% | ULTRADNS, US |
| 12 | 42 | 347 | 34 | 234 | 64% | WOODYNET-1, US |
| 13 | 197000 | 289 | 2 | 80 | 100% | …RIPE NCC…, EU |
| 14 | 397197 | 257 | 13 | 13 | 0% | VRSN-AC28, US |
| 22 | 393225 | 252 | 2 | 4 | 100% | ARIN-PFS-IAD, US |
| 24 | 12041 | 219 | 541 | 1561 | 0% | AS-AFILIAS, US |
| 37 | 36625 | 151 | 2 | 2 | 0% | KGTLD, US |
| 38 | 28001 | 151 | 6 | 10 | 100% | LACNIC -…, UY |
| 39 | 8674 | 129 | 13 | 78 | 100% | NETNOD-IX…, SE |
| 41 | 18366 | 102 | 2 | 2 | 100% | APNIC-ANYCAST-AP…, AU |
Table 2 — Categorizing by AS, sorted by number of TLDs served.
There are two interesting points to this table.
- After the first two operators, the coverage is either 0% or 100%.
- There are two operators above that do not operate TLDs (as defined in the study), who are listed because they provide services to those that do.
Three notes should be made because this table is edited from the raw data.
- The 13% for ULTRADNS, US represents just the listed ASN; there are about a dozen unlisted ASNs for ULTRADNS with varying coverages.
- The names of the Operator originate from the RIR databases and some judgement was made to decide when dissimilar names were related if just to collapse the table for publishing.
- For the most part, the names are as registered, except for some word-wrapping editing done.
An ongoing effort
This blog post omits a lot of interesting analysis and data to keep this a reasonable length. The numbers presented are from an ongoing effort to measure and visualize the operations of the Internet.
Check out my presentation at APNIC 50 to learn more, and feel free to leave comments and questions below.
Adapted from original post which appeared on the MANRS Blog.
Edward Lewis is a Senior Technologist in ICANN’s Office of the CTO.
The views expressed by the authors of this blog are their own and do not necessarily reflect the views of APNIC. Please note a Code of Conduct applies to this blog.