

Worldwide, there are an estimated seven billion Internet of Things (IoT) devices connected to the Internet — a number which is expected to double in the next two years. These devices are deployed nearly everywhere, from public spaces to our workplaces, and even in the most private areas of our homes.
Typically, home IoT devices are exposed to or have access to sensitive, personal, and private information. For instance, smart speakers may listen to private conversations, doorbells or security cameras may record residents and guests without their knowledge or consent, and televisions may track our viewing habits.
It’s not just that these devices are exposed to sensitive information, it’s also due to the ‘I’ in IoT — all such devices can access the Internet and potentially share this type of information.
In this work, we at Northeastern University and Imperial College London sought to answer three questions:
- Where does the Internet traffic of IoT devices go to?
- Is such traffic protected from eavesdroppers via encryption?
- What are the potential privacy implications of this exposure?
Below is a summary of the findings from our research paper, which was presented at the ACM IMC 2019 conference in Amsterdam (also see Impressions from IMC 2019).
Measuring IoT privacy
IoT devices are very different from other devices, such as mobile phones. As such, there are no standard simulation tools or emulatiors or testbeds for testing them.
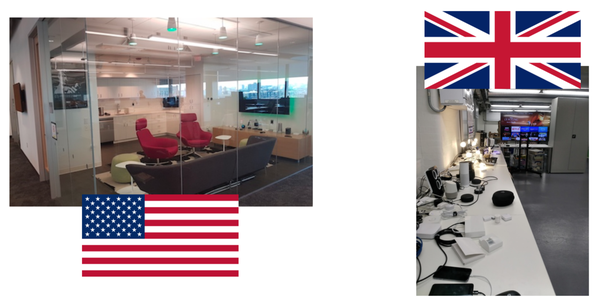
For this reason, we deployed two twin-testbeds in two regions. We also developed software (and made it publicly available) for automatically interacting with devices and collecting Internet traffic.
The first testbed, the Mon(IoT)r Lab, was built at Northeastern University (USA). It is designed to resemble a real studio apartment, where participants in a user study can access and interact with IoT devices freely. To understand if the devices behave in the same way in another region with different privacy regulations, we set up a second testbed at Imperial College (UK) with a similar set of IoT devices. We selected the devices among many categories and we bought those that were most popular on the market at the time — a total of 81 devices including cameras, smart hubs, televisions, and smart fridges.
We designed experiments for emulating the usage of the devices. In particular, we considered:
- Controlled interactions — By using the companion app or smart speaker we automatically controlled the devices (that is, switching on the light, streaming video, triggering motions).
- Idle — We collected the traffic when the device was on but there was no interaction with it.
- Uncontrolled interactions — We recruited 36 participants, who used the devices as they saw fit for six months.
We repeated the controlled experiments 30 times for a total of 34,586 experiments. Our monitoring software captured all packets the devices sent and received to and from the Internet, and organized the results per device and experiment.
Where is your data going?
To answer this question we focused on the following:
- Which parties do the IoT devices contact?
- What is their geolocation?
- What are the most common non-first parties contacted?
A destination can be classified as:
- First party: Manufacturer of the IoT device or a related company responsible for fulfilling the device’s functionality.
- Support party: Any company providing outsourced computing resources, such as CDN and cloud providers.
- Third-party: Any party that is not a first or support party. This includes advertising and analytics companies.
| Organization | US (46 devices) | UK (35 devices) | US Common (24 devices) | UK Common (24 devices) |
| Amazon | 31 | 24 | 16 | 17 |
| 14 | 9 | 10 | 8 | |
| Akamai | 10 | 6 | 6 | 5 |
| Microsoft | 6 | 4 | 1 | 1 |
| Netflix | 4 | 2 | 3 | 2 |
| Kingsoft | 3 | 3 | 1 | 1 |
| 21Vianet | 3 | 3 | 1 | 1 |
| Alibaba | 3 | 4 | 2 | 2 |
| Beijing Huaxiay | 3 | 3 | 1 | 1 |
| AT&T | 2 | 0 | 1 | 1 |
Table 1 — Organizations contacted by multiple devices.
To characterize destinations we tried to find the Second-Level Domain (SLD), by looking at DNS responses, HTTP headers or TLS handshake and then retried characterizing the organization by using public databases, such as whois. We also collected all the IP addresses from network traffic and retried to characterize the organization that holds the IP address.
For geolocating the IP addresses we used RIPE IP Map and Passport. Results showed that:
- Many devices contact Amazon and content delivery network (CDN) providers, as expected.
- Nearly all TVs or dongles contact Netflix without actually using Netflix or being logged in to Netflix. We also noticed that they contact cloud providers outside the boundary of the device’s privacy jurisdiction (for example Chinese cloud providers).
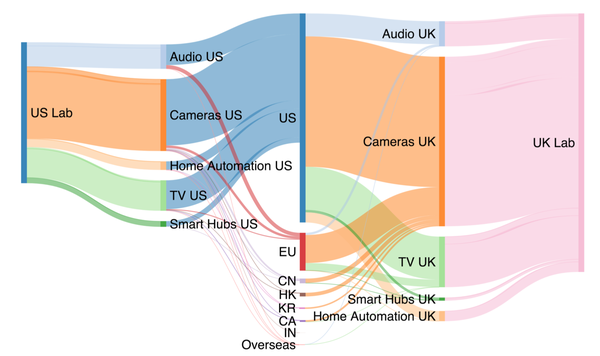
Our results demonstrate that devices change behaviour in different regions, but we couldn’t identify a simple or clear explanation for this behaviour. We then identified the economies contacted and showed the results by grouping the traffic by categories. The Sankey diagram in Figure 2 shows that most of the traffic is produced by cameras and televisions, and most devices contact privacy jurisdictions outside of the testbeds, particularly from the UK.
Unencrypted information leakage
As a next step, we characterized the content sent by the IoT devices, checking for unencrypted content and evidence of privacy exposure.
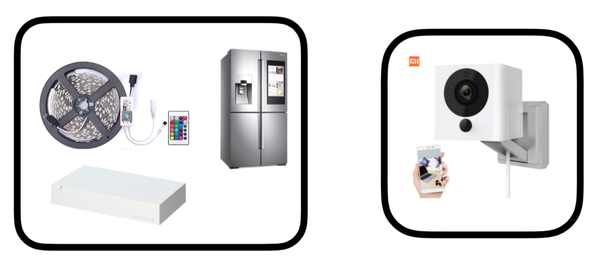
We found that some devices (Samsung fridge, Instead hub, and Magic home LED) expose the MAC address (a unique identifier) unencrypted. Interestingly, each time the Xiaomi camera detected motion, its MAC address, the hour, and the date of the motion (in plaintext) were sent to an Amazon EC2 domain. We also noted that an image was included in the payload.
We finally noted other unencrypted content, such as firmware updates and metadata about the initial device set up.
How much traffic is encrypted?
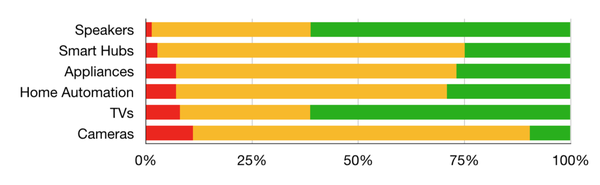
Fortunately, our study didn’t only produce bad news! When analyzing the traffic, we found that the amount of unencrypted traffic is quite small (see the red bar in Figure 4).
Can we infer user activity from network traffic?
Even if most IoT traffic is not plaintext, we wondered if it would still be possible for eavesdroppers to detect user activity based on encrypted/encoded network traffic patterns. More specifically, is it possible to understand how and when users interact with IoT devices, and which device functionality has been used (for example turning on/off a light)?
We collected traffic patterns resulting from controlled device interactions and then looked for similar patterns using supervised machine learning. We tried several machine learning approaches and ended up with the Random Forest Tree Classifier. As features, we used packet size and inter-arrival time, among others.
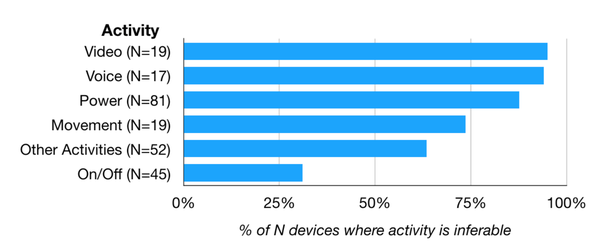
Figure 5 shows that significant amounts of device activities are inferable, particularly video or voice activities. Inferable activities can be exploited by eavesdroppers (for example, ISPs or cloud providers) to understand what devices users have when they are present in their homes, and what they are doing in their homes.
Inferring device activities opens up another important capability: if we can identify what a device is doing, we can determine whether it takes certain actions (for example, recording a video) unexpectedly.
Does a device expose information unexpectedly?
We defined unexpected behaviour as cases when a device generates network traffic corresponding to an interaction that was not triggered by an experiment, or if it was not intended by the user.
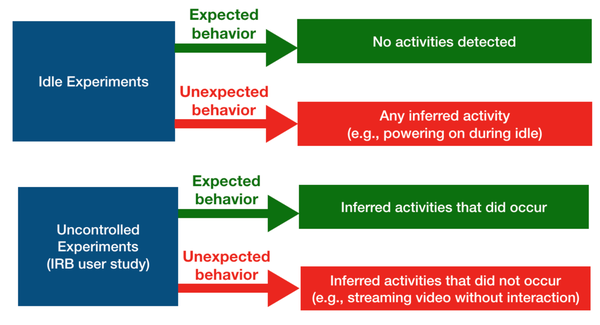
We focused on uncontrolled and idle experiments and found several unexpected behaviours, including:
- Some popular video doorbells can detect motion, and we found that the devices record a video of whoever triggered motion detection — both without notifying the person being recorded (except for a notification in the app of the device owner) and without a way to disable the feature.
- Several televisions contact Netflix, Google or Facebook regularly, even when these services were not used.
- Some smart speakers, such as Alexa-enabled devices, frequently record audio when the wake word is not spoken. As an example, Alexa devices wake up when a sentence beginning with “I like [s-word]” is spoken.
- Even when there is no motion or activity in the room, some cameras falsely trigger motion and record.
- Many devices spuriously restarted.
A call for caution and transparency
Our study was the first to quantify information exposure across different networks, geographic regions, and interactions with devices.
We found many behaviours that should make consumers think carefully when considering deploying such devices in their homes.
Furthermore, we found that there is a need to provide greater transparency when it comes to IoT device behaviour, so users can better identify unexpected and unwanted data transmission, and take appropriate action.
Some of our key findings include:
- More than 50% of destinations contacted by the IoT devices are non-first parties.
- 56% of the devices in the US and 84% in the UK contact at least one destination abroad.
- Many devices (89%) are vulnerable to at least one activity inference that can be used to identify unexpected activities.
Our study is a first step toward understanding information exposure by consumer IoT devices at scale. To facilitate analysis and reproducibility in the broader research community, our experiment infrastructure, code, and data are publicly available.
While our initial study has only scratched the surface, stay tuned for follow-up work that provides deeper insights into unexpected behaviour from IoT devices and shows how to control information exposure from them.
Contributors: Jingjing Ren, Daniel J. Dubois, David Choffnes, Roman Kolcun, Hamed Haddadi
Adapted from original post which appeared on RIPE Labs Blog.
Anna Maria was a RACI fellow at RIPE 79 and presented her research during the IoT WG at RIPE 78
The views expressed by the authors of this blog are their own and do not necessarily reflect the views of APNIC. Please note a Code of Conduct applies to this blog.