

Over the past decade or so, the number and intensity of Distributed Denial-of-Service attacks (DDoS) have rapidly increased. While attack traffic volumes of the order of hundreds of Gbps were considered shocking only five years ago, we are now in the Tbps era. Every high-profile attack forms a stern reminder that DDoS has become a persistent threat against Internet stability and reliability — and arguably, the full potential of attacks has yet to be seen.
The DDoS threat has given rise to diverse mitigation solutions, including remotely-triggered blackholing (RTBH). A measure well-known to network operators, RTBH builds upon the BGP communities attribute. By tagging prefix announcements, peers can request other networks (for example, an upstream provider) to drop prefix-destined traffic altogether. As such, attack traffic can be stopped before it congests an interconnecting link.
In 2017, we at the University of Twente were involved in a collaborative project with the Center for Applied Internet Data Analysis (CAIDA / UCSD), and the Helmholz Center for Information Security (CISPA / Saarland University) to characterize DDoS attacks, using diverse data sources that provide global signals of attacks. We revealed around 30,000 attacks on average each day over a two-year period, involving roughly one-third of all /24 network blocks estimated to be active on the Internet.
Simultaneously, others studied Internet-wide blackholing activity. Following these efforts, we noted that a clear understanding of how blackholing is used following attacks was missing. Intuitively, as blackholing is a rather coarse-grained solution, in which all traffic is indiscriminately dropped, we expected it to be used only as a last resort. As we will show, this turns out to not be the case.
We jointly analysed a three-year data set on attacks with a blackholing data set to get a better understanding of operational aspects. We considered two diverse data sources on attacks:
- Attacks inferred from backscatter packets that reach the UCSD Network Telescope, a /8 darknet.
- Logs from globally distributed AmpPot honeypots, which capture reflection and amplification attacks.
While the specifics of these data sources are too much to address in this post, it is worth noting that they are complementary to each other in terms of the attack types observed — combined they provide a substantial (albeit not complete) view on Internet-wide DDoS activity. As for blackholing, we infer blackholing from public routing data sets provided by RIPE NCC’s RIS and the RouteViews Project.
We considered roughly 28 million attacks, targeting 8.6 million unique IP addresses. We also inferred 1.3 million blackholing events, involving roughly 146 thousand uniquely blackholed prefixes. By combining data sets we found 456 thousand ‘blackholed attacks’, that is, attacks that see mitigation through blackholing.
Rapid mitigation
Below we show the time it takes for blackholing to be activated following the start of an attack. Nearly half of all blackholed attacks (44.4%) see activation within one minute. More than 80% see activation within ten minutes. These times suggest the use of automated attack detection and mitigation.
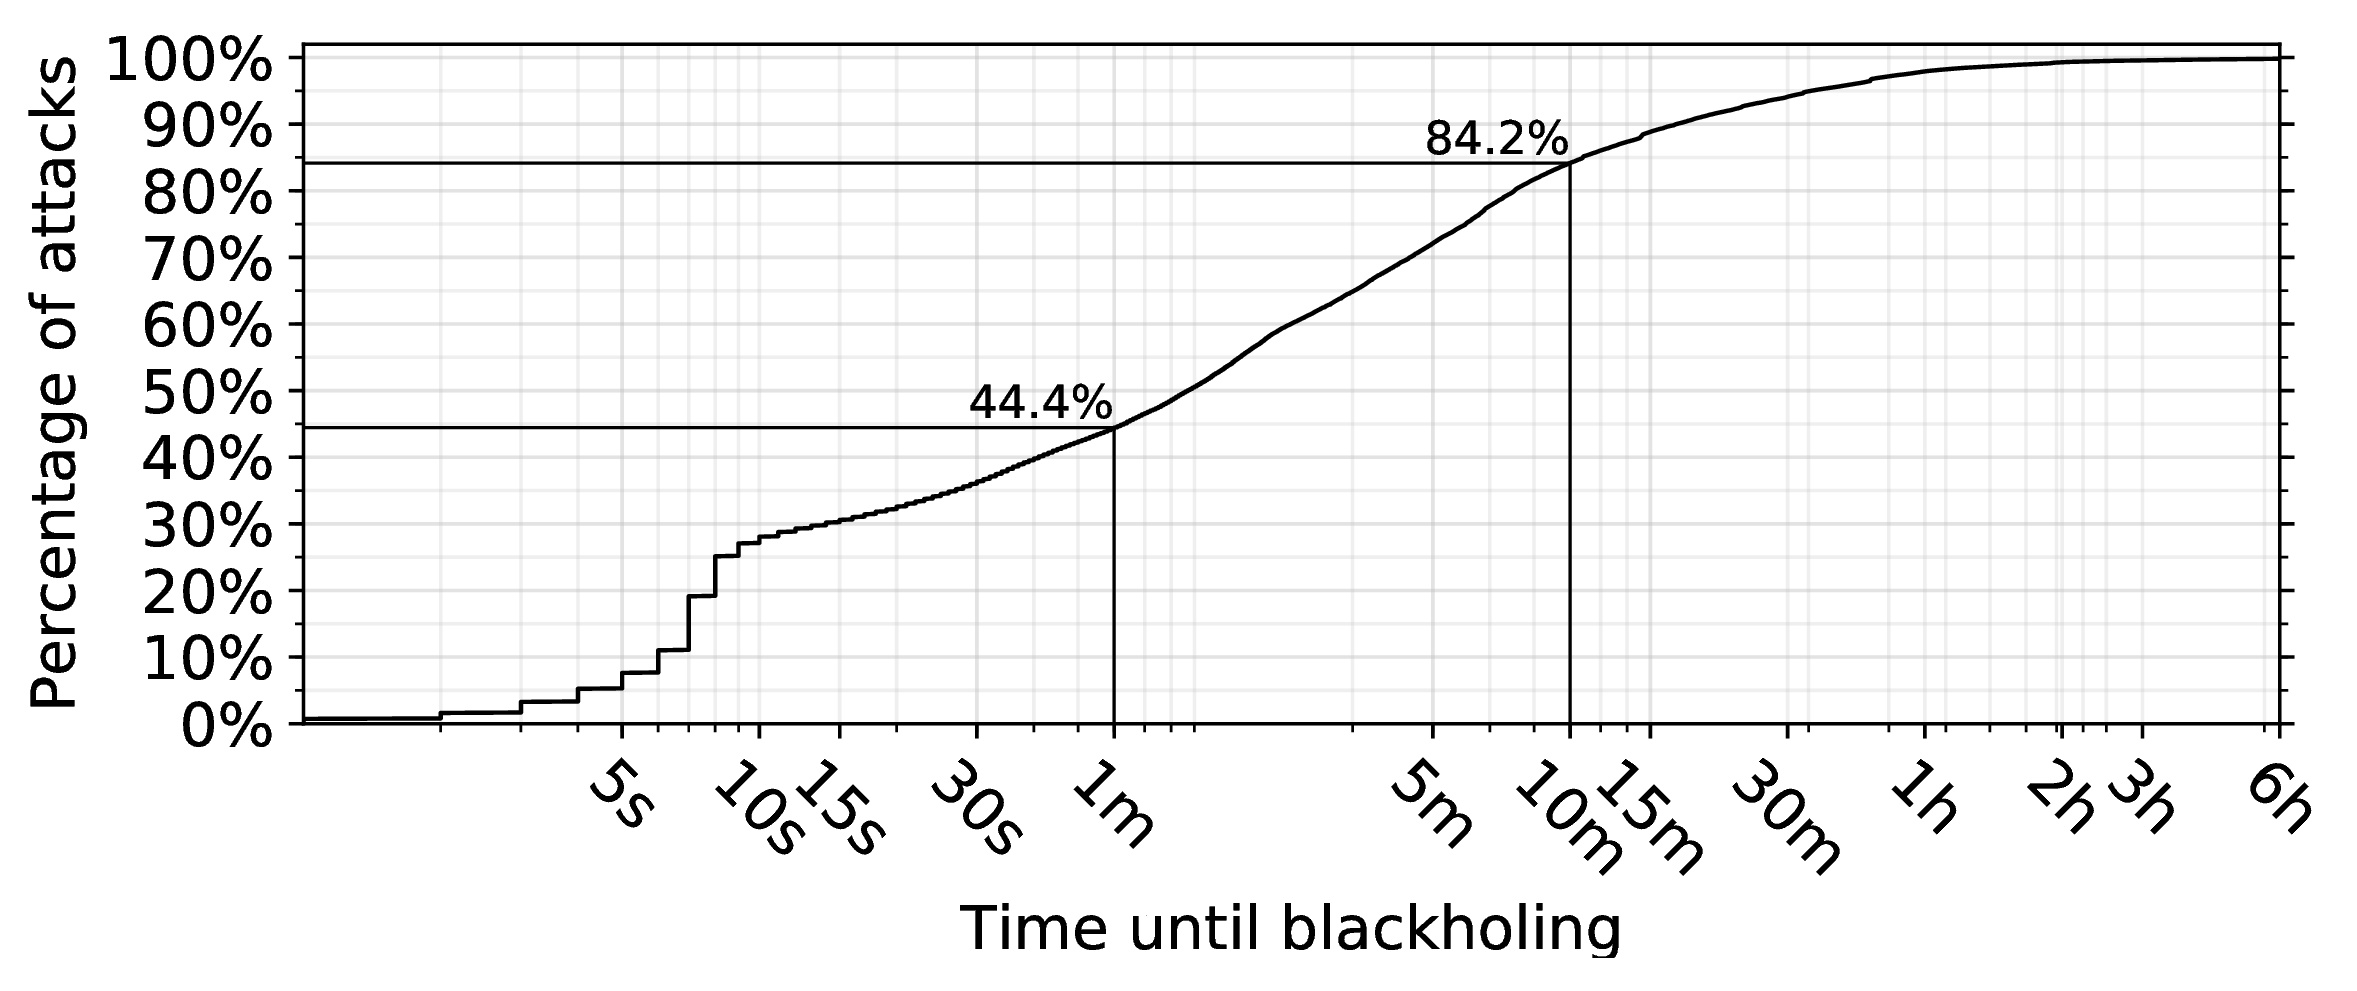
Figure 1 — Time it takes for blackholing to be activated following the start of an attack vs. the percentage of attacks.
Retention times appear excessive
Figure 2 shows the delay between end of attack and blackholing deactivation. For about 96.1% of attacks, deactivation follows within 24 hours. For nearly 4%, it takes longer than one day. These numbers suggest a lack of automation and recovery from blackholing, and highlight that the adverse effects of blackholing — completely blocking traffic to a victim IP address — may extend well beyond the attack duration.
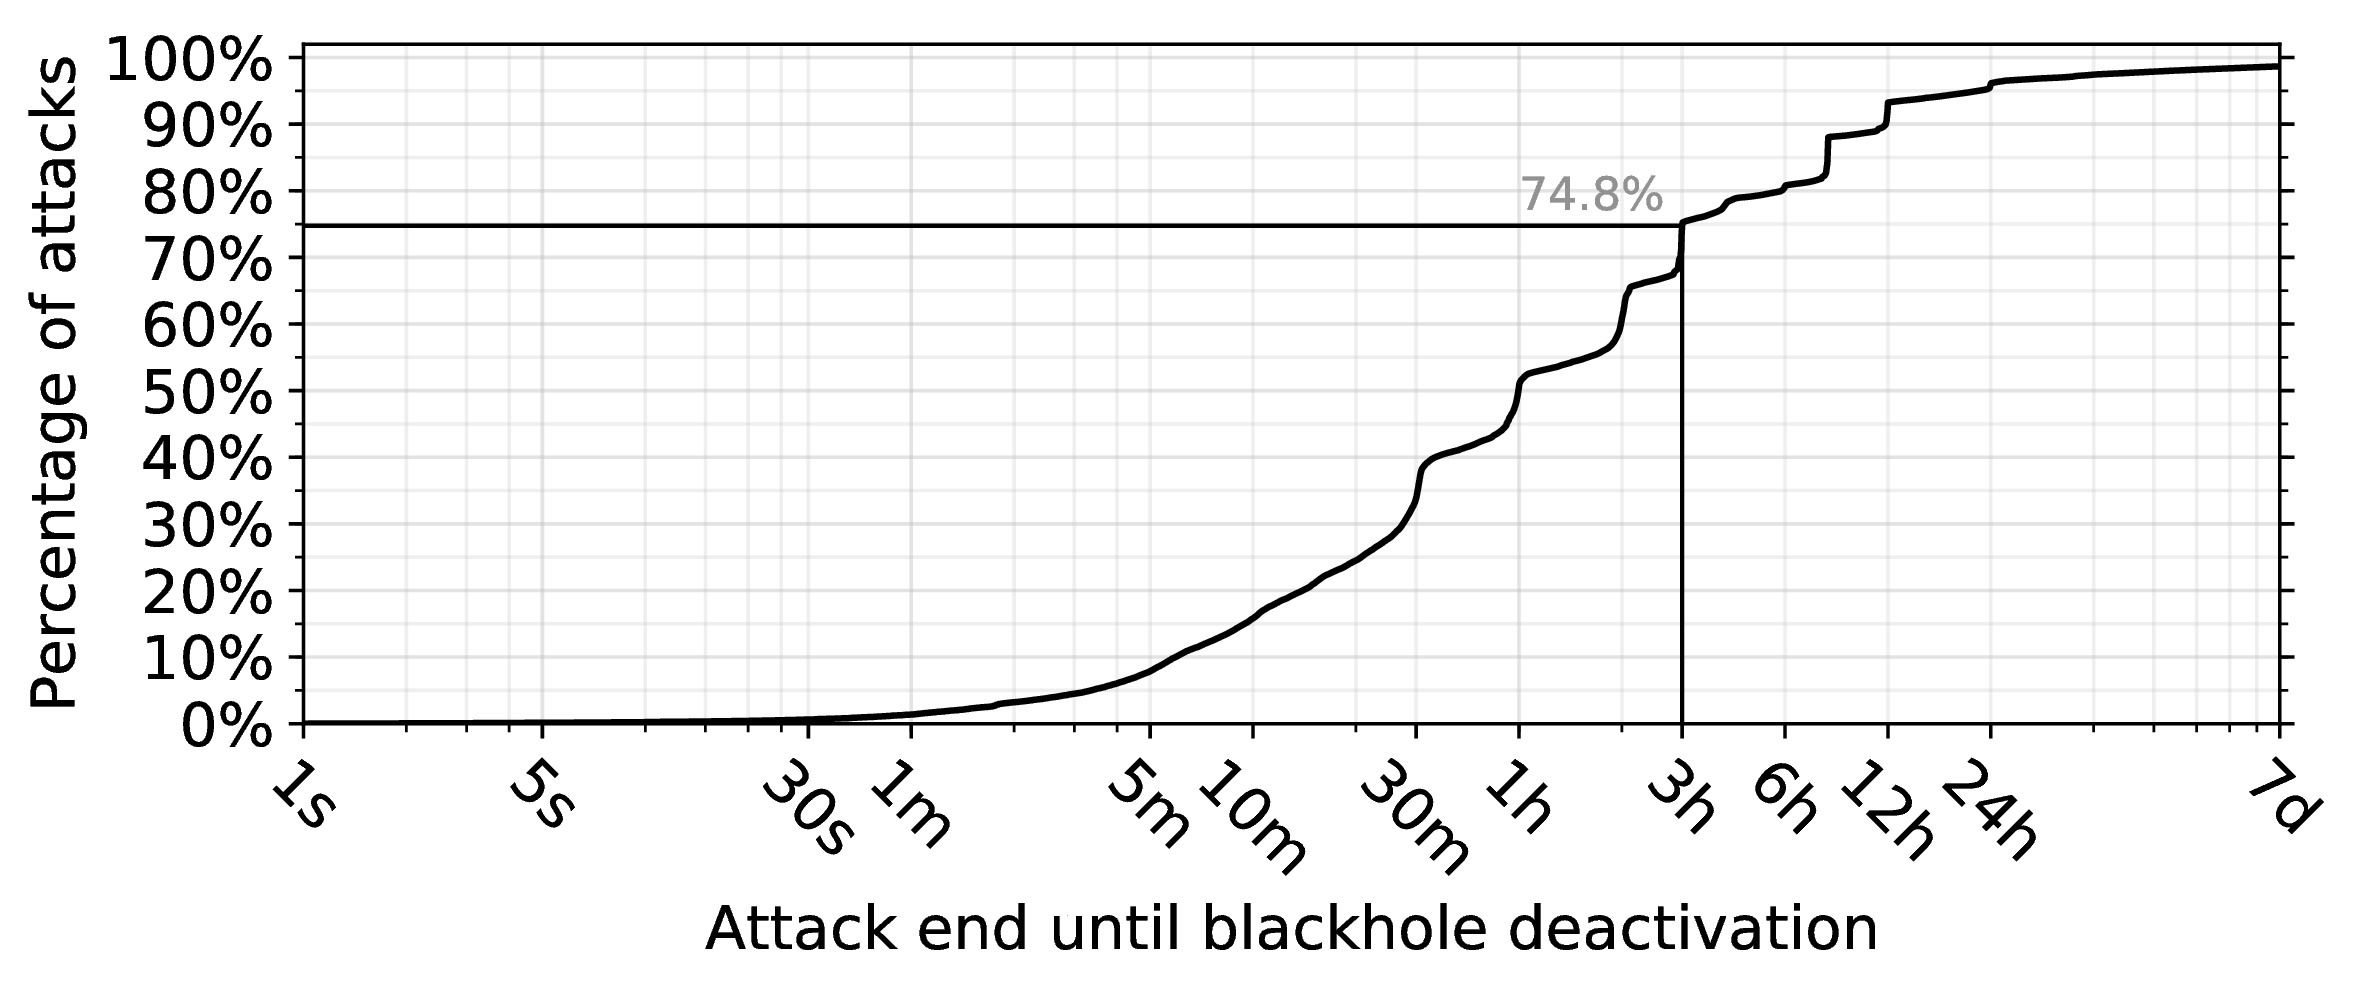
Figure 2 — Delay between end of attack and blackholing deactivation vs. percentage of attacks.
Less intense attacks are blackholed
Our data contains attack intensity measures, the finer details of which can be found in our paper. We show below (Figure 3), for darknet-inferred attacks, the intensity distribution of all attacks (black curve) and for all blackholed attacks (gray curve). Intuitively, blackholed attacks are likely to be stronger. Specifically, 35.4% see an approximate traffic volume of over 300Mbps (100 packets/s), compared to 8.9% for all attacks. However, we also witness that 13.1% of blackholed attacks see 3Mbps (1 packet/s) or less, raising the question of how little effort an attacker needs to do to trigger such a drastic countermeasure.
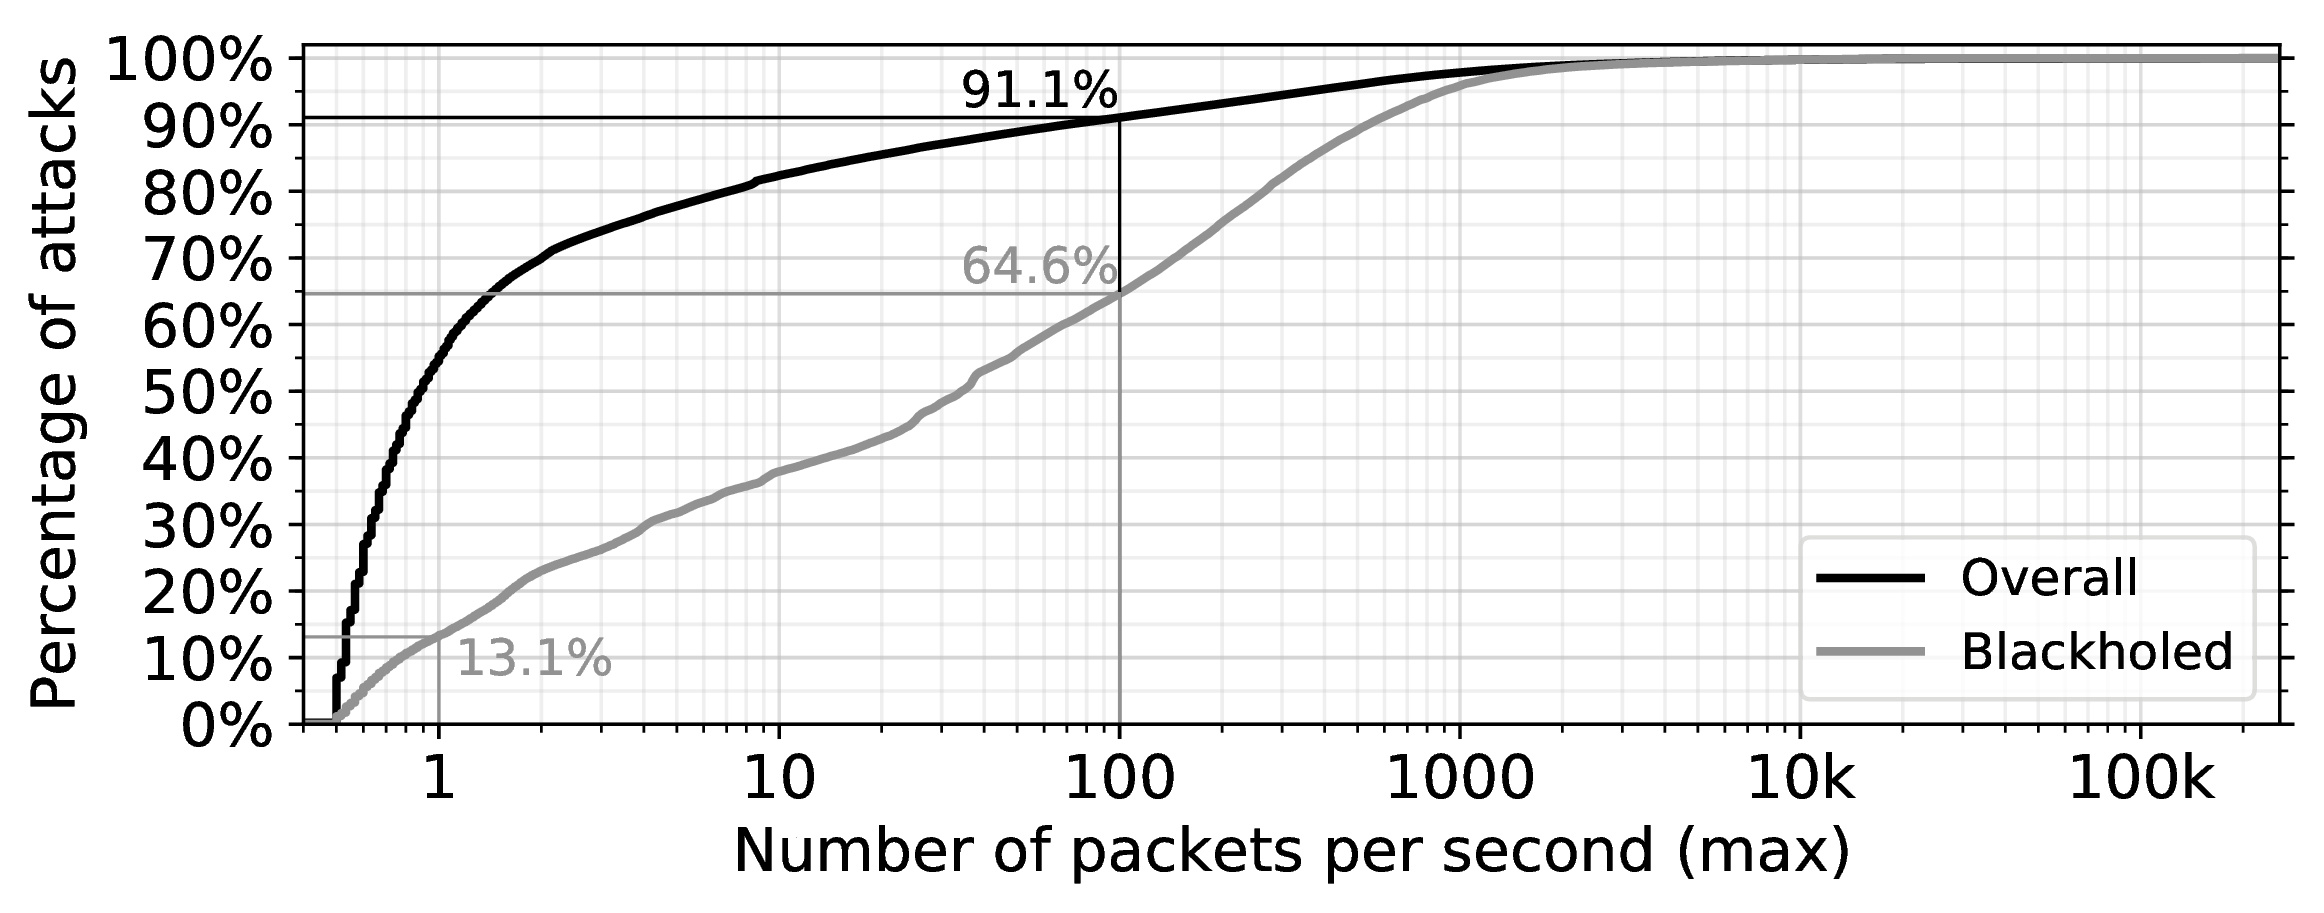
Figure 3 — Attack intensity as per maximum number of packets sent per second.
Based on our analysis we argue that mitigation based on blackholing can be fast and thus appears effective at protecting the network infrastructure involved. However, long retention times — possibly caused by lack of telemetry — and the practice of blackholing low-intensity attacks, appear harsh on the systems involved. We refer interested readers to the full analysis behind this post.
Mattijs Jonker is about to finish his PhD at the University of Twente, The Netherlands.
The views expressed by the authors of this blog are their own and do not necessarily reflect the views of APNIC. Please note a Code of Conduct applies to this blog.