
As part of the training APNIC delivers, we talk about best practices for setting up logs, intrusion detection systems and using automation to keep things up to date. This ‘how to’ will expand on the skills that we teach in workshops and discuss some open source tools that can be used for network security monitoring.
While there are many FOSS (Free and Open Source Software) tools available, I am focusing on Security Onion because of the included tool set and the ease of installation.
Security Onion is an open source Linux distribution for intrusion detection, network monitoring and log management. It includes a host of open source tools, including:
Importing packet captures
Security Onion includes some example packet captures (pcap files) in the /opt/samples directory. To find out more about the samples, refer to Security Onion’s documentation.
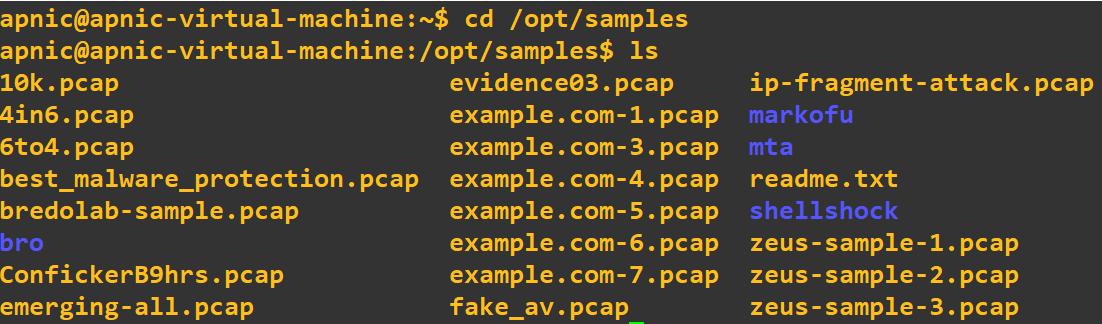 Figure 1 — Directory listing of Security Onion’s example packet captures.
There are three ways to import the pcap files into the Security Onion logs:
- tcpreplay: Import one or more of the packet capture files as new traffic and replay with the current timestamp.
- so-replay: Import all pcap samples in
/opt/samplesand replay them with the current timestamp. - so-import-pcap: Import one or more capture files while keeping the timestamp the same as the original packet capture dates and times.
To import the fake_av.pcap file, type the following command in a terminal window:
$ sudo so-replay fake_av.pcap
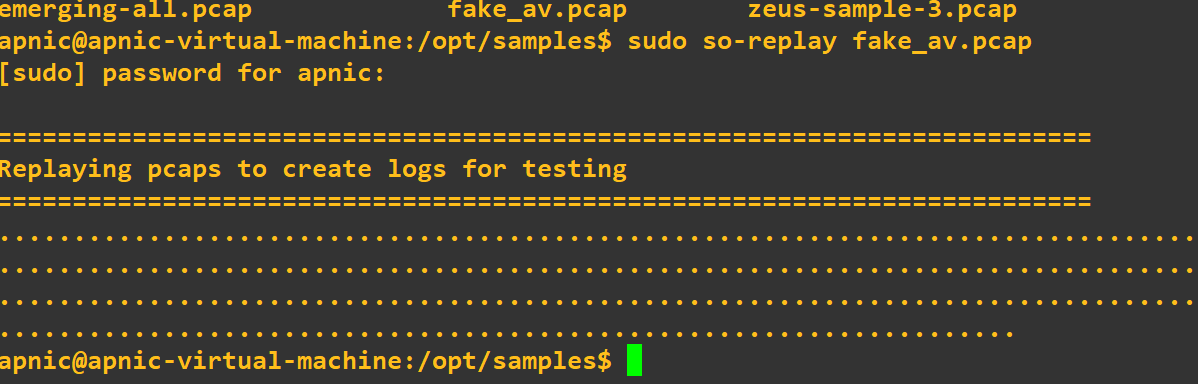 Figure 2 — Output of the so-replay command.
Looking at alerts
Now that we have imported the packet capture file, let’s look at the alerts that were generated by Snort using Squert, a visualization tool that will query and view event data. Squert helps provide additional context to the events through the use of metadata and time series representations.
When Squert first opens you will see a list of all the events. Without knowing too much about the data and events, Squert’s visualization tools will help to identify suspicious sessions or behaviours. By changing the views, the events are displayed in different formats, making it easier to interpret the packets and the metadata. Click on the Summary (1) tab to get started.
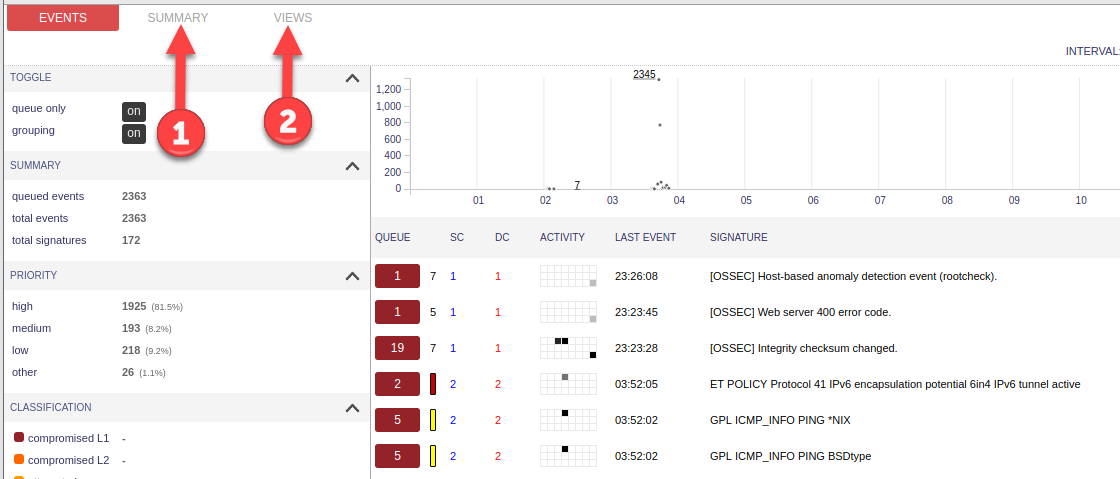 Figure 3 — Squert’s Events view, with Summary (1) and Views (2) tabs.
The Summary page (below) shows a list of the top signatures and the top source and destinations via IP address and economy.
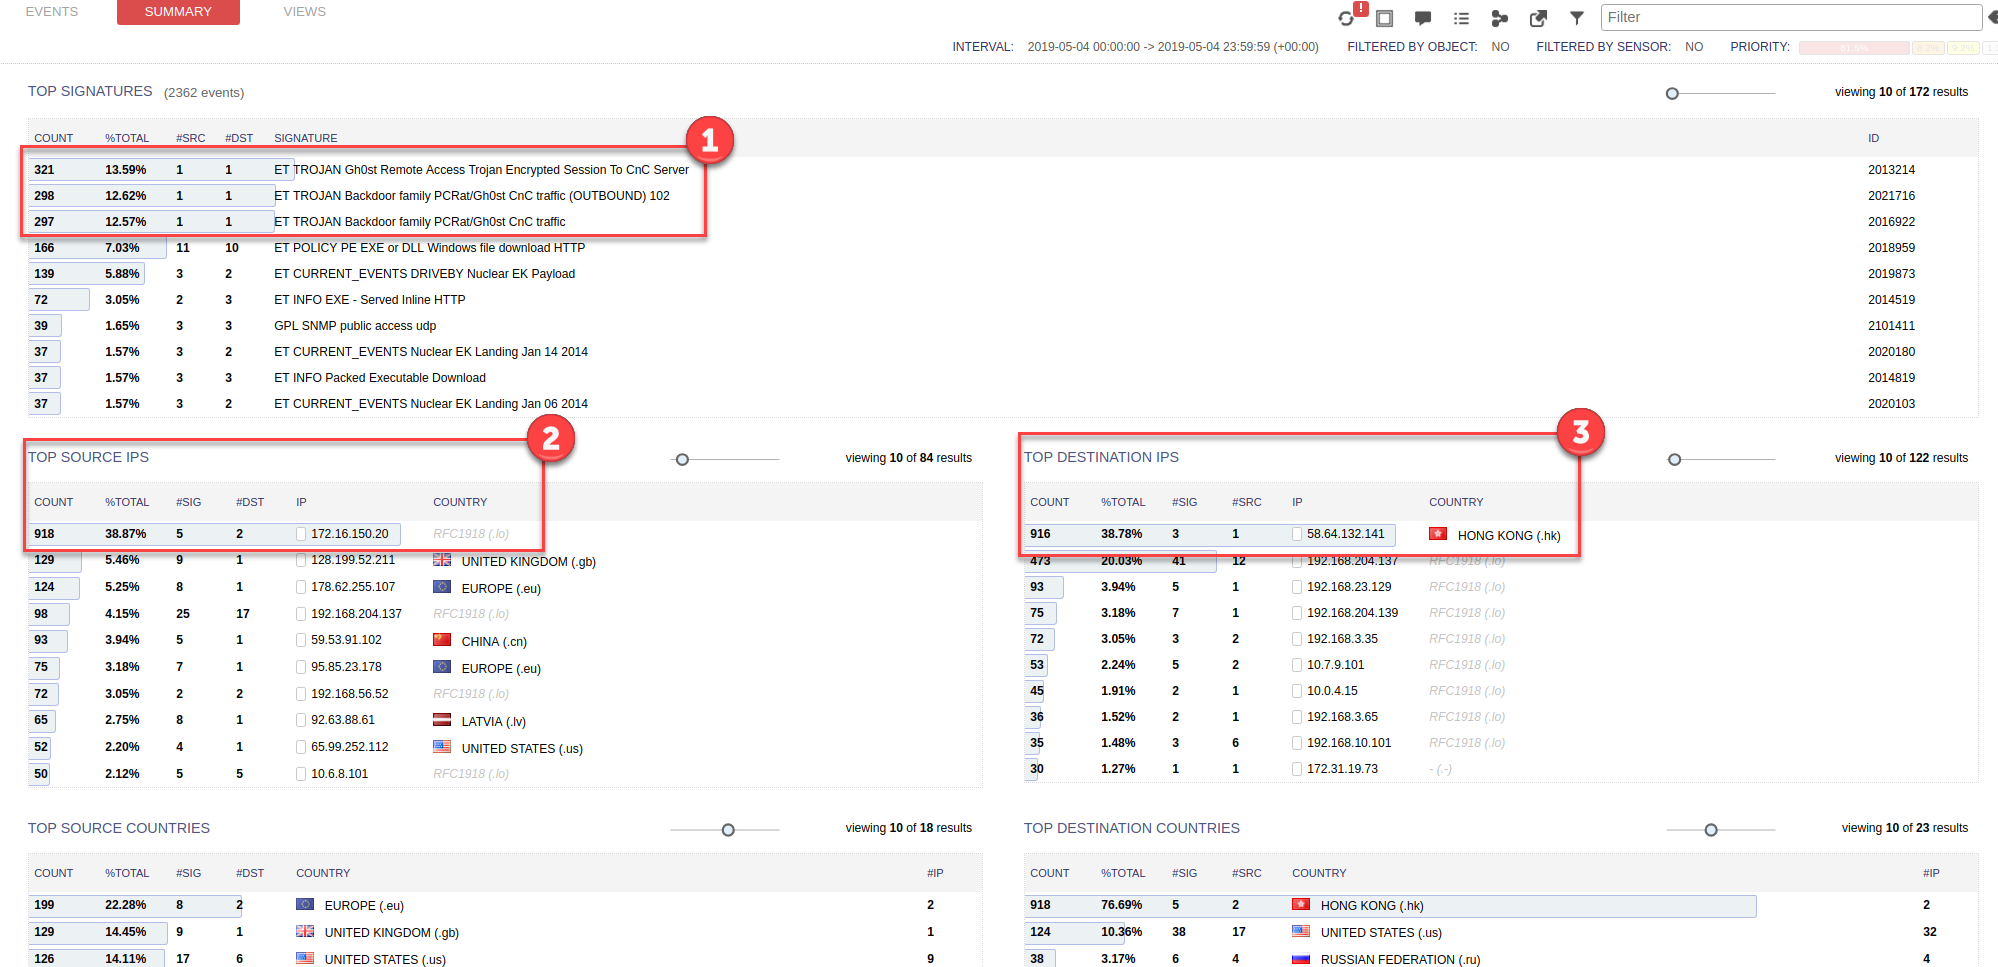 Figure 4 — Squert’s Summary view.
Looking at the summary, we can see straight away that there may be a Command and Control Trojan (CnC) activity in the packet capture file (1).
We can also see that a lot of traffic is originating from an IP address of 172.16.150.20 (2) and that a lot of traffic is going to an IP address of 58.64.132.141 (3).
Using this metadata, we can hypothesize that the infected machine has an IP address of 172.16.150.20 and is talking to 58.64.132.141.
We can confirm our hypothesis on the Views page, which uses a Sankey diagram to show the relationships between IP addresses, source economies and destination economies.
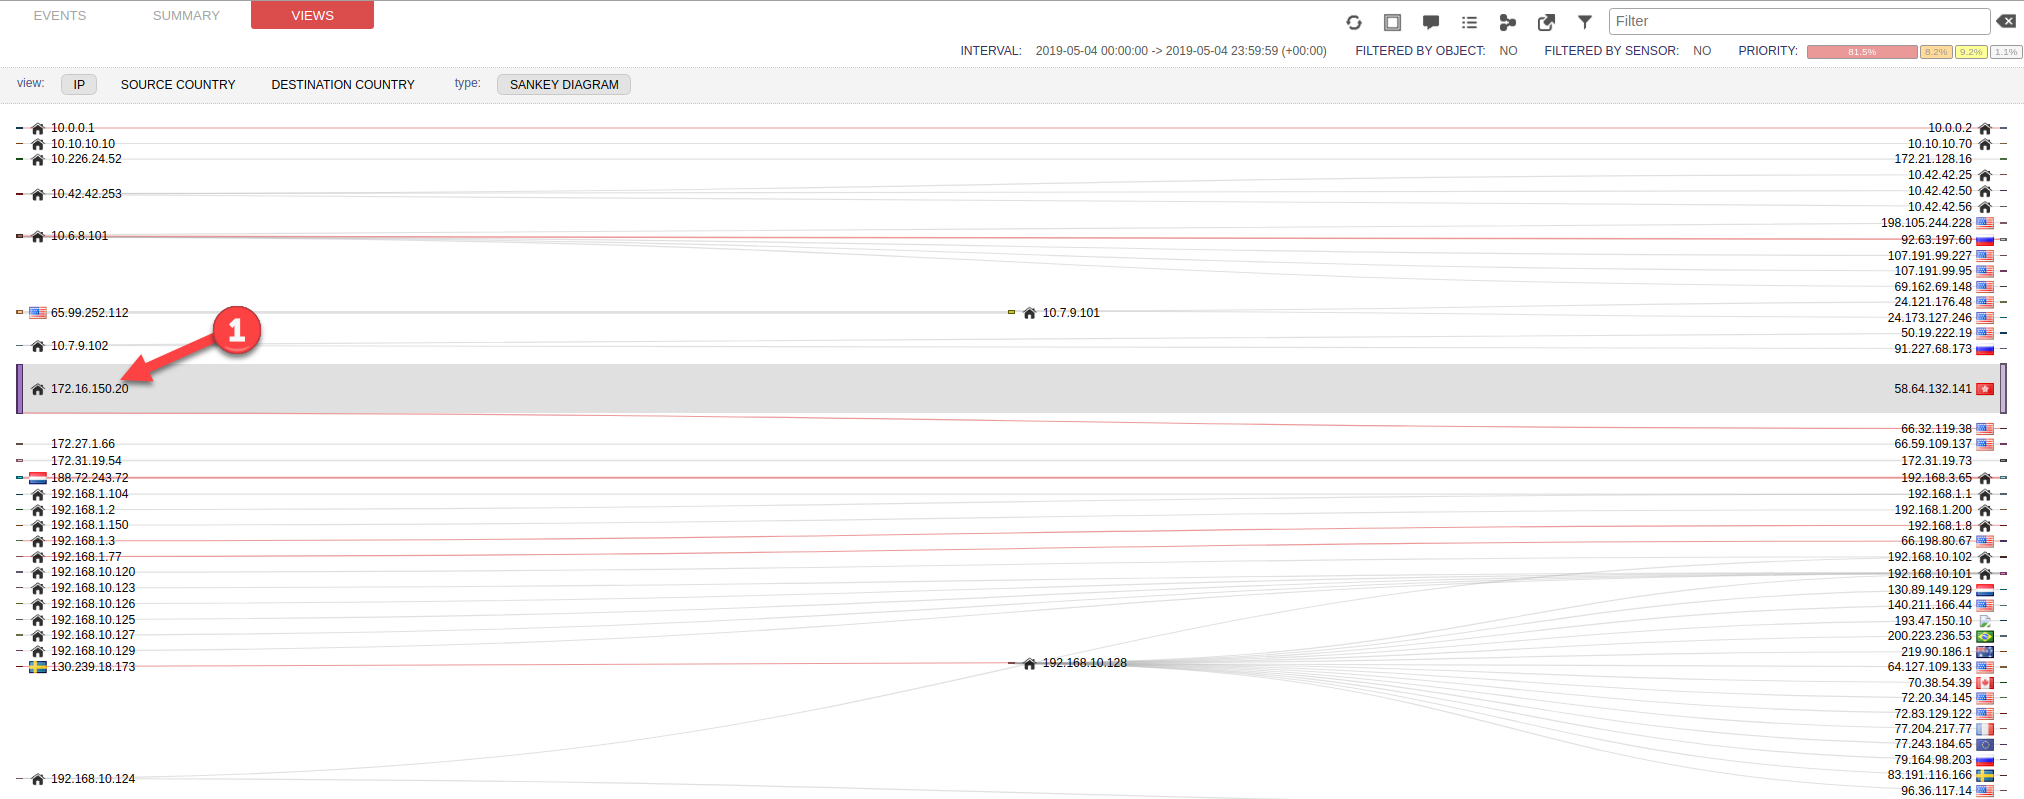
Figure 5 — Squert’s Views page.
From this diagram, we can see that the IP address of 172.16.150.20 (1) is indeed mainly talking to 58.64.132.141, but there is also a red line showing a relationship with 66.32.119.38.
Setting up a filter
Click back to the Events page, and we will apply a filter (1) for the IP address of 66.32.119.38 to see if any events have been logged about this activity.
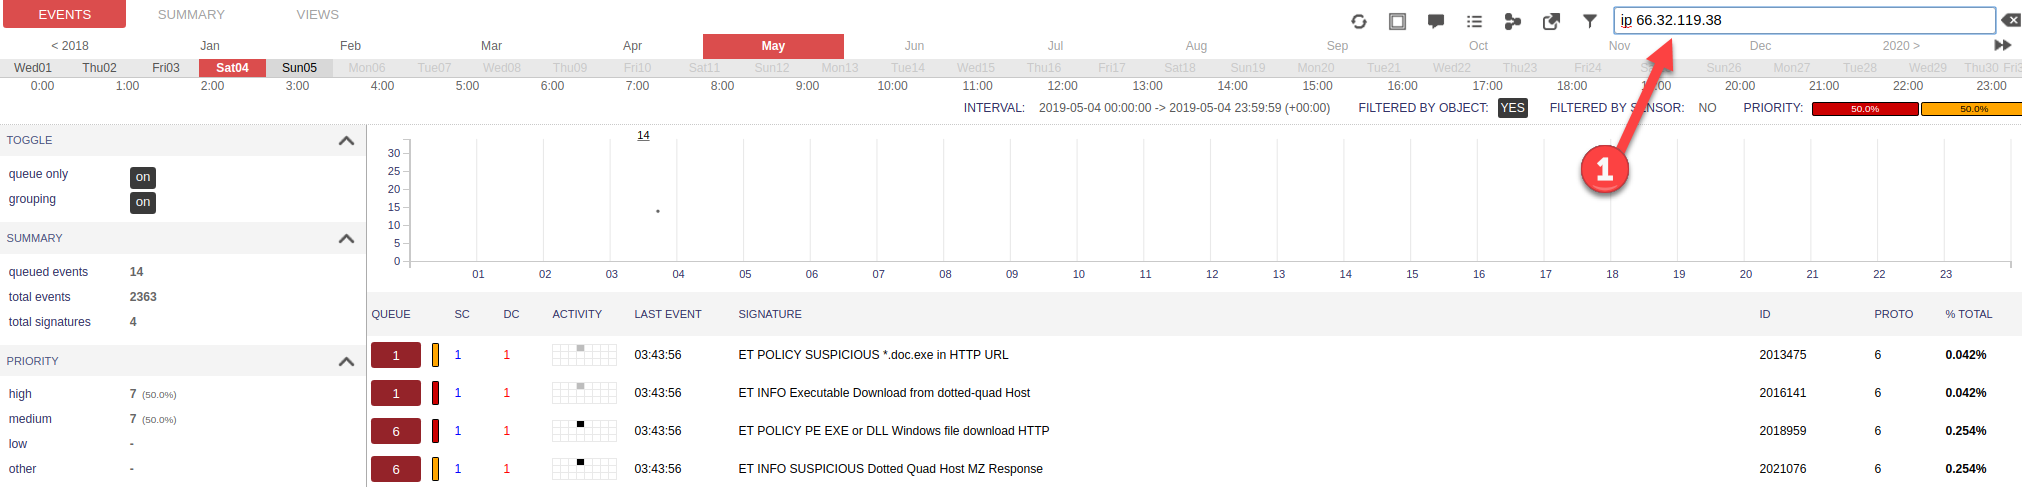
Figure 6 — Squert’s Events page with IP address filter.
From the output, it certainly does look like an Indicator of Compromise (IoC) because a suspicious file was downloaded from the IP address of 66.32.119.38.
To investigate further, run a query on the original logs (1) and filter by the IP address of 66.32.119.38 (2) to get an idea of the time it occurred.
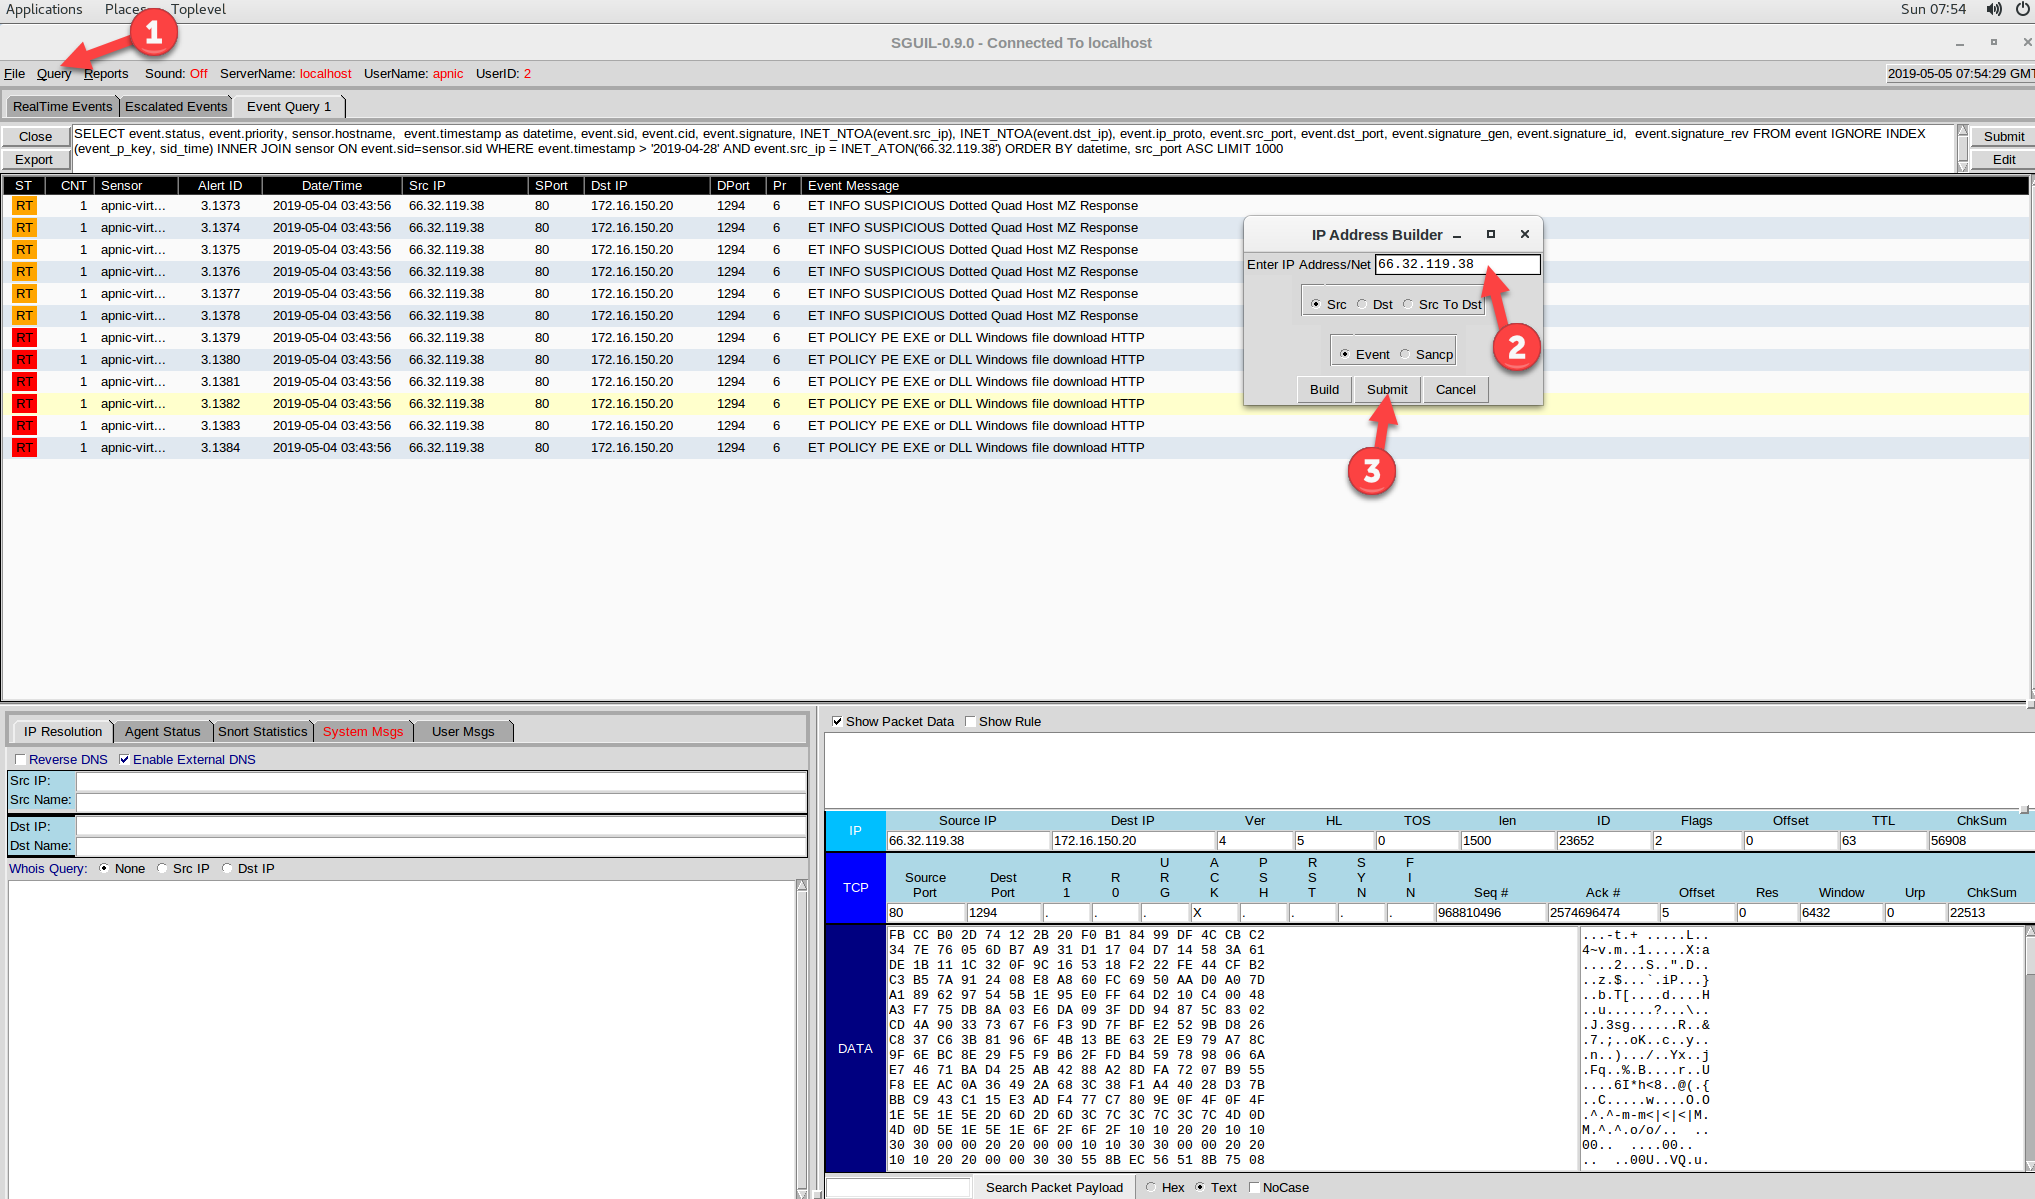
Figure 7 — Running a query for a specific IP address in Squert.
To view more details about the potential malicious file, Ctrl + right-click on the first PE EXE or DLL event’s Alert ID and click on Transcript.
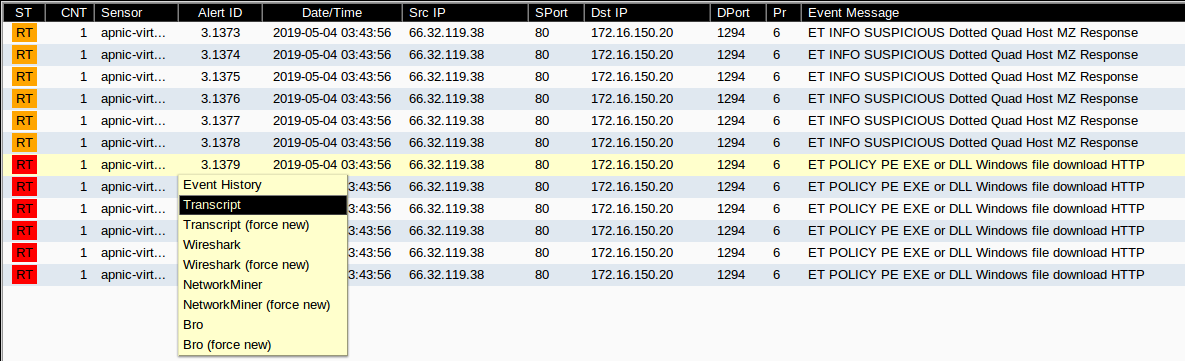 Figure 8 — Selecting an event to view its transcript.
From this transcript we can identify the file’s name (1) and can indeed see that it was an executable file that has potentially two file extensions (.exe and .doc) to try and fool the end user into thinking it is a Word document.
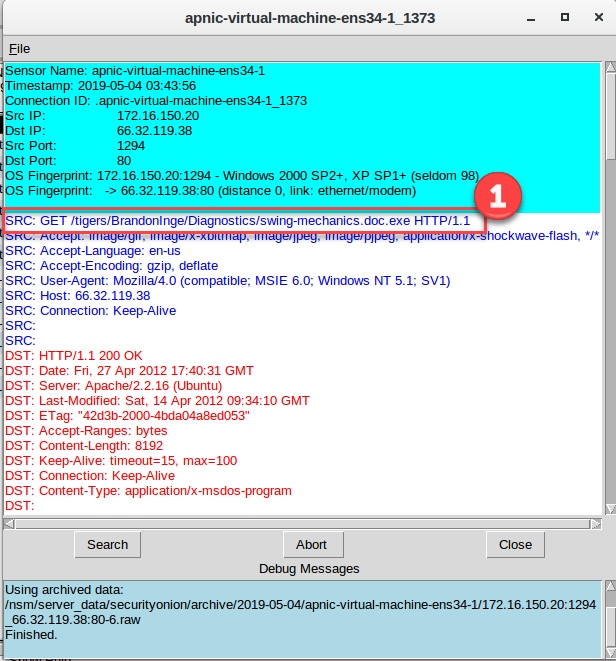
Figure 9 — Squert’s transcript view.
At this point you can extract the file for further analysis. NOTE: this file could be malicious and should only be extracted on an isolated system.
Extracting the file using Wireshark
The file can be extracted by using Wireshark or NetworkMiner. To use Wireshark do a Ctrl + right-click on the first PE EXE or DLL event’s Alert ID then select Wireshark.
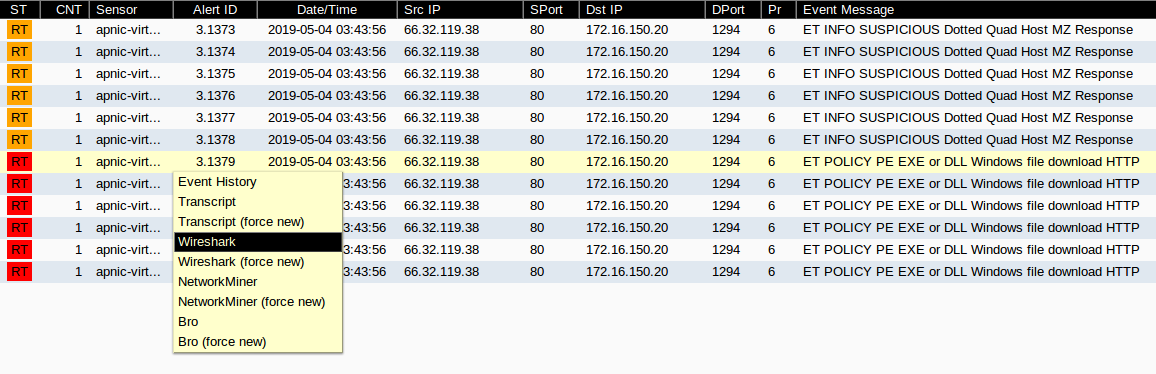
Figure 10 — Opening Wireshark from the Squert event list.
After opening Wireshark, right-click on the first packet, scroll down to follow and click on TCP Stream.
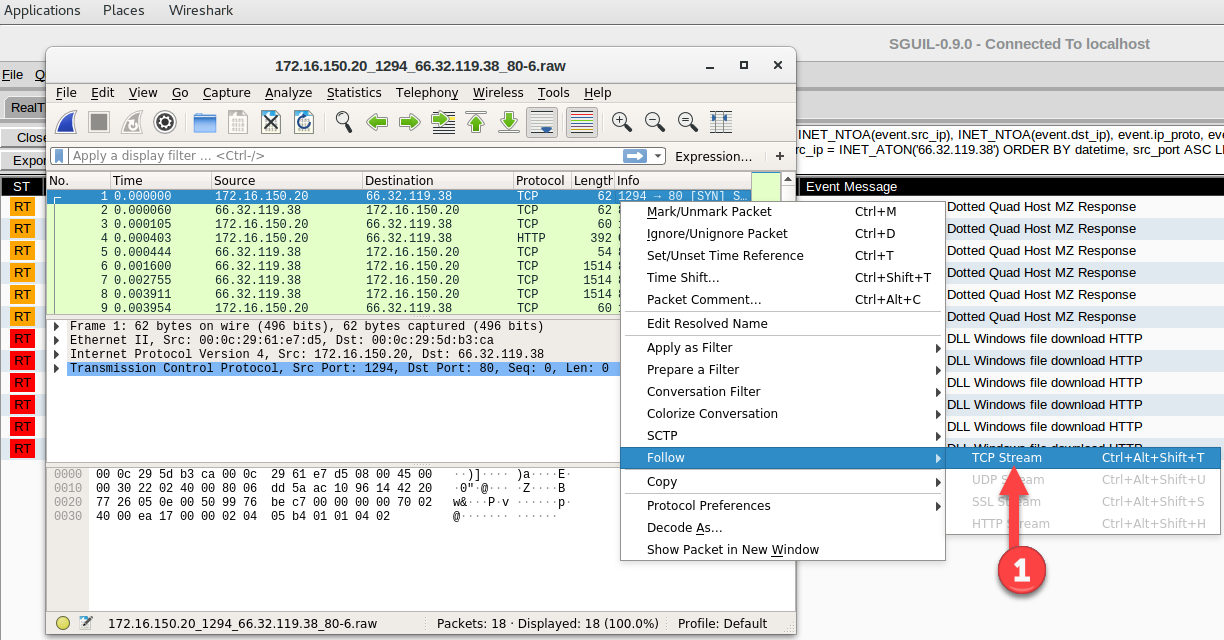
Figure 11 — Following a TCP stream in Wireshark.
This will piece all the packets together and display the contents of their combined payloads in plain text (ASCII) form.
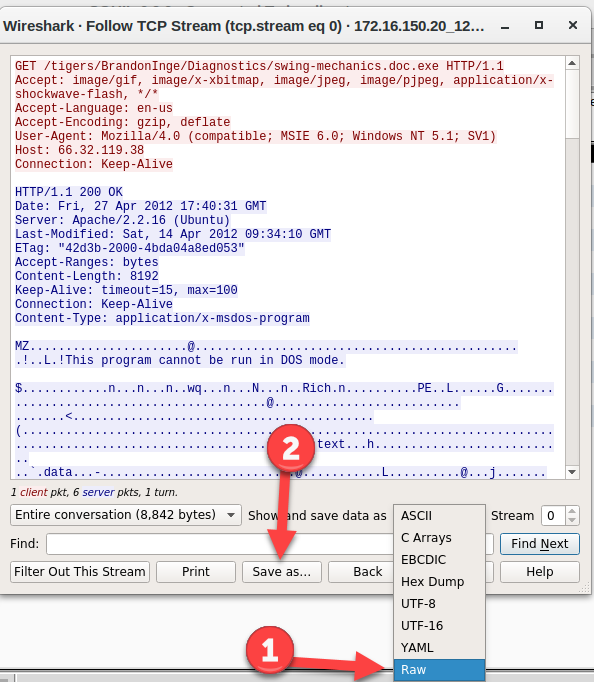
Figure 12— Viewing a TCP Stream and exporting in Raw format using Wireshark.
To extract the file, change the data type to Raw and click on Save as…
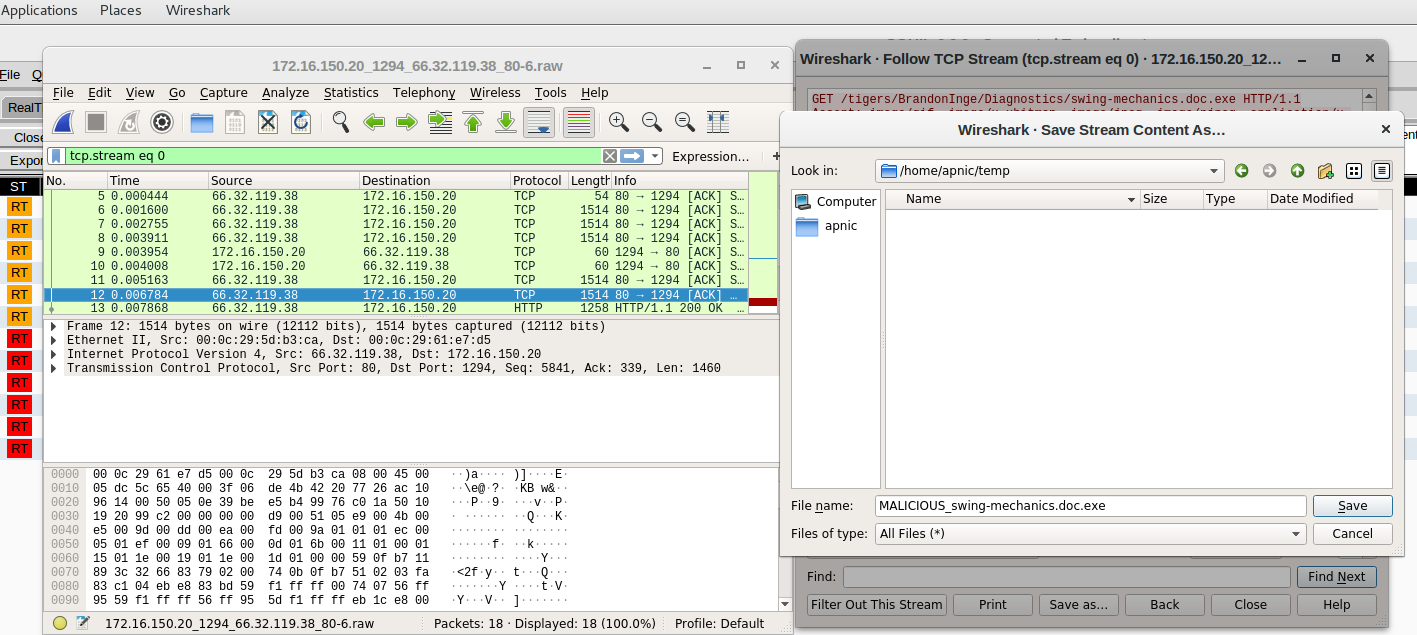
Figure 13 — Saving a TCP stream’s payload to a file in Wireshark.
Extracting the file using NetworkMiner
I find NetworkMiner a little friendlier to use and it is ideal for beginners. To use NetworkMiner, Ctrl + right-click on the first PE EXE or DLL event’s Alert ID then select NetworkMiner.
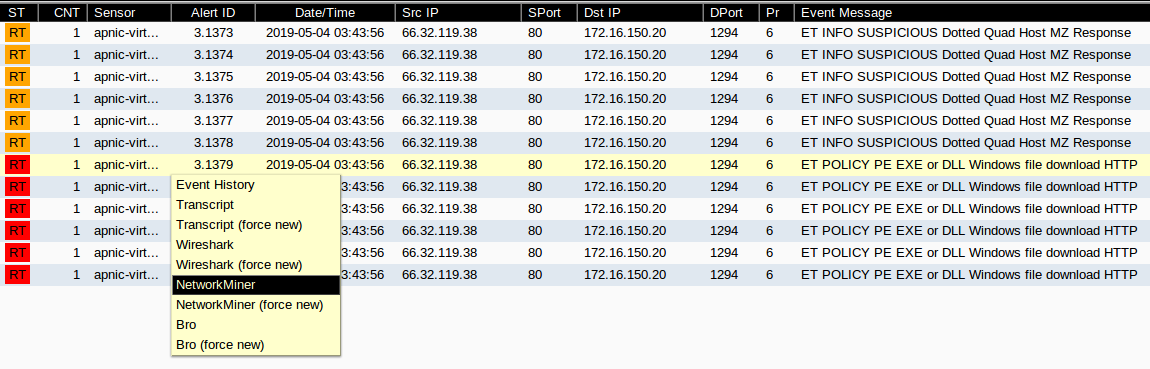
Figure 14 — Opening Network Miner from Squert’s event list.
Click on the Files tab, then right-click on the filename and click on Open folder to see the extracted files.
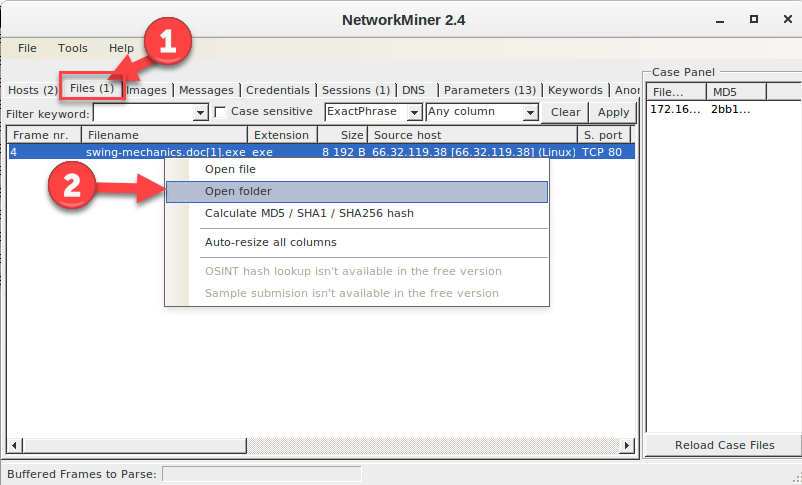
Figure 15 — Extracting a file using Network Miner.
Once the file is extracted it is a matter of using your favourite tools to analyse the file for malware. A quick way is to upload the file to VirusTotal to check whether the hash has been seen before.
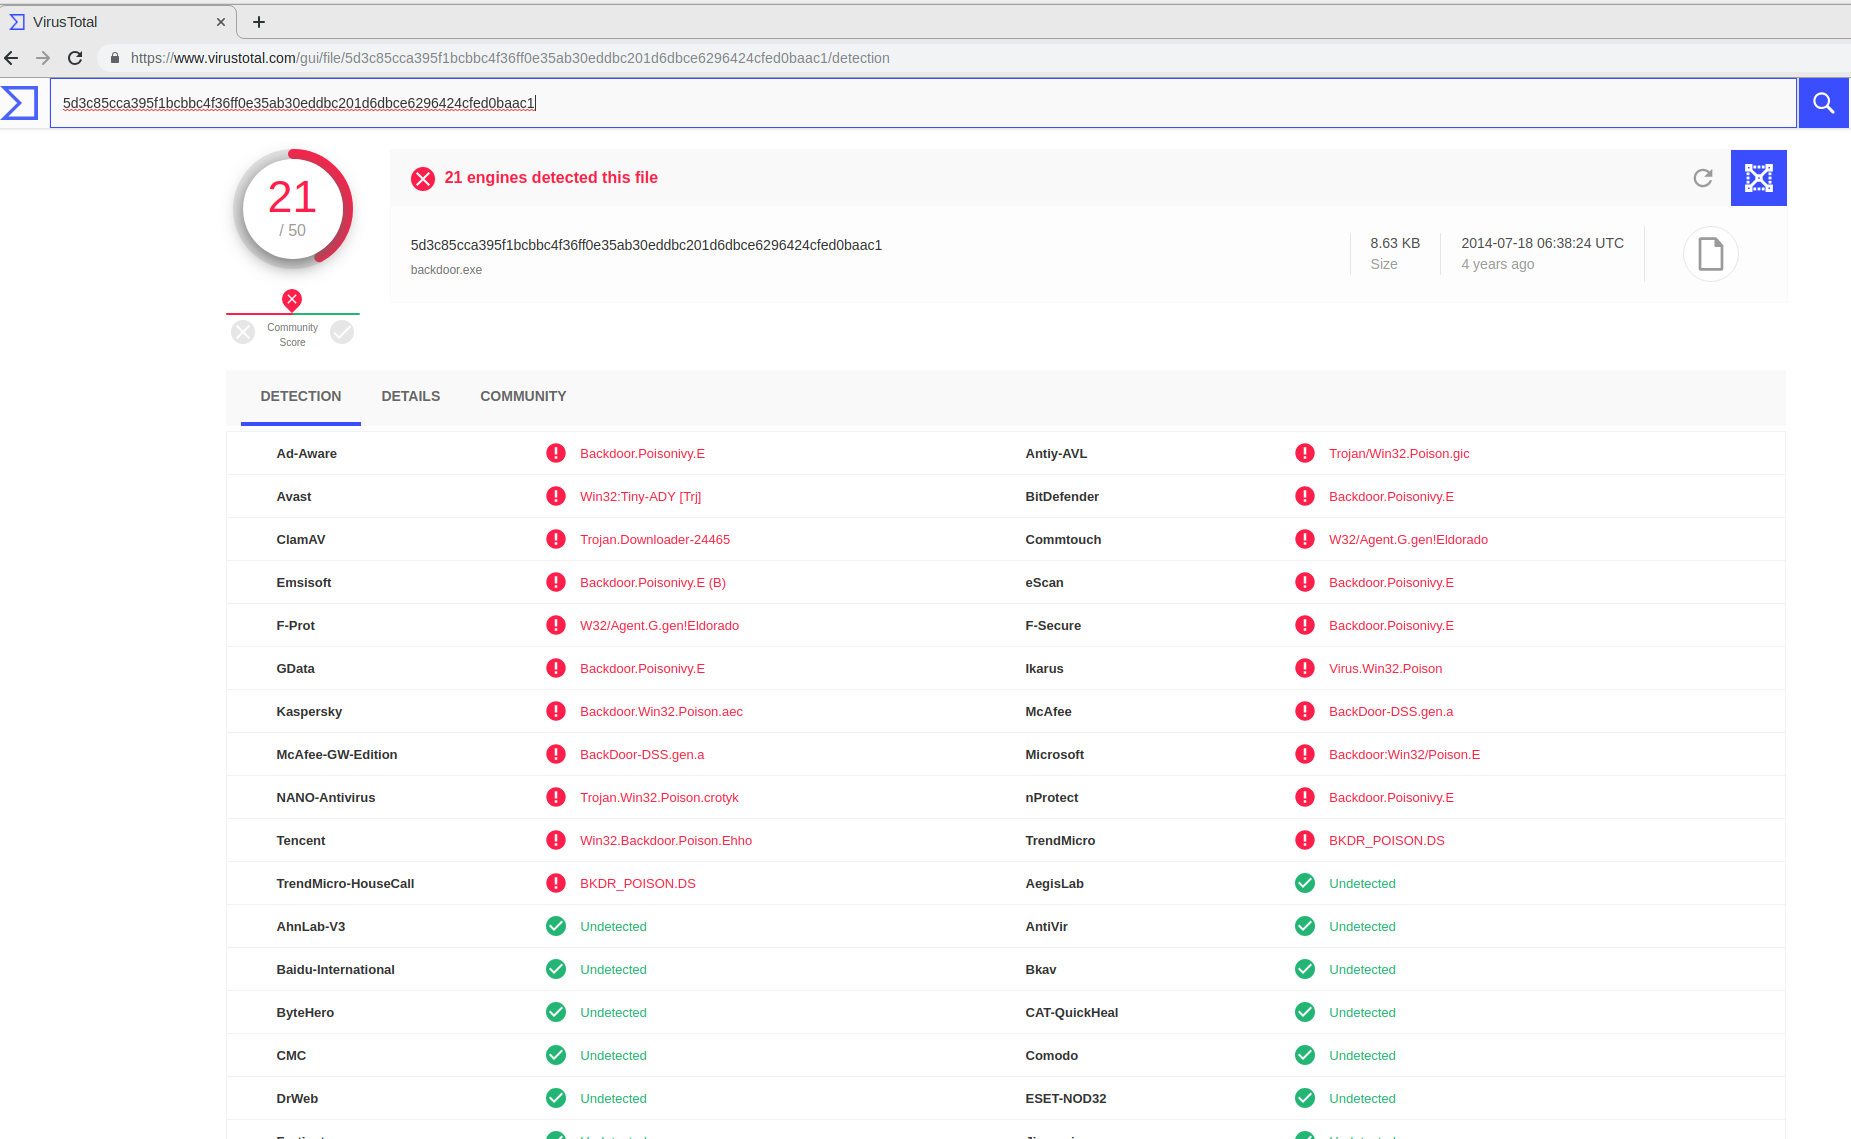
Figure 16 — Using Virus Total to check a file.
So, in a short amount of time, we have been able to use Security Onion to analyse a packet capture for an IoC or malicious activity, extract a suspicious file and determine that the file was indeed malicious.
With more practice, you should find that Security Onion is a valuable resource when it comes to network forensics, analysing packet captures, Snort alerts and other logs.
The views expressed by the authors of this blog are their own and do not necessarily reflect the views of APNIC. Please note a Code of Conduct applies to this blog.
un travail important et bien fait
Thank you very much, nice tutorial, Christian