
Continuous monitoring is an essential part of detecting security issues, misconfiguration, equipment failure, as well as performing traffic engineering. With networks growing in size, complexity, and traffic volume, the need for continuous and precise monitoring is greater than ever before.
Network telemetry is emerging as a powerful way to support these needs. At the highest level, it is a push-based approach to monitoring: data plane devices such as switches and routers stream data about traffic and performance to the software that performs analytics.
Today’s telemetry systems force users to choose between granularity and coverage. Packet-level systems stream every packet (or header) to software. This provides fine-grained visibility, but the cost of processing every packet in software makes high coverage impractical. Flow-level systems, such as NetFlow, summarize packets into per-flow records before they reach analytics software. This greatly reduces workload and makes high coverage practical, but sacrifices packet-level visibility.
Fortunately, the next generation of telemetry systems can leverage advances in switch and server hardware to strike a better balance between granularity and performance. In switches, reconfigurable data planes support custom packet processing at line rates of billions of packets per second. In servers, high bandwidth memory and instruction-level parallelization enable trillions of calculations per second.
While both platforms are powerful, neither is good at everything that telemetry and analytics systems need. As a result, it is crucial to identify the role each platform should play. Most network analytics tasks can be broken into three different stages:
- A selection stage extracts packet features from the data path.
- A grouping stage groups the features by some subset of the header space.
- Finally, an aggregation stage calculates statistics for each group of packets.
The selection and grouping stages are more suitable for switch data plane hardware, which has direct access to packet headers and can perform basic grouping operations through low-latency, on-chip memory. The aggregation stage is better suited to the server because it is application-specific and may require calculations too complex for switch hardware.
Grouped Packet Vectors
To implement this design, my fellow researchers and I (working in the Jetstream team) introduced a new format for telemetry data: Grouped Packet Vectors (GPVs). GPVs contain a flow key, for example, an IP 5-tuple, and a variable-length list of packet features, such as timestamps and sizes for each packet.
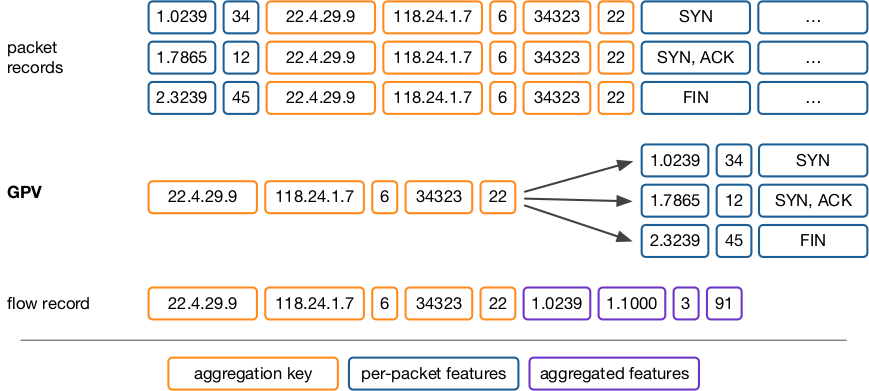 Figure 1 — Packet records, GPV, and flow record of the same sample.
GPVs have two important properties. First, they can be generated at line rate by switch hardware. Second, they allow applications to efficiently calculate custom, per-flow statistics by eliminating the overheads of selection and grouping.
Going forward with a telemetry architecture based on GPVs, we see future monitoring and analytics systems consisting of three main components:
- Distributed data plane processes that generate GPVs and stream them to collection and analysis servers.
- An optimized platform for long-running monitoring applications that analyse high volumes of traffic in software by leveraging parallelism.
- An interactive debugging system that allows network operators to manually query GPV streams and perform exploratory data analysis with the goal of getting detailed insight into security or performance issues.
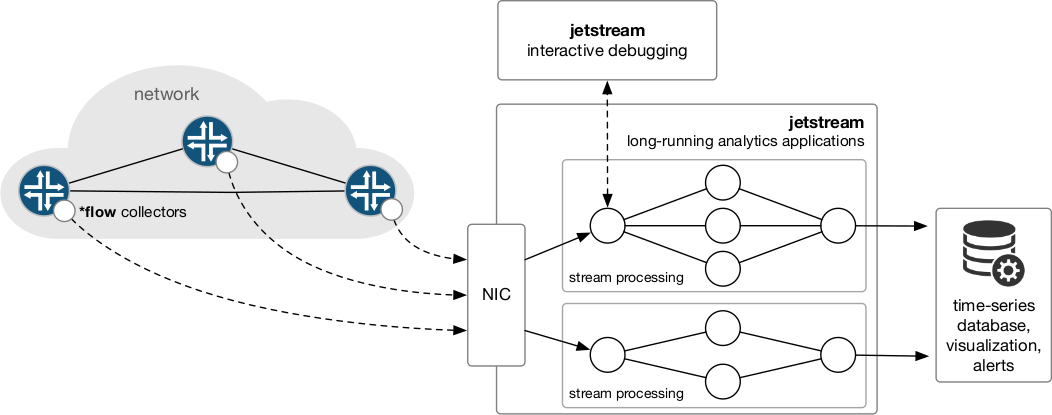 Figure 2 — Overview of an interactive debugging system.
We have developed prototypes for the first two components that are capable of collecting and analysing data-centre scale traffic volumes at per-packet granularity.
*flow — high-performance, hardware-accelerated network telemetry system
For the first component, we introduce *flow, a GPV generator for programmable switches that scales to terabit-rate traffic. Switches generate GPVs by compiling a *flow cache to their forwarding circuits. To utilize limited switch hardware memory as efficiently as possible, we introduce a key-value cache that supports dynamic memory allocation and is implemented as a sequence of P4 match + action tables. In our prototype, the *flow cache is implemented for a 3.2 Tb/s switch with a Barefoot Tofino programmable chip. The cache is compiler-guaranteed to run at line rate and uses a fixed amount of hardware resources regardless of the number or form of measurement queries.
Jetstream — high-performance, software network analytics platform
GPVs generated by *flow are streamed to the second integral component, a high-performance software-based platform for long-running analytics applications. Software provides virtually unlimited programmability and makes modern (machine-learning, for example) network analytics applications possible. Our prototype, called Jetstream, is a software streaming analytics suite specifically optimized for efficient analysis of network packet records at cloud-scale traffic rates.
The key insight for this system is that this domain has fundamentally different characteristics than traditional uses of stream processing:
- While network devices generate records at rates of hundreds of millions of records per second, most applications aggregate data significantly before applying heavyweight data mining or visualization algorithms.
- Although record rates are higher for packet analytics, the records are well formed and smaller, which makes the overall bit rate manageable. Most applications also allow records to be partitioned to effectively leverage multi-core or distributed systems.
- Data for packet analytics comes from one source: the network. We can use kernel bypass technologies to map packet records directly into the analytics system address space, which significantly reduces overhead.
Based on these insights and opportunities, we use a series of domain-specific optimizations to implement Jetstream. We found that existing stream processing frameworks are mostly I/O-bound and cannot handle traffic rates of hundreds of millions of packet records per second. Jetstream is optimized for passing large numbers of small records between a pair of computing steps, sustaining up to 15 million records per second.
Furthermore, we built predefined processing and input/output elements optimized for packet level workloads. We optimized hash-table lookups for subsets of the packet header space. We use direct memory access and kernel bypass technologies to efficiently read network packet records or GPVs directly from an interface. Using these (and other) optimizations, simple Jetstream applications (for example, counting the number of packets per source IP address) sustain up to 6 million packet records per second, per core. Each of these applications scales to around 12 million records per second per non-uniform memory access (NUMA) node. Previous work has shown that multiple independent pipelines of this type can scale linearly with node count.
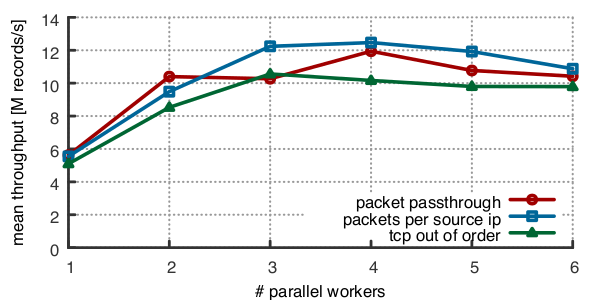 Figure 3 — Throughput for different example applications.
Looking forward
We see many more optimization opportunities for both network telemetry as well as packet-level analytics. Additionally, we believe that interactive network debugging can be an invaluable tool to resolve network issues of various kinds quickly. *flow and Jetstream provide first steps toward solutions for high-performance network telemetry as well as analytics for long-running analytics applications.
More information can be found on the Jetstream project website.
Oliver Michel is a PhD candidate at the University of Colorado-Boulder, working in the Networking and Security Research Group (NSR).
The views expressed by the authors of this blog are their own and do not necessarily reflect the views of APNIC. Please note a Code of Conduct applies to this blog.
We see many more optimization opportunities for both network telemetry as well as packet-level analytics. Additionally, we believe that interactive network debugging can be an invaluable tool to resolve network issues of various kinds quickly.
I belive that the network telemetry is emerging as a powerful way to support these needs. My opinon is the same with you.
Thanks for all..
Thanks for valuable blog sharing really helpful this would definitely helpful keep sharing
thanks for sharing this very good technical knowledge