
As more and more enterprises rely on cloud services, their Internet connectivity becomes a vital part of their daily operations. Besides being highly reliable, the level of performance to access these services is also important.
Monitoring networks for potential performance issues that would hamper access to cloud services is therefore essential.
Monitoring the performance of enterprise networks
Many enterprises monitor their networks using passive measurements techniques such as NetFlow. Although monitoring functions on routers or middleboxes can be convenient from a deployment viewpoint, they miss a lot of information about the performance of the network as they need to infer the state of each connection.
Furthermore, as fully encrypted transport protocols are being deployed — for example, QUIC encrypts transport headers; DNS can run over DTLS or HTTPS — these vantage points will become less and less useful as their visibility will decrease.
Active measurement techniques (probing), on the other hand, pose scalability challenges as the number of services and vantage points to monitor grows, especially if the protocols that are probed require that complex states are maintained.
Instrumenting end hosts
Instead of the above, we propose to exploit information already available on the end hosts themselves in order to monitor network performance.
We collect statistics directly from their transport stacks (for example, the TCP kernel implementation, using eBPF on Linux or EWT on Windows, among others), which are conceptually similar to collecting syslogs. We then serialize and export these per-connection statistics to an IPFIX collector, where we can analyse those traces and compare them across end-hosts, destination prefixes, and protocols.
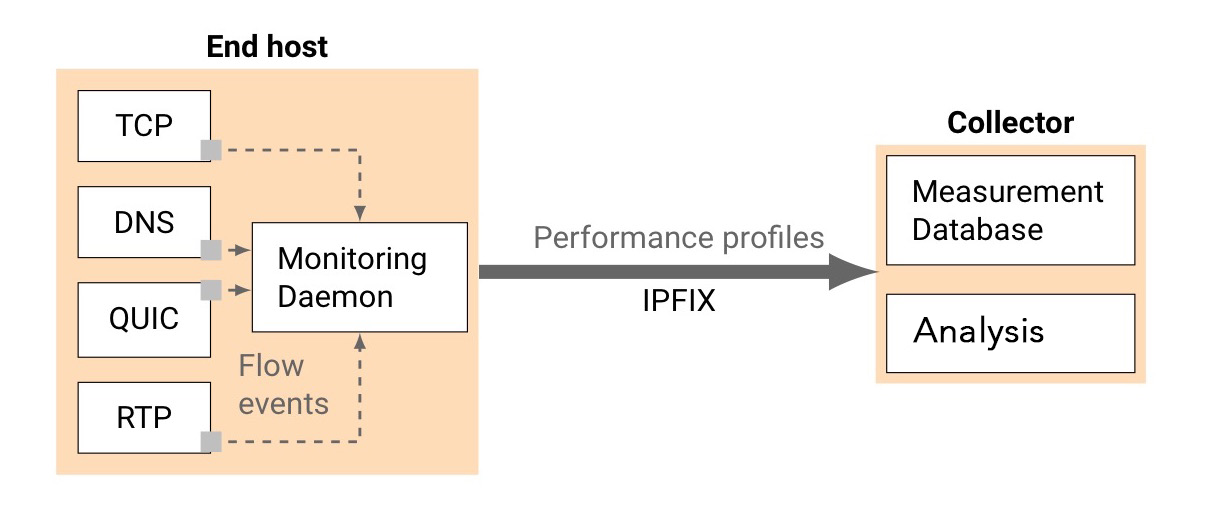
Figure 1 — We instrument end-hosts transport stacks and export generic statistics.
This approach has the benefit of representing exactly what each host actually experiences, for every connection it performs, and transparently supports encrypted and/or multipath protocols.
Defining key performance indicators
Due to the sheer amount of information available about every connection on the end hosts — for example, the content of struct tcp_info — blindly exporting every statistic available will result in more noise than useful information.
Instead, we identify Key Performance Indicators (KPI) that would let us answer high-level questions about the connections, such as:
- How quickly are connections established?
- Are these connections experiencing losses? Packet reordering?
- Do these connections show signs of bufferbloat?
- Is the latency low enough? How stable is it?
For example, answering these questions for TCP requires us to track for every connection:
- How many SYN were sent before receiving the SYN+ACK.
- The transition timestamps in the TCP state machines (for example, recording when the connection moved from SYN_SENT to ESTABLISHED).
- Retransmission timeouts and fast retransmits.
- Out-of-order segments.
- Segments already (partially) acknowledged that indicate bufferbloat.
- The TCP smoothed RTT estimates and jitter.
Detecting network performance problems
We deployed monitoring daemons on student computers in our campus labs that instrument the Linux kernel TCP stack and DNS resolution routines. We mostly confirmed that ‘everything is working fine’ in the measurements, for example, negligible loss rate or reordering, although some unexpected results still showed up.
These hosts are dual stacked, and see more IPv6 traffic than IPv4 — comparing the performances when accessing the same service over both address families is thus a natural analysis.
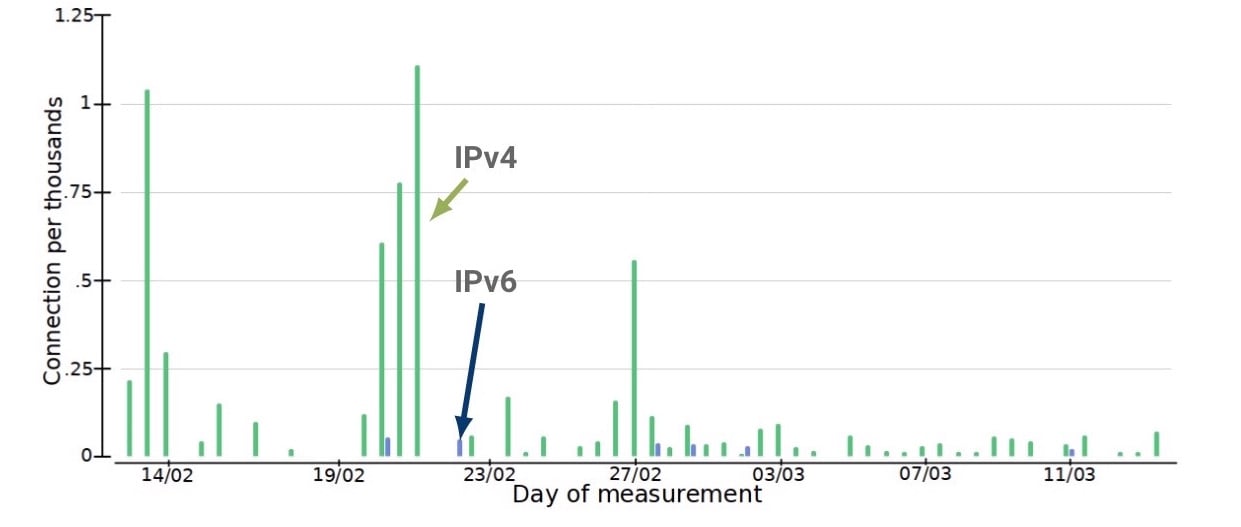
Figure 2 — Comparing TCP connections experiencing more than one lost SYN.
First, comparing the quality of connection establishments showed high discrepancies of initial TCP SYN lost —that is, connections that took more than 1 second — over IPv4 compared to IPv6.
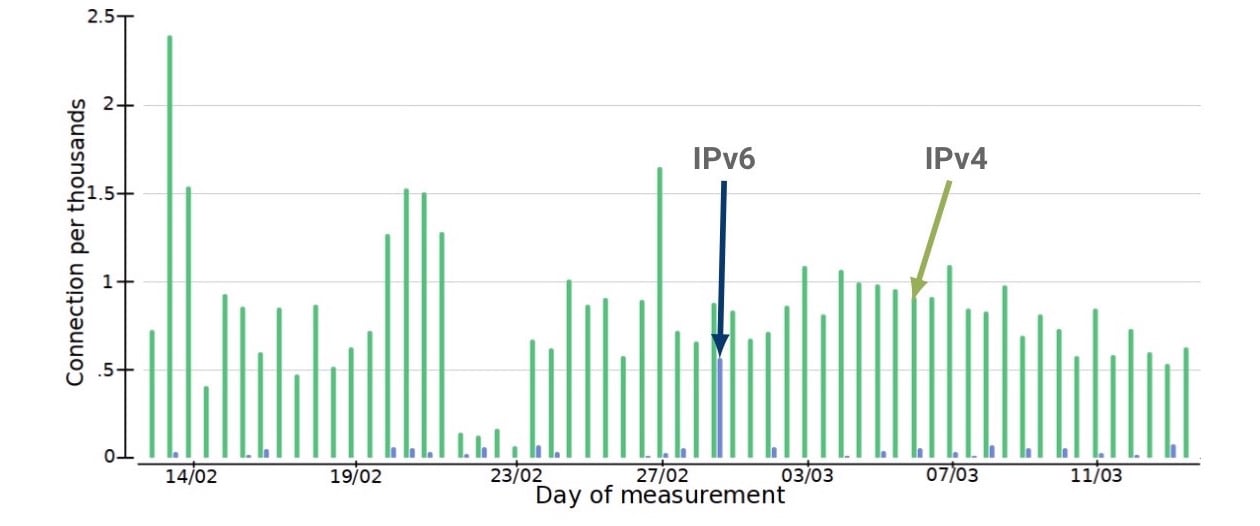
Figure 3 — Querying TCP connections experiencing SYN retransmissions across IPv4/IPv6.
Second, comparing the jitter of those same TCP connections showed that, again, IPv4 performed consistently worse.
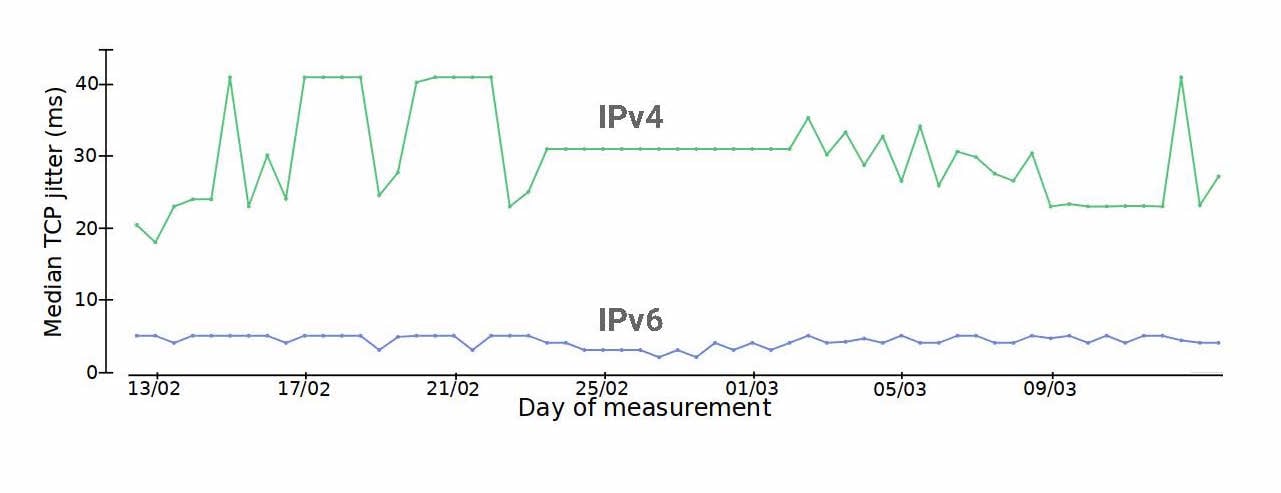
Figure 4 — Comparing median TCP jitters across IPv4/IPv6 and similar destinations.
These performance differences (or issues) are currently small and with little impact so far. Still, as both address families are routed towards our provider over physically separate uplinks, these could be signs that part of our infrastructure currently has an issue processing IPv4 traffic, and will need to be investigated.
Parting thoughts
End hosts know everything about the state of connections. As enterprises own them, leveraging them is an efficient way to monitor the health of a network, compare performances across providers, and quickly spot issues.
This post is a summary of a presentation given by Olivier during the maprg session at IETF 101.
Olivier Tilmans is a PhD student at Université Catholique de Louvain. He is a member of the IP Networking Lab, led by Pr. Olivier Bonaventure.
The views expressed by the authors of this blog are their own and do not necessarily reflect the views of APNIC. Please note a Code of Conduct applies to this blog.