

Internet protocols usually rely on the Transport Security Layer (TLS) to ensure the privacy and integrity of data exchanged over the Internet.
TLS is a cryptographic protocol that sits between the application protocol and the transport protocol. For example, HTTPS is the adaption of HTTP to TLS.
The benefits of HTTPS and other protocols using TLS are considerable, however, the deployment has been impeded by the added difficulty of obtaining and maintaining certificates.
To get a better understanding of TLS adoption in Japan, we monitored common protocols and their TLS-variants by using passive traffic traces captured on a backbone and edge academic network.
We used two different datasets to support our research (referred to as MAWI) as well as a university campus dataset. MAWI is a set of backbone traffic traces, which are collected on a transit link between the WIDE network (AS2500) and an upstream provider. The academic network dataset was captured at the border router located at a university campus. Although both datasets are captured at Japanese academic networks, the topological location and the number of users was quite different.
Key points:
- We analyzed passive traffic traces from a backbone and an edge network in Japan to measure the adoption of TLS for common Internet protocols.
- We found that the percentage of HTTPS web traffic has increased by a factor of 14 in the last ten years, mainly due to the adoption of HTTPS by popular content providers.
- For email traffic we found that IMAP traffic was almost entirely transmitted over TLS, however, most of the SMTP traffic was not using TLS.
Adoption of TLS for the World Wide Web – HTTP vs. HTTPS
Our analysis starts by looking at the adoption of TLS for the World Wide Web. Figure 1 depicts the fraction of web traffic carried by the original protocol, HTTP, and the fraction sent over HTTPS for the two analyzed datasets.
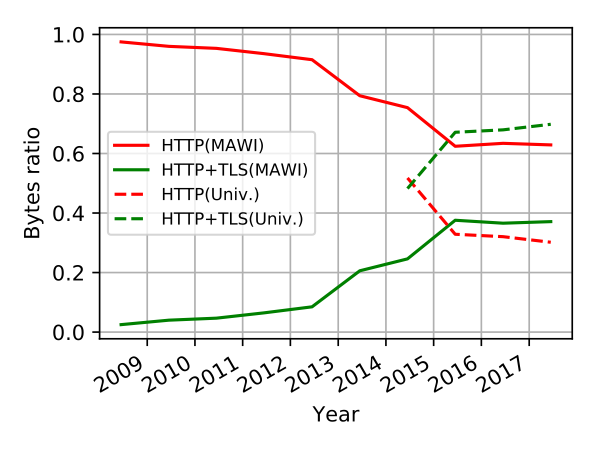 Figure 1 — HTTPS adoption: the relative number of bytes for HTTP and HTTPS as seen in MAWI (solid lines) and at the university campus (dashed lines).
For MAWI in 2008, HTTP protocol accounted for 96% of the bytes transmitted with HTTP and HTTPS. Since 2012, the adoption of HTTPS significantly increased, reaching over 23% in 2014 and 36% in 2017. In very recent traces we observed HTTPS traffic up to 50%.
The university traffic provided more encouraging results. We observed that half of the web traffic was sent by HTTPS in 2014, which increased to over 65% in 2017. However, we found that HTTPS adoption had only slowly increased in this time.
In order to understand the discrepancy between the two datasets, we inspected the IP addresses corresponding to the HTTPS flows.
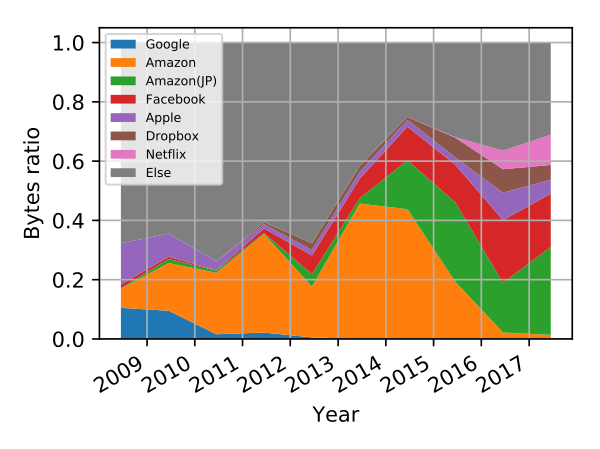 Figure 2 — HTTPS: AS breakdown in MAWI. Major ASes observed for HTTPS traffic in MAWI.
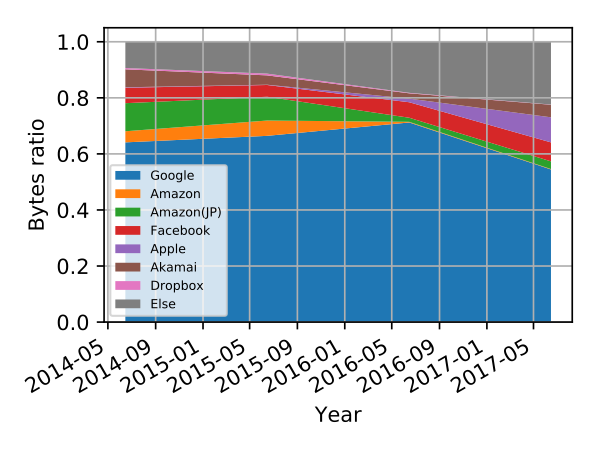 Figure 3 — HTTPS: AS breakdown in the university dataset. Major ASes observed for HTTPS traffic on the university campus.
Figure 2 illustrates the relative number of HTTPS bytes per year for the most prominent ASNs in MAWI. Amazon contributed the most HTTPS traffic in this dataset. Google was one of the main contributors of HTTPS before 2010, but then Google started to directly peer with WIDE, thus Google traffic is not visible anymore on the monitored transit link. The top five ASNs (Amazon, Facebook, Apple, Netflix and Dropbox) accounted for over 65% of the total HTTPS traffic in 2017.
Figure 3 is the ASN breakdown for the university dataset. The main difference between the two datasets is the presence of Google and Akamai traffic. In the university dataset, Google traffic represented over 60% of the monitored HTTPS traffic. This observation emphasizes, even more, the role of large content providers in HTTPS traffic.
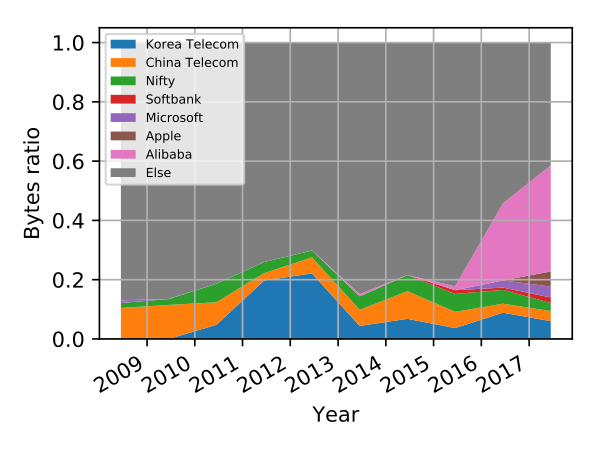 Figure 4 — HTTP: AS breakdown in MAWI. Major ASes observed for HTTP traffic in MAWI.
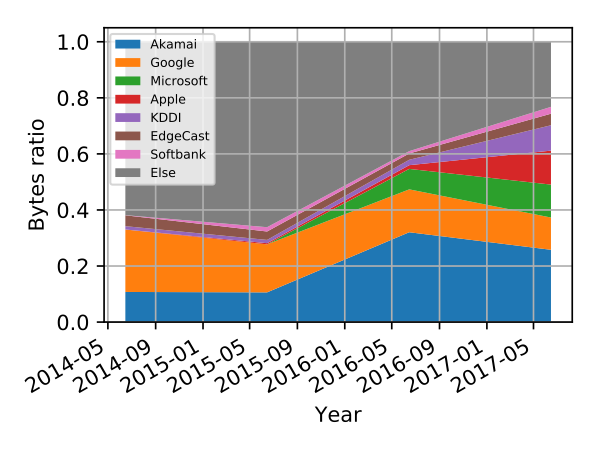 Figure 5 — HTTP: AS breakdown in the university dataset. Major ASes observed for HTTP traffic on the university campus.
We also looked at the AS breakdown for HTTP traffic. Compared to HTTPS, HTTP traffic was dispersed through numerous ASEs. Since HTTP traffic destinations are much more diverse than what we found in HTTPS, migrating the remaining HTTP web traffic to HTTPS would require more effort than what we’ve accomplished so far.
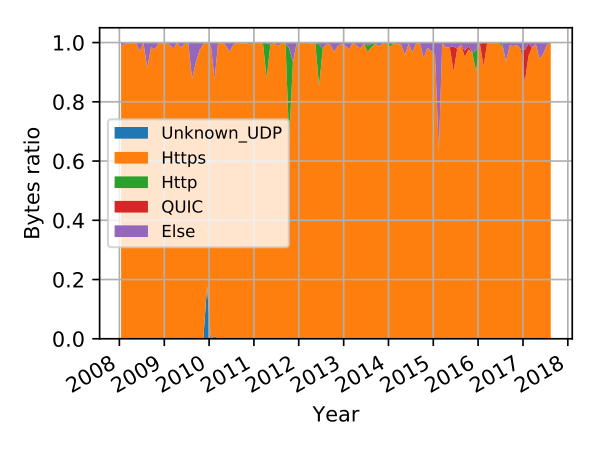 Figure 6 — Application breakdown for traffic on port 443 in MAWI.
 Figure 7 — Application breakdown for traffic on port 443 in the university dataset.
We also investigated other protocols using port 443 (TCP and UDP). For the MAWI dataset, as expected, we observed mainly HTTPS traffic on port 443; less than 5% of bytes are not classified as HTTPS. We observed sporadic HTTP traffic on port 443 as well as the emergence of the QUIC protocol in 2015.
For the university dataset, HTTPS traffic was also dominant, however, we observed more QUIC traffic. This discrepancy is again explained by the lack of Google traffic in MAWI.
Adoption of TLS for other applications – email traffic
Email is transferred via three different protocols: SMTP, IMAP, and POP3.
For both datasets, IMAP+TLS (that is IMAPS or IMAP with STARTTLS) accounts for almost all of the traffic.
For POP3 in MAWI, we observed a decreasing trend for the TLS-variants. We consider that users are moving away from POP3 and adopting either IMAP or web-based interfaces. For the university dataset, most users are using POP3S.
For SMTP in MAWI, the adoption of TLS has been slowly increasing since 2009. For the university dataset, the ratio of the TLS-variants was also usually lower than 50%. Therefore, SMTP is one of the protocols that had the lowest TLS adoption in our results.
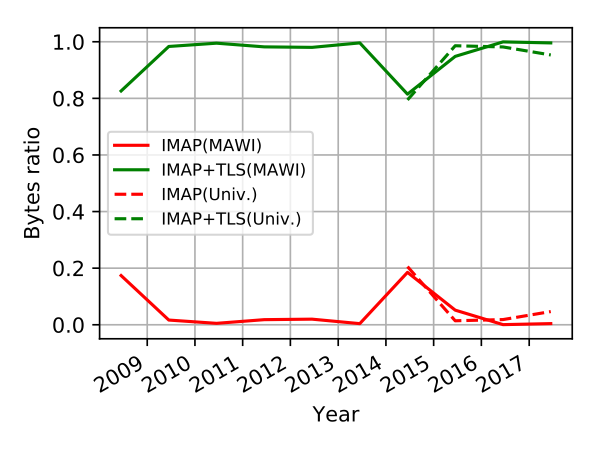 Figure 8 — TLS adoption for IMAP: the relative number of bytes for IMAP and IMAP+TLS (implicit and explicit TLS variants) as seen in MAWI (solid lines) and at the university campus (dashed lines).
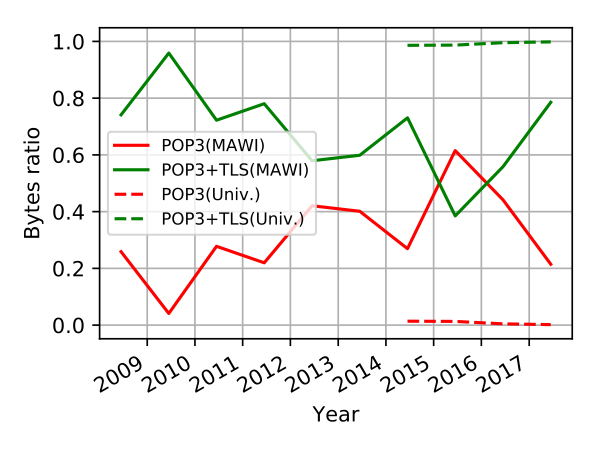 Figure 9 — TLS adoption for POP3. The relative number of bytes for POP3 and POP3+TLS (implicit and explicit TLS variants) as seen in MAWI (solid lines) and at the university campus (dashed lines).
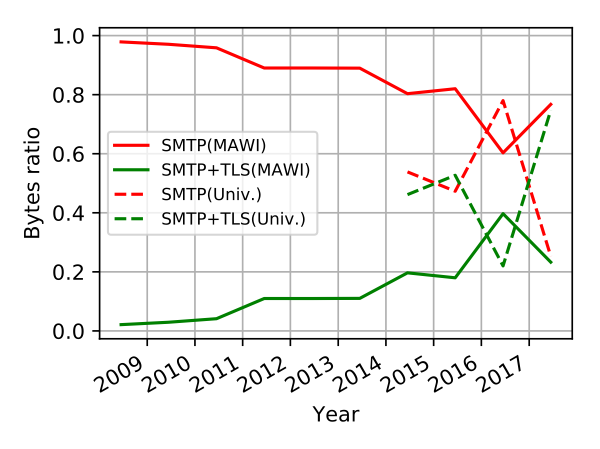
Figure 10 — TLS adoption for SMTP. The relative number of bytes for SMTP and SMTP+TLS (implicit and explicit TLS variants) as seen in MAWI (solid lines) and at the university campus (dashed lines).
To learn more about our research, please read our paper Monitoring TLS Adoption using Backbone and Edge Traffic [PDF 225 KB], which we presented at the Global Internet Symposium 2018. And let us know how TLS adoption is progressing in your economy in the comments section below.
Chia Ling (Jolin) Chan is an undergraduate student at Waseda University and a research assistant at IIJ Research Lab in Japan.
The views expressed by the authors of this blog are their own and do not necessarily reflect the views of APNIC. Please note a Code of Conduct applies to this blog.