

IX Australia recently invested a significant amount of work to re-architect and design a new platform for its metrics to provide network insights to our operations team and members.
We wanted to collect and store the highest resolution of information as possible in a scalable and high-performance way without adding operational overheads. It was crucial that our technology stack be automated such that repeatable and consistent results are achieved across the board. Lastly, it was imperative that whatever infrastructure is built must have a high level of resilience when faced with partial or complete network segregation – monitoring data should be treated like any other production information and designed accordingly.
The following post provides some context on our past and new technology stacks, and our future plans for monitoring.
Existing technology stack
For the past five years, we have used Cacti to poll network devices on a five-minute interval and generate the appropriate averages for per-interface input and output traffic. There was a completely separate Cacti instance per IX, ensuring that network segregation would not result in loss of real-time data, limiting aggregation and analysis across IXs.
A custom script pulled route metrics from our Bird route servers to track per-peer accepted and filtered routes as well as totals.
Cacti stores data in RRD files – a well known and time-tested means of storing time series data on disk. Unfortunately, RRDs come with their own limitations:
- RRDs keep data for a given period then aggregate that data into larger averages for long-term storage. High-resolution data is discarded, which reduces historical accuracy.
- Aggregating data over a large number of interfaces is cumbersome and requires manual edits to RRD rules, for example per-IX aggregate traffic volume graphs.
To overcome these limitations and expand our visibility we designed and implemented an expanded system for collecting, storing and analyzing high-resolution metrics.
New technology stack
The following digram shows how we designed our new technology stack — see below for a description of the software and why we chose it.
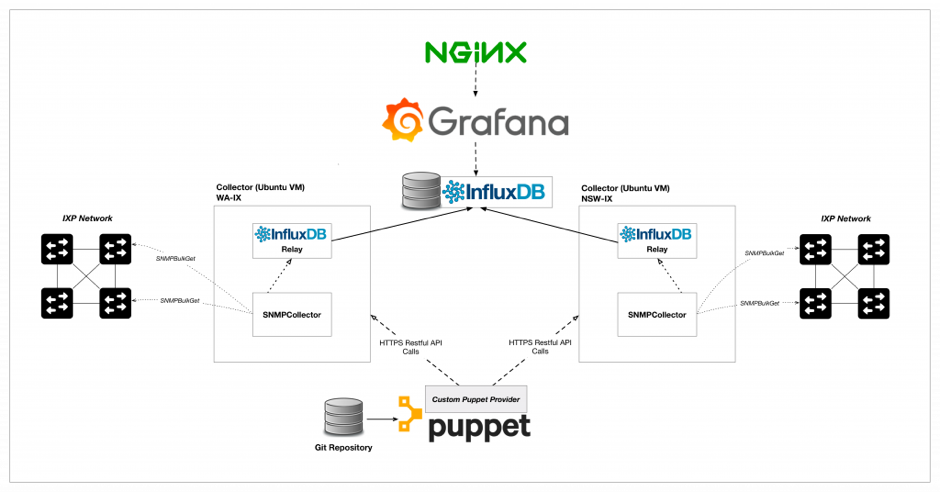
InfluxDB
For time-series storage, we chose InfluxDB, due to it being an open source product and its relative maturity amongst the recent wave of tag-based time-series storage engines. InfluxDB allows for fast metric queries based on arbitrary tags using an SQL-like syntax. InfluxDB also includes an array of mathematical and statistical functions for data analysis.
InfluxDB-Relay
To ensure resiliency, each collector has a local InfluxDB-Relay instance that acts as a local buffer and automatically reattempts metric delivery if the central metric store is unavailable – this is very useful for software updates and security patches requiring reboots and service restarts of the central store. The relay service can also be configured to deliver metrics to multiple backends in an HA configuration.
SNMPCollector
Thanks to the contributors of a fantastic xolang-based open source project SNMPCollector. This project consists of a single golang binary that provides a configurable and high-performance SNMP poller that pushes results to InfluxDB. Most importantly, this project has a RESTful API as a first-class citizen making it ideal for automation workflows.
Telegraf
Telegraf is another open source product with a modular, plugin-based model for collecting host metrics and reporting them to InfluxDB. There is a wide range of plugins to support most applications with many community pull requests pending with new ones. Telegraf also has an in-built buffering and retry mechanism such that loss of connectivity to InfluxDB will cause metrics to buffer. Telegraf is installed on every single server and uses an appropriate list of plugins. Using the ‘exec’ plugin and the Bird-Tools binary, custom metrics can be reported in InfluxDB Line Protocol for per-peer route server metrics.
Grafana
Grafana is quickly becoming the standard for metric display and analysis. This JavaScript and golang-based web app provides a powerful interface for interacting with many types of storage backends, displaying useful information in a clear and concise way. Grafana also has a vibrant plugin community with new plugins for datasources, panels, and shared dashboards.
Puppet
IX Australia already uses Puppet for configuring automation tasks on our systems, so it was a natural choice to extend Puppet to this metric’s solutions. SNMPCollector required a custom module to be developed as well as a module for InfluxDB-Relay. All configuration for metrics, devices, tagging and application configuration is maintained in Hiera YAML and Puppet ensures every SNMPCollector instance is consistent.
Design
Each IX had an independent monitoring stack, manually configured to collect metrics and display basic per-port graphs and per-ASN route statistics.
The new architecture is much more distributed with a Ubuntu VM for each IX acting as a collector and reporting metrics back to a central store.
Buffering mechanisms have been implemented to prevent the loss of metrics during potential outages – metrics are kept on the collector until connectivity is restored.
This design allows for metric aggregation and analysis across IXs rather than having independent graphing instances. We’re now more easily able to see trends across IXs and display all peering ports and route information on the one page.
We have made the dashboards like the one displayed below public to our members and are asking them for feedback on what metrics they’d like to see.
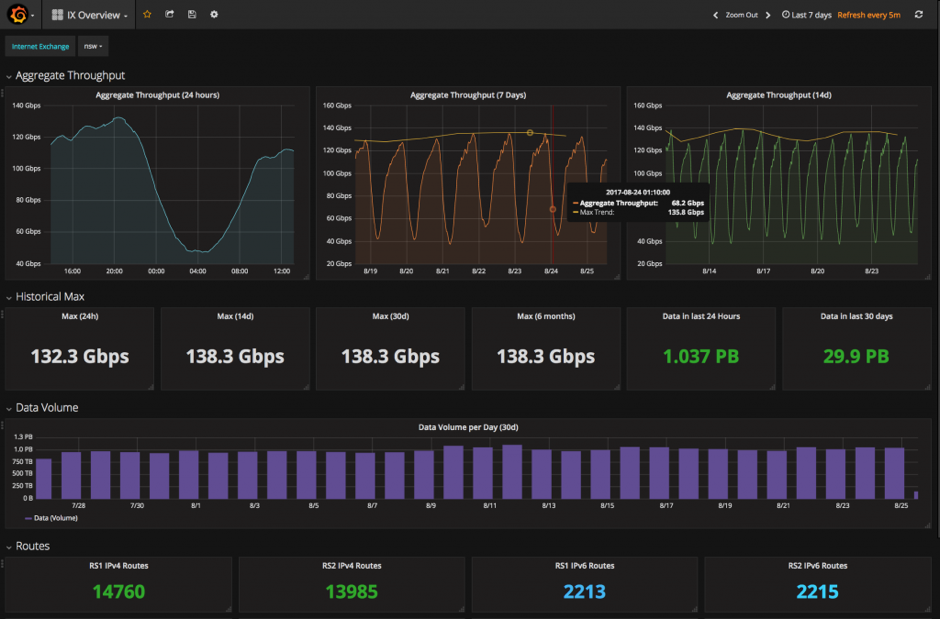
IX Australia IX Overview Dashboard
Future Work
Going forward, we want to provide better metrics and insights for members with integration of this stack with the members portal. Future draft improvements include:
- Optic transceiver statistics
- Interface state change alerts
- Detailed traffic stats (max, min, volume) per interface
- Route churn statistics
- Detailed filtered route lists
If you have any questions about this project feel free to post them below, or contact us at nox@ix.asn.au.
This is an adapted version of a post that was published by IX Australia.
Tim Raphael is a Peering Engineer at Internet Association of Australia Inc.
The views expressed by the authors of this blog are their own and do not necessarily reflect the views of APNIC. Please note a Code of Conduct applies to this blog.
Great! work there, it can be used as a model by IX providers who wanted to provide analytics to their members.
I hope the dashboard can be customized to provide more details like:
1. Traffic per peering connections
2. Number of prefixes between members
3. Traffic utilized per as-path? etc.