
If you’re managing a network it’s important to measure your traffic and usage patterns.
Say, for instance, you are responsible for upgrading your bandwidth capacity. You may ask yourself:
- Do I increase capacity from my existing provider; or
- Do I subscribe to a new transit provider – in which case, what do I need to consider about peering; or
- Do I follow my competitors/the market and see what they are doing – in which case I would need to consider what data and statistics I’ll need to make my decision; or
- Do I go with the default option, with the cheapest transit?
Without having sufficient data, it’s very difficult to make a well-informed decision, let alone justify it.
Unfortunately, there isn’t any single application or tool that measures everything for you. So, based on your requirements and skill sets you’ll need to use several different tools.
One tool that will help you measure your traffic analysis is AS-Stats. It is a simple tool to generate per-AS traffic graphs from NetFlow/sFlow records.
Let’s go through the process of how you can install the tool and analyse the output.
Getting started with AS-Stats
You can download AS-Stats at Github, where they have documentation explaining all the prerequisites and the installation process. Below is a quick guide to the commands you need to use to run AS-Stats in your network.
For the installation, I am using Ubuntu 14.04.5 LTS.
1. Install the dependencies:
apt-get install librrds-perl librrd-dev rrdtool apache2 php5

make gcc git libapache2-mod-php5 php5-mcrypt -y
The program comes with a default Perl installation, but you may need to install a few extra Perl modules. Check them from cpan:
# cpan install File::Find::Rule

# cpan install Net::sFlow

# cpan install IO::Select

# cpan install IO::Socket

# cpan install Scalar::Util
Download AS-Stats from github:
# cd /opt/

# git clone https://github.com/manuelkasper/AS-Stats.git
Put all the config and rrd files in an /opt/AS-Stats directory:
# cd /opt/AS-Stats
Create a “known links” file with the following information about each link that you want to appear in your AS stats. We can use the sample knownlinks file and modify it:
# vi /opt/AS-Stats/conf/knownlinks
Delete all sample config and add the following line (replace 198.51.100.1 with your router IP).
# Router IP SNMP ifindex[/VLAN] tag description color sampling rate
198.51.100.1 1 uplink uplink A6CEE3 1
Get the SNMP index from your router. In this case, we are generating a graph on interface GigabitEthernet0/0/0, that’s why we use Ifindex 1 in the knownlinks file.
router-core01#show snmp mib ifmib ifindex

GigabitEthernet0/0/0: Ifindex = 1

GigabitEthernet0/0/2: Ifindex = 3

VoIP-Null0: Ifindex = 6

Loopback0: Ifindex = 8

Null0: Ifindex = 7

GigabitEthernet0/0/1: Ifindex = 2

GigabitEthernet0: Ifindex = 5

GigabitEthernet0/0/3: Ifindex = 4
Create a directory to hold the per-AS RRD files:
# mkdir /opt/AS-Stats/rrd

# chmod 0777 /opt/AS-Stats/rrd
Now run the AS-Stats:
# nohup /opt/AS-Stats/bin/asstatd.pl -P 0 -p 9000 -r

/opt/AS-Stats/rrd -k /opt/AS-Stats/conf/knownlinks &
Check the process:
# ps -ef
root      24554    605  0 15:12 ?        00:00:00 /usr/bin/perl -w

/opt/AS-Stats/bin/asstatd.pl -P 0 -p 9000 -r /opt/AS-Stats/rrd -k

/opt/AS-Stats/conf/knownlinks
By default, asstatd.pl will listen on port 9000 (UDP) for NetFlow datagrams, and on port 6343 (UDP) for sFlow datagrams. Here we only enable NetFlow.
# netstat -na
udp 0 0 0.0.0.0:9000 0.0.0.0:*
Now we will forward the flow. For this example, we will use the Flexible NetFlow command:
flow exporter AS-STATS

destination 198.51.100.27 !ip address of as-stats server

source GigabitEthernet0/0/0

transport udp 9000

!

flow monitor IPV4-AS-STATS

exporter AS-STATS

cache timeout active 300

cache entries 16384

record netflow ipv4 as

!

flow monitor IPV6-AS-STATS

exporter AS-STATS

cache timeout active 300

cache entries 16384

record netflow ipv6 as

!

sampler AS-STATS-SM

mode random 1 out-of 10000

!

interface GigabitEthernet0/0/5

ip flow monitor IPV4-AS-STATS input

ipv6 flow monitor IPV6-AS-STATS input

!
After three to four minutes, you should see RRD files popping up in the /opt/AS-Stats/rrd folder. If you don’t, try checking with tcmdump. The following filter will help you to get the desired output.
# tcpdump -n dst port 9000 -vv
tcpdump: listening on eth0, link-type EN10MB (Ethernet), capture

size 65535 bytes

13:35:40.971315 IP (tos 0x0, ttl 250, id 3815, offset 0, flags

[none], proto UDP (17), length 168)

198.51.100.1.50293 > 198.51.100.27.9000: [udp sum ok] UDP,

length 140

13:35:41.971506 IP (tos 0x0, ttl 250, id 3816, offset 0, flags

[none], proto UDP (17), length 112)

198.51.100.1.50293 > 198.51.100.27.9000: [udp sum ok] UDP,

length 84

13:35:42.971845 IP (tos 0x0, ttl 250, id 3817, offset 0, flags

[none], proto UDP (17), length 256)

198.51.100.1.50293 > 198.51.100.27.9000: [udp sum ok] UDP,

length 228
Add a cronjob to run the following command (preferably every hour).
/opt/AS-Stats/bin/rrd-extractstats.pl /opt/AS-Stats/rrd

/opt/AS-Stats/conf/knownlinks /opt/AS-Stats/asstats_day.txt
2. Enable the web interface:
Enable the web interface to see all the graphs:
# cp -r www/ /var/www/html/as-stats/
Edit config.inc and set all the paths especially $rrdpath, $daystatsfile and $knownlinksfile.
# vi /var/www/html/as-stats/config.inc
$rrdpath = "/opt/AS-Stats/rrd";

$daystatsfile = "/opt/AS-Stats/asstats_day.txt";
$knownlinksfile = "/opt/AS-Stats/conf/knownlinks";
Now, wait a few minutes to get enough flow data to generate your graphs. When ready, you can browse the web interface:
http:// 198.51.100.27/as-stats/
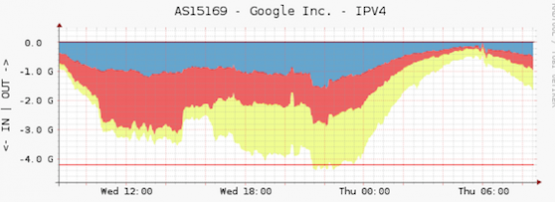
The initial page will show you the Top 20 AS datasets for the last 24 hours.
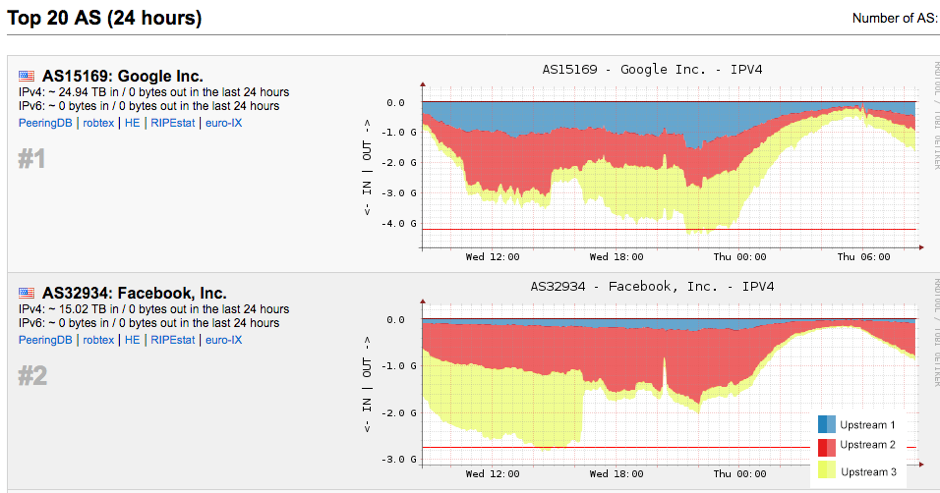
If you look at the graphs above, most of the traffic is sent to Google and Facebook and the bandwidth is distributed among each upstream. You can check “View an AS” and search with specific ASN.
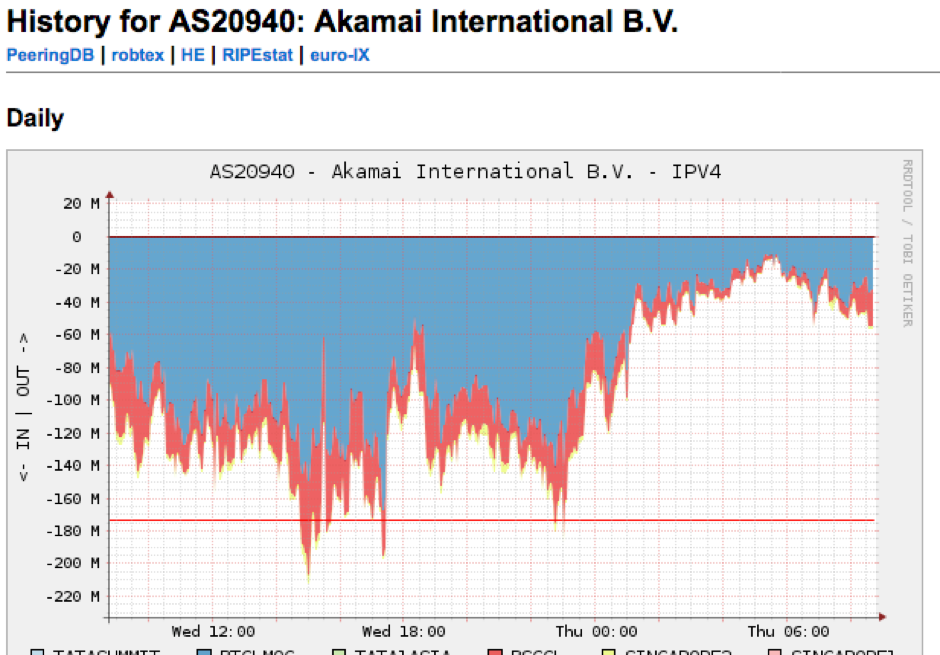
Below is another example, this time of AKAMAI (AS20940):
You can also search with AS-SET.
What next?
Now you have a better understanding of your traffic and whether you need to deploy new circuits or upgrade existing ones. But what about peering?
Most large content providers do peering, some private and some public. But how do you connect with them?
PeeringDB is your answer. Using this free tool, you can search for and find the peering policy of certain ASNs. You can also get a list of locations of where they will peer, along with all contact details associated with the ASN.
Peering has never been so easy (or comfortable)!
The views expressed by the authors of this blog are their own and do not necessarily reflect the views of APNIC. Please note a Code of Conduct applies to this blog.
Excellent article, the most complete material on AS-Stats, what version of Ubuntu 32 or 64 bits?
Glad to know that you like it. It’s Ubuntu 64 Bits Ubuntu 14.04.5 LTS
Linux as-stats 4.2.0-27-generic #32~14.04.1-Ubuntu SMP Fri Jan 22 15:32:26 UTC 2016 x86_64 x86_64 x86_64 GNU/Linux
very helpful Post and great Artice I am using Ubuntu 32
Hello Fakrul, You are genious and also a gennie for us. Your article is very informative and very helpful for our business. I completed and cleared all the steps in your post still my nohop.out discloses “Couldn’t be a NetFlow UDP server on port 9000 : IO::Socket::INET: Address already in use”. I am not able to resolve this issue. I would be very greatful to you if you can help myself.
Thanks & Regards,
Hello Samir,
Thanks for your feedback. Regarding the error, could you try running netflow in different port; like 9010. What is the output of “netstat -na”. Looks like some service holding the socket 9000.
Hi,
Thanks for the guide above.
i’ve setup mine and dont see any graph loading.
when i check the www log it show below;
[Wed Mar 08 18:47:40.428385 2017] [:error] [pid 11236] [client 1.1.1.1:53127] PHP Warning: fopen(/data/as-stats/asstats_day.txt): failed to open stream: No such file or directory in /data/as-stats/www/linkgraph.php on line 26, referer: http://x.x.x.x/as-stats/linkusage.php?numhours=24
seems like i dont have asstats_day.txt and also peerasstats_day.txt files.
anything i miss?
BTW,im using centos.
Lee
Hi,
the problem solve after change the file config.inc below;
/data/asstats/ ==> /data/as-stats/
Hi Lee,
glad to know that. ‘-‘ makes a big difference.
Good evening ,
I am a new Brazilian in networks, I am trying to implement AS-Stats in Debian 8.
I’m finding it difficult, could you help me?
First doubts:
Can I instantiate AS-STATS on an external server and fetch this data on the router I want?
Or does this only work where it’s installed?
Thanks
Hi Fakrul,
what is the interface GigabitEthernet0/0/5
ip flow monitor AS-STATS input
is it the southbound interface? what is the direction?
also it is not taking AS-STATS but showing options
IPV4-AS-STATS or IPV6-AS-STATS
Thanks/DP
Hi DP,
It should be
interface GigabitEthernet0/0/5
ip flow monitor IPV4-AS-STATS input
ipv6 flow monitor IPV6-AS-STATS input
and GigabitEthernet0/0/5 is the interface connected to the upstream.
root@ubuntu:/opt/AS-Stats# nohup /opt/AS-Stats/bin/asstatd.pl -P 0 -p 9000 -r /opt/AS-Stats/rrd -k /opt/AS-Stats/conf/knownlinks &
[1] 1315
root@ubuntu:/opt/AS-Stats# nohup: ignoring input and appending output to ‘nohup.out’
I followed all the steps, but as-stats only show as23456,
the asn of my isp is 16 bits and my asn is 32 bits
Hello Ramon,
Your bgp routeur have one default route and not full view.
Hello matou801, sorry for reply late, yes in my case I don’t have full routing.
Thanks for your clarification.
have any one successfully deployed it for Mikrotik RouterOS ? Kindly share your experience.
https://blog.remontti.com.br/5129 AS-Stats is mikrotik
Hello Sir, I have done all the configuration but wont be able to enable the web interface for netstat. Kindly help! I am new to ubuntu.
Regards
Hello all,
Everything is working perfectly, but recently we change the link form 10g to 100g (juniper) failed to get graph. any one have faced similar issue with 100g link with juniper router.
Regards
Srijan
Unfortunately, the graphs/statistics shown are not matched against our actual capacity.
Let’s say, we have 10G Upstream Capacity, but traffic graphs are just 100 Mbps, for example.
Is there any limitation or any suggestion? We are running AS-STATS on VM and our router is Cisco NCS 5510.