

In 2016, IPv4 exhaustion is on everyone’s lips: four out of five Regional Internet Registries have run out of freely available address space.
As a result, the number of new allocations has stagnated, address markets have taken off, and address sharing mechanisms (for example, Carrier-Grade NAT) are on the rise as operators try to squeeze the most out of their IPv4 address space.
But what is really happening in the IPv4 address space? Measuring address space activity at scale is difficult. There’s really no single vantage point that can capture all the activity.
In our most recent IMC paper, ‘Beyond Counting: New Perspectives on the Active IPv4 Address Space’ (preprint), we study global IPv4 address activity from a vantage point that gives us a fairly good visibility into global IP address activity: the server logs of one of the largest CDNs, which serves more than 3 trillion requests worldwide on a daily basis. Of course, our dataset likely has modest visibility into IP address ranges assigned to servers and infrastructure (we assess the visibility and coverage of our dataset in detail in our paper), but enables us to show a detailed picture of client activity in the Internet. It captures activity from 1.2 billion unique IPv4 addresses in 2015 – the highest number ever reported, in agreement with recent estimates on global address space usage.
We were, first, curious to see just how many IPv4 addresses can be seen as active from this vantage point and how this has developed over time. Here, we made a stunning observation:
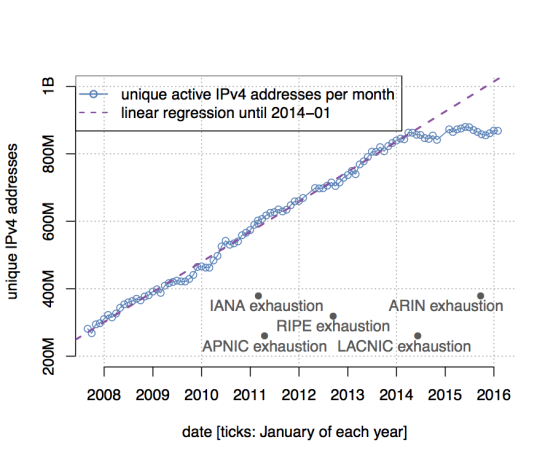
For each month, starting in late 2007, we counted the number of unique active IPv4 addresses. An active IPv4 address refers to a client address that successfully fetched at least one object from the CDN platform over the course of the given month.
The most compelling takeaway from this figure is that after many years of constant growth (see the almost perfectly linear growth!), we see a sudden stagnation in the number of active IPv4 addresses in early 2014. Subsequently, the count of active IPv4 addresses remains nearly constant. It seems we have entered a new era of the IPv4 address space in which just enumerating active IPv4 addresses is of little help to characterize Internet growth. When looking over the entirety of 2015, we see:
1.2 billion active IPv4 client addresses, 6.5 million active /24 blocks. This is about 42% of routed IPv4 addresses and about 59% of routed /24 blocks.
Assuming that the growth in active address counts continues to stagnate, we can assume that these numbers might only marginally change in the foreseeable future.
Stagnating IPv4 counts: End of story?
Did we tap the full potential of the IPv4 address space and are now left with our 1.2 billion active IP client addresses? Not quite.
Having a closer look at the active IPv4 addresses in 2015, we made an interesting discovery: while the number of active IPv4 addresses is stagnant, the set of active IPv4 addresses constantly changes. When comparing day-to-day activity, we see that every day about 7% of the IPv4 addresses contacting the CDN change. Surprisingly, when comparing subsequent weeks or even months, we always see a constant churn of about 5% of active IPv4 addresses. When looking at this over the course of an entire year, the changes in IPv4 address population look like this:
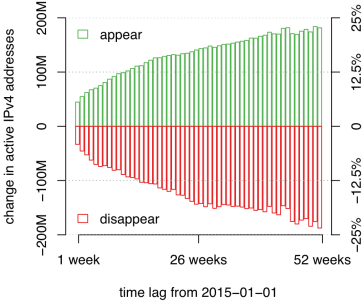
The figure above shows the difference in the active IPv4 address population when setting the first week of 2015 as a reference point. For each subsequent week, we show the number of newly active IPv4 addresses (they were not active in the first week, but are in the subsequent), as well as those addresses that were active in the first week, but not in a subsequent week. That means that almost a quarter of the active population of IPv4 client addresses has changed over the course of one year. Thus, despite stagnation, the population of active IPv4 addresses is far from constant.
Introducing the ‘address activity matrix’
In an attempt to understand the root causes behind this massive churn, we next created what we call the address activity matrix.
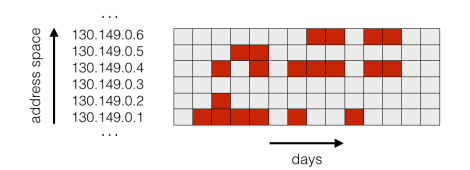
We sort IPv4 addresses in increasing order and then for each day, we draw a red dot if the IP address was active on that day. Otherwise, the field is grey. Let’s have a look at what this matrix looks like for a real-world network:

This figure shows over the course of four months the address activity matrix for 20,000 adjacent IPv4 addresses within a university network. We see a striking variety of activity patterns by just looking at this tiny portion of the active address space. Different addressing mechanisms, user behaviour, seasonal effects, and network restructuring heavily affect use within address blocks.
Address space use in depth
It is fairly well known that large portions of the IPv4 address space seem unused on the Internet (that is, unrouted, globally) or they are routed but do not show any activity. However, little is known about the use of already active address blocks.
Based on the activity patterns we saw in our matrix, we were interested in studying address use. How well are we doing with regard to making use of already active IPv4 address space? To study this we first culled regions of the address space that had a major change in their activity during our measurement period (for details, please see the aforementioned paper).
In situ address activity: assignment practice and user
The remaining address blocks show (what we call) in situ activity. Meaning, activity patterns in these address blocks are the result of their unchanged, regular operation and result from a combination of address assignment practice and the behaviour of the users or hosts residing in the respective blocks.
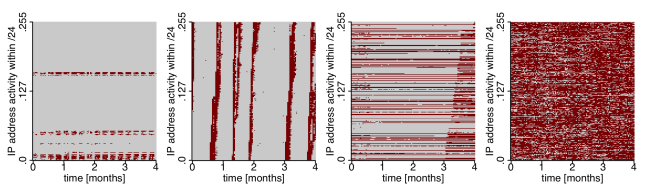
The figure above shows four common examples of such in situ address activity. The figure on the far left shows an example of a statically assigned address block, where hosts are assigned a fixed IP address. The three other examples show various incarnations of dynamic addressing (for example, DHCP). All these examples are active address blocks, yet their use clearly varies dramatically.
Statically assigned address blocks: Vacant IP addresses
Studying our matrix, we observe that large portions of the address space show only a few active IPv4 addresses in a given block. That is, we see activity from an IP address, but neighbouring IP addresses do not show any activity at all (meaning no single request was issued to the CDN in four months).
We found that these sparsely populated address blocks are heavily correlated with the use of static addressing. To isolate this, we used names from reverse DNS PTR records to tag some address blocks as likely static or dynamic. We then check the number of active IP addresses within each /24 block for our two tagged datasets.
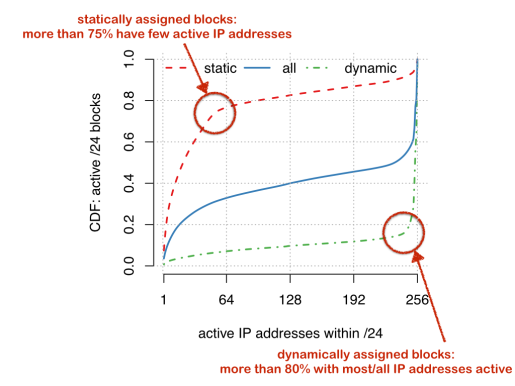
The figure above shows a CDF of the number of active addresses for blocks tagged as static and dynamic, as well as for our entire dataset. We find a stark difference in terms of use when comparing address blocks that are likely statically assigned to address blocks that are dynamically assigned (for example, via DHCP).
Statically assigned address blocks often show activity only for a small fraction of the contained addresses. We find that more than 75% of statically assigned address blocks show less than a quarter of the contained addresses as active. Most dynamic address blocks, on the other hand, show activity for most or all contained IP addresses.
Comparing our two tagged datasets to the entirety of the active address space (blue line in the centre), we see that more than 30% of all active blocks show less than a quarter of their IP addresses as active and that only about 40% show all their contained addresses as active.
Dynamic addressing: Pool size matters!
Dynamically assigned address blocks, of course, do well at some times using each available IP address. However, their degree of utilization over time varies heavily. We see instances of DHCP address assignments, where most IP addresses are vacant for most of the time. You can see several round-robin pools in our university network (figure above) – a stunning example of how address use varies over time across different pools.
To study utilization of dynamic address blocks, we introduce the metric of spatio-temporal utilization: For each block, we divide the number of active days and IP addresses by the maximum possible activity for that block. That is, visually, we divide the red portions of our matrix by the (red + grey) portion. Considering the address blocks that are likely dynamically assigned and by plotting their spatio-temporal utilization, we see the following:
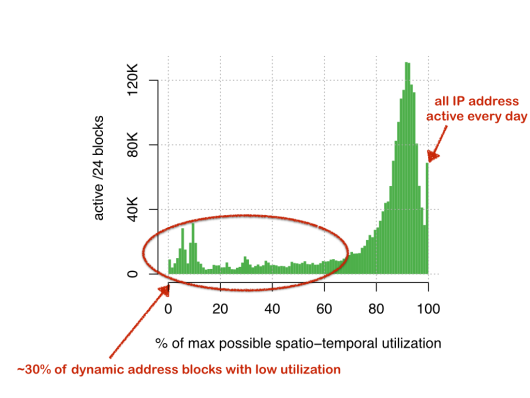
A large majority (about 70%) of these address blocks show a relatively high utilization, above 80% of the maximum. For some 70,000 address blocks (far right), we even see 100% utilization – address blocks assigned to gateways, for example, connecting cellular mobile users. But we also see that about another 30% of these address blocks show room for improvement, having utilization of below 60%.
Utilization potential
Using a back-of-the-envelope calculation, we find more than 1.5 million /24 address blocks with fewer than 64 active IP addresses. While network restructuring can be cumbersome, it could certainly provide significant IPv4 address space utilization potential. We find 400,000 /24 address blocks that are likely dynamically assigned, but with low spatio-temporal utilization. For these address blocks, freeing up address space might be as simple as changing DHCP configuration parameters.
Outlook
The stagnant active IPv4 client address counts, despite ongoing Internet growth, mark a new era of the Internet: one in which Internet growth cannot be tracked by counting active IPv4 addresses anymore. Tackling the IPv4 address space shortage can – and must be – accomplished using a variety of different mechanisms.
Our study gives a glimpse of what IPv4 activity looks like now and hints towards some improvements. Given today’s Internet comprises networks that operate IPv6 while others continue to operate only IPv4, we are most certainly in a complex and costly predicament, foreseen but unavoided. Our hope is to inform the coming decisions about changes that we must make to continue to grow the Internet.
Philipp Richter is a PhD student in the INET group at Technische Universität Berlin. His ongoing research centres around Internet topology measurements, routing, and traffic classification.
The views expressed by the authors of this blog are their own and do not necessarily reflect the views of APNIC. Please note a Code of Conduct applies to this blog.