

This is an update of an article published in November 2015 – Examining IPv6 Performance. The update describes a new reporting tool that can show the performance of IPv6 relative to IPv4 at both a country-by-country level and a network-by-network level.
Every so often I hear the claim that some service or other has deliberately chosen not to support IPv6, not because of some technical issue, or some cost or business issue, but simply because the service operator is of the view that IPv6 offers an inferior level service as compared to IPv4, and by offering the service over IPv6 they would be exposing their clients to an inferior level of performance of the service.
But is this really the case? Is IPv6 an inferior cousin of IPv4 in terms of service performance?
Let’s try and answer that question by using measurement. In this article I’d like to report the results of a large-scale measurement of IPv4 and IPv6 performance looking at the relativities of IPv6 and IPv4 performance.
What is “Performance”?
In networking the term “performance” can have many aspects. Often we might characterize a network’s performance by its sustained carrying capacity, or bandwidth, or by its end-to-end delay, or its level of delay variation or jitter. Each of these parameters could affect an application’s performance. A large scale data transfer is affected by carrying capacity and by end-to-end delay, while a raw encoding of a voice or video stream could be more sensitive to jitter than to the end-to-end delay.
That’s a large collection of elements that can affect the network transaction. We can reduce this somewhat by refining the question. If we have two sessions running between the same endpoints, using the same end-to-end transport protocol and using the same applications at each end, performing the same transaction at much the same time, and we vary only the underlying IP protocol used by these two sessions, then to what extent do we see differences in performance?
There appear to be two readily measurable aspects of performance that can vary between the two protocols with the same endpoints that will impact on the end result.
The first is the reliability of the protocol in the face of active middleware. Are all connection attempts successful? Do we observe a higher connection failure rate in one protocol or the other? Is there middleware deployed on the network path that is dropping IP packets based on the IP protocol?
The second is path variation. A change in IP protocol may produce a change in the network path used by the packet.
As an illustration of this protocol-related path change, I’ve reproduced below two traceroute logs between the same two endpoints, taken at much the same time of day, varying only the IP protocol used between versions 4 and 6. The first traceroute starts from a system located in Singapore, and the target is a host located in Canberra, Australia. The second performs the same operation in the opposite direction. Both hosts are dual stack and there are a number of dual stack network paths between the two hosts.
The IPv4 paths from Singapore to Canberra, and back to Singapore are shown in the following two traceroute logs:
$ traceroute from Singapore to Canberra, IPv4
traceroute to 202.158.xxxx.yyy, 30 hops max, 60 byte packets
 1  103.3.60.3 0.672ms 0.796ms 0.899ms
 2  139.162.0.9 0.754ms 0.708ms 0.732ms
 3  te0-1-0-21.br03.sin02.pccwbtn.net 1.697ms 0.760ms 0.726ms
 4  ntt.fe3-18.br01.sin02.pccwbtn.net 69.526ms 69.644ms 69.754ms
 5  ae-10.r20.sngpsi05.sg.bb.gin.ntt.net 60.702ms 68.474ms  68.469ms
 6  ae-8.r22.snjsca04.us.bb.gin.ntt.net 168.447ms 168.532ms 168.138ms
 7  ae-19.r01.snjsca04.us.bb.gin.ntt.net 167.489ms 170.665ms 178.832ms
 8  xe-0-8-0-21.r01.snjsca04.us.ce.gin.ntt.net 330.084ms  323.556ms  329.772ms
 9  xe-1-0-1.pe1.msct.nsw.aarnet.net.au 330.020ms  323.738ms  334.474ms
10  et-3-3-0.pe1.rsby.nsw.aarnet.net.au 327.788ms 334.157ms  328.199ms
11  138.44.161.6 323.644ms  319.455ms  323.563ms
12  202.158.xxx.yyy 319.885ms 333.933ms 325.014ms

$ traceroute from Canberra to Singapore, IPv4
traceroute to 139.162.xxx.yyy, 64 hops max, 52 byte packets
 1  202.158.x.y 0.682ms  0.388ms  0.313ms
 2  xe-5-0-4-205.pe1.actn.act.aarnet.net.a 0.721ms  0.828ms  0.674ms
 3  et-0-3-0.pe1.rsby.nsw.aarnet.net.au 4.548ms  4.733ms  4.533ms
 4  et-7-1-0.pe1.brwy.nsw.aarnet.net.au  4.734ms 5.418ms 4.745ms
 5  et-0-3-0.pe1.bkvl.nsw.aarnet.net.au 5.117ms 5.512ms  5.524ms
 6  xe-0-0-0.bb1.b.sea.aarnet.net.au 148.017ms  148.019ms  148.131ms
 7  ge3-0.cr02.sea01.pccwbtn.net (206.81.80.13)  148.469ms  148.059ms  148.429ms
 8  tenge0-2-0-14.br03.sin02.pccwbtn.net 319.435ms 325.053ms 319.117ms
 9  tenge0-2-0-15.br03.sin02.pccwbtn.net 319.257ms 332.560ms 323.415ms
10  linode.te0-1-0-21.br03.sin02.pccwbtn.net 323.723ms  323.627ms  323.587ms
11  139.162.aaa.bbb  334.609ms  347.243ms  347.220ms
12  139.162.xxx.yyy 325.186ms  338.209ms  325.603ms
The comparable IPv6 paths from Singapore to Canberra, and back to Singapore are shown in the following two traceroute logs:
$ traceroute from Singapore to Canberra, IPv6
traceroute6 to 2001:388:1000:110:e4d:e9ff:x:y, 30 hops max, 80 byte packets
 1  2400:8901::5287:89ff:fe40:9fc1 0.897ms 0.912ms 1.051ms
 2  2400:8901:1111::1 0.851ms 0.827ms 0.792ms
 3  2001:cb0:2102:2:f::1 0.364ms  0.333ms  0.516ms
 4  2001:cb0:2102:2:f::1 0.502ms  0.461ms  0.431ms
 5  2001:cb0:21f0:1:17::2 2.512ms 2.176ms 3.445ms
 6  2001:cb0:21f0:1:17::2 2.354ms  2.382ms 1.238ms
 7  10gigabitethernet3-5.core1.sin1.he.net 1.080ms  1.034ms  1.020ms
 8  10ge1-5.core1.tyo1.he.net 88.053ms
    10ge1-16.core1.hkg1.he.net 39.369ms
    10ge1-5.core1.tyo1.he.net 88.084ms
 9  10ge1-5.core1.tyo1.he.net 88.157ms
    100ge8-1.core1.sea1.he.net 192.408ms  192.642ms
10  100ge8-1.core1.sea1.he.net 192.631ms  192.608ms  196.154ms
11  xe-1-0-1.pe2.brwy.nsw.aarnet.net.au 214.176ms 186.238ms 213.061ms
12  et-3-1-0.pe1.brwy.nsw.aarnet.net.au 211.298ms 211.300ms 214.200ms
13  et-1-1-0.pe1.rsby.nsw.aarnet.net.au 211.492ms 211.359ms 211.427ms
14  et-0-3-0.pe1.actn.act.aarnet.net.au 213.332ms 211.458ms  211.476ms
15  2001:388:1000:110:e4d:e9ff:x.y 213.274ms 213.199ms 213.169ms

$ traceroute from Canberra to Singapore, IPv6
traceroute6 to 2400:8901::f03c:91ff:a:b) 64 hops max, 12 byte packets
 1  2001:388:1000:110::x:y  0.808ms  0.899ms  1.586ms
 2  xe-5-0-4-205.pe1.actn.act.aarnet.net.au  1.633ms  0.646ms  0.578ms
 3  et-0-1-0.pe1.dksn.act.aarnet.net.au  0.682ms  0.649ms  0.694ms
 4  et-5-3-0.pe1.crlt.vic.aarnet.net.au  8.072ms  8.086ms  8.049ms
 5  et-5-1-0.pe1.wmlb.vic.aarnet.net.au  8.116ms  8.055ms  8.073ms
 6  et-0-3-0.pe1.adel.sa.aarnet.net.au  17.790ms  16.984ms  17.036ms
 7  et-1-1-0.pe1.prka.sa.aarnet.net.au  17.080ms  17.152ms
    et-0-3-0.pe1.eper.wa.aarnet.net.au  43.319ms
 8  et-0-3-0.pe1.knsg.wa.aarnet.net.au  43.357ms  43.443ms  43.353ms
 9  gigabitethernet-5-1-0.bb1.b.per.aarnet.net.au  43.849ms  43.919ms  43.850ms
10  so-0-0-0.bb1.a.sin.aarnet.net.au  92.219ms  92.275ms  92.189ms
11  as6939.singapore.megaport.com  212.347ms  212.426ms  212.471ms
12  * * *
13  2400:8901:1110::2  213.924ms 213.904ms  213.717ms
14  2400:8901::f03c:91ff:a:b  213.954ms  213.393ms  213.726ms
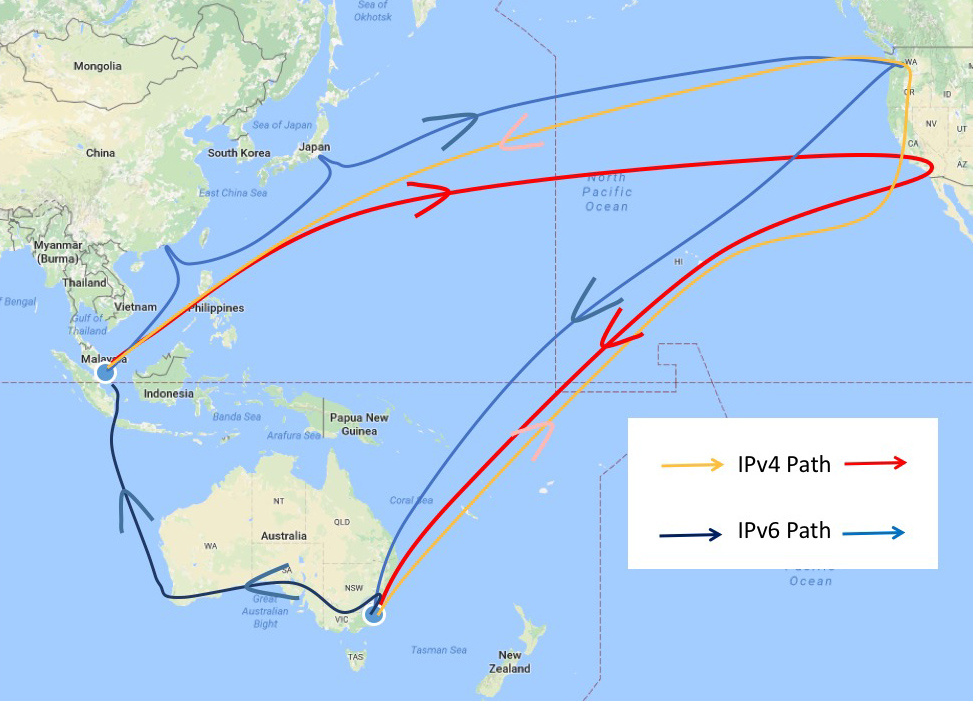
Figure 1 – IPv4 and IPv6 paths from Singapore to Canberra, and back to Singapore
The data shows that in this particular case the IPv4 round trip time is some 325ms, while the IPv6 time is considerably shorter, at 213ms.The traceroute data also shows why this is the case. In the case of IPv4, the packet path to and from Singapore involves crossing the Pacific Ocean four times, as the forward and return paths involve directing the traffic through a router located on the west coast of the United States. In the case of IPv6 there is an asymmetric path where the outbound packets from Canberra to Singapore transit across a submarine cable system that runs North-South across the Indian Ocean between Perth and Singapore. This path difference is shown on the map below.
I will note that this is not a generic problem per se, and both asymmetric paths and paths that differ between IPv4 and IPv6 are not particularly unusual. The specific paths taken here are the result of the particular source and destination addresses and the various routing policies of the access and transit providers that lie on the transit paths.
This example is illustrative of the observation that while the dual stack end hosts may remain constant, changing the IP protocol from IPv4 to IPv6 may also trigger a significant change of the transit path through the network, which in turn will have performance implications for any application that is attempting to send and receive data on these paths.
This leads to the observation that for the purposes of comparing the performance of these two versions of IP, what we would like to look at is the relative levels of reliability of connection establishment and relative round trip times across a series of experiments where the other factors are held constant. To what extent does changing just the IP protocol from IPv4 to IPv6 have on the anticipated performance of the network transaction?
Measuring Performance
This measurement is based on data collected from end user measurements. The measurement technique uses an advertisement distribution network to load a measurement script on a user’s browser. The script fetches three invisible pixels, one using a URL that is only accessible using IPv4, the second with IPv6 and the third is accessible using either protocol. All of these pixels are loaded from the experiment’s servers, and a full packet log is recorded at each server. The actual measurements are performed through subsequent analysis of the server’s packet logs.
Connection failure is challenging to measure if the only available data is coming from the server, as the task has some aspects of attempting to measure something that does not in fact exist. However, we are using TCP in this measurement, and one aspect of connection failure is directly visible to the server. TCP uses a three-way handshake to start a session. Normally this handshake looks like Figure 2. The server receives an opening TCP packet with the TCP SYN flag set. The servers will respond with a TCP packet with the SYN and ACK flags set, and the connection is complete when the server receives an ACK packet.
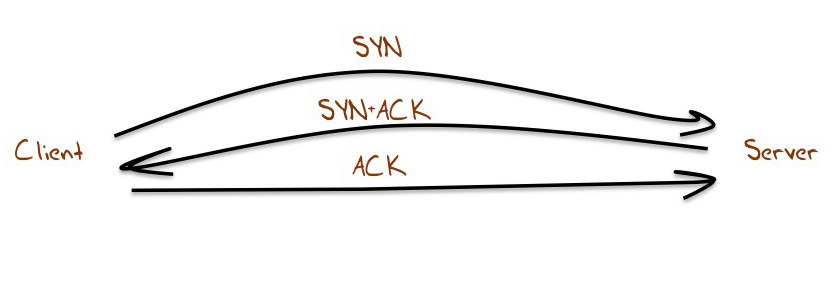
Figure 2 – TCP Handshake
One visible form of failure is a hung connection, where the server sees and responds to the opening SYN, but fails to receive the subsequent ACK to complete the connection. What we can measure for each protocol is the relative ratio of hung connections to successful connections. What percentage of all connection attempts fail to complete, and is this number different when considering IPv4 and IPv6 connections? This is not a complete picture of connection failures, as we may not even see the initial SYN of an attempted connection, but it is a useful comparative metric, in that it allows us to directly compare one aspect of connection robustness between IPv4 and IPv6.
The second measurable performance attribute is the end-to-end delay, measured as a round trip time. A log of a TCP session provides a constant record of round trip time measurements by looking in the server’s log at the time when data was sent and the time when that data was acknowledged. This implicit RTT estimate can be noisy, with factors such as delayed ACKs in the TCP protocol, and client side issues, such as internal job scheduling both in the host operating system and with the browser itself, and similar server-side issues. One way to avoid much of this added noise component to the underlying signal of the RTT measurement is to look at the time taken to complete the initial TCP connection in Figure 2, from reception to the initial SYN to the reception of the ensuing ACK. This TCP connection operation is normally performed within the operating system as a kernel function and is less prone to imposed jitter from the external factors, so this measurement offers us one of the clearer ways to view the end-to-end round trip delay.
Measurement Results
The major update from my previous report is the creation of an online tool that reports on performance on an ongoing basis. The tool is accessible at: http://stats.labs.apnic.net/v6perf.
The home page of this report is a world map, and a set of tables. There are two generic families of reports: a comparison of RTT measurements, comparing IPv4 and IPv6; and an absolute value of IPv6 connection robustness.
RTT Comparison
The “home” screen of the RTT comparison report is the world map, shown in Figure 3.
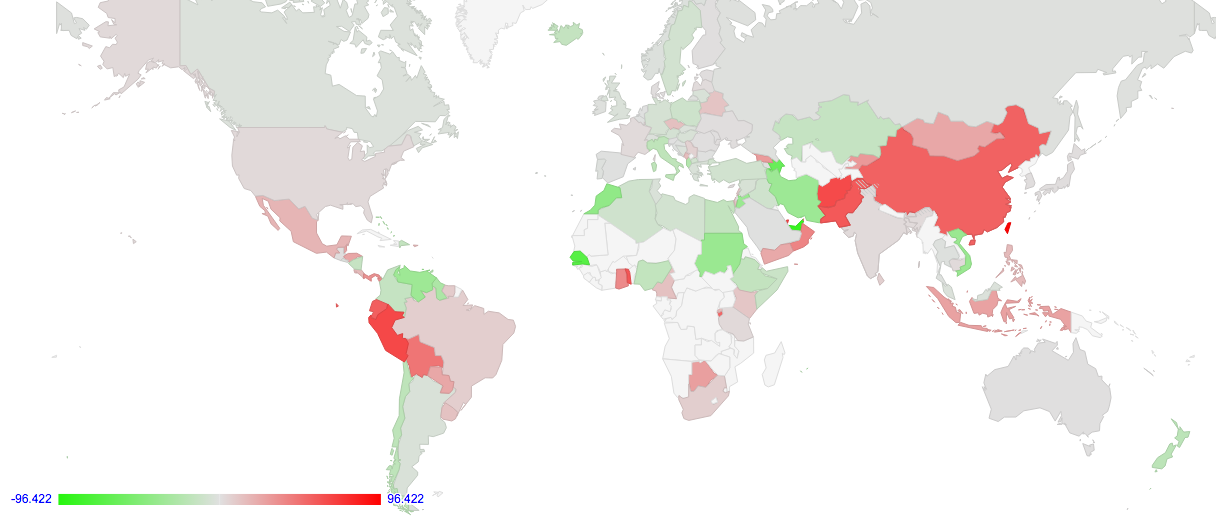
Figure 3 – World Map of IPv6 – IPv4 RTT differences per country
Each country is coloured based on a relative RTT metric. This metric is computed by looking at the two RTT times for each dual stack client (in milliseconds) and subtracting the IPv4 RTT from the IPv6 RTT. In the example shown at the start of this article, the IPv6 RTT is 213ms, while the IPv4 RTT is 315ms. The result of the subtraction is -102ms, indicating that in this particular case the IPv6 RTT is 102ms faster than IPv4. These individual measurements are collected for each country (the country is determined by geolocating the IPv4 part of the dual stack address pair), and the last 30 days’ measurements are used to generate an average value for each country.
The data used to colour the map is also reproduced in the tables in the second half of the page. This table is helpful in so far as often a single average value can conceal a wealth of information. What the table shows that the map cannot, is the number of sample points on which the map was based. For example, while the average RTT difference in the Dominican Republic was 93.4ms in favour of IPv6 being faster, this result is based on the measurement of a single, dual stack host. A more reliable number is drawn from Viet Nam, where averaged across 4,479 values, IPv6 was on average 36.07ms faster.
Control variables in the screen allow variation of the end date (the default is the most recently processed date, typically yesterday), and the averaging window (the default is 30 days). The threshold sample rate can also be raised to remove and report those countries whose total sample count in the window is less than the threshold.
Connection Robustness
The other form of world map is obtained by selecting the Plot Type of “Failure of v6 TCP connections”. Here the data reflects the relative ratio of failed IPv6 connections as compared to all IPv6 connection attempts. The map shows the average connection failure rate expressed as a percentage of all seen connection attempts over the specified time window for users who are geolocated to a particular country. An example screen shot of this view is shown in Figure 4.
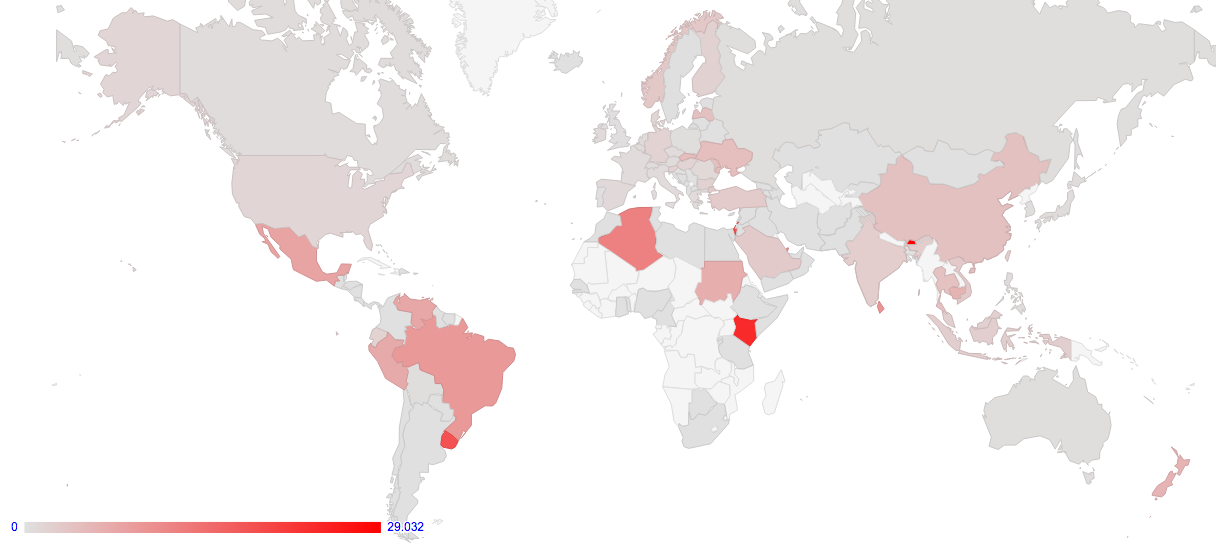
Figure 4 – World Map of IPv6 Connection Failure Rate
There are many potential causes of IPv6 connection failures. A common reason is overly restrictive filters applied on the customer site, where incoming IPv6 packets are refused. It is also possible that there are asymmetric routing issues that allow the client to see the relevant experiment server, but not the reverse.
Other Data
As well as the data relating to the mean difference in measured RTT values, there are three additional columns in the tabular reports: “Dual Stack”, “Dual Stack (300ms)” and “v6 Use Rate”.
Let’s look at the Dual Stack figure first. As well as RTT times, we can also collect data on which protocol was used by the client to retrieve the dual stack object from the server. We can match this with the different RTT times recorded against this host to ask the question: “Did the client end up picking the fastest protocol to retrieve the dual stack object?”. In the tabular report, the percentage value is a variant of this question, namely: “What percentage of the time for all clients did the client use the fastest protocol to retrieve the dual stack object?”. Where the sample size is relatively high (more than 1,000 individual samples over a 30-day window), the ‘accuracy’ of the dual stack selection outcome is shown as a percentage of the total fetch. This is the “Dual Stack” column.
However, this Dual Stack selection figure probably misrepresents the true objective of the protocol selection algorithm in dual stack hosts. The aim of the “Happy Eyeballs” protocol selection algorithm is not to select the fastest protocol in all cases. The algorithms will prefer IPv6, and it does so by selecting IPv6 as long as it is not too slow as compared to IPv4. The RFC that describes this procedure, RFC6555, does not specify how slow is “too slow”, but it does note that Firefox and Chrome implementations of this procedure use a 300ms timer. The second column reports of the Dual Stack selection process, using a modified selection question: “What percentage of the time did the client use the fastest protocol, allowing IPv6 to have a 300ms handicap advantage, to retrieve the dual stack object?”.
There are some changes evident between these two questions. For dual stack users in Greece, for example (136,299 samples over 30 days), IPv6 is on average 3.85ms faster than IPv4. Users picked the fastest protocol 63% of the time. However, when IPv6 is allowed a 300ms “Happy Eyeballs” advantage, the result is 98% accuracy in selecting the fastest protocol.
The final column in the tabular reports in the v6 use rate as a percentage, showing to what extent there is IPv6 use as a percentage of all samples for IPv6.
Per-Country and Per-AS Reports
There are also reports for each country and each access network service provider, providing a similar report at the level of individual countries and individual networks.
The per-country reports also include a table of the network service providers who provide services in that country. The table provides the same details of the average RTT difference between IPv4 and IPv6, the IPv6 TCP connection failure rate, and the Dual Stack selection outcomes for each access network in the country that has recorded IPv6 activity.
It is possible to add a number of plots to the country and network reports. Three plots are added when the radio button for “Add Plot of Time series RTT Profiles to RTT Report” is ticked.
The first plot is the actual distribution of the individual RTT difference measurements across the same time window used in the table. This shows more information that is shown in a single average figure, displaying both the distribution of measurements and the cumulative distribution of measurements, as well as displaying the average and the mean standard deviation values.
The distributions displayed in these plots show that it is rare to see a smooth distribution. More common is a distribution such as that shown in Figure 5 (data for AS1221, Telstra), where there are a number of local peaks of difference in RTT values.
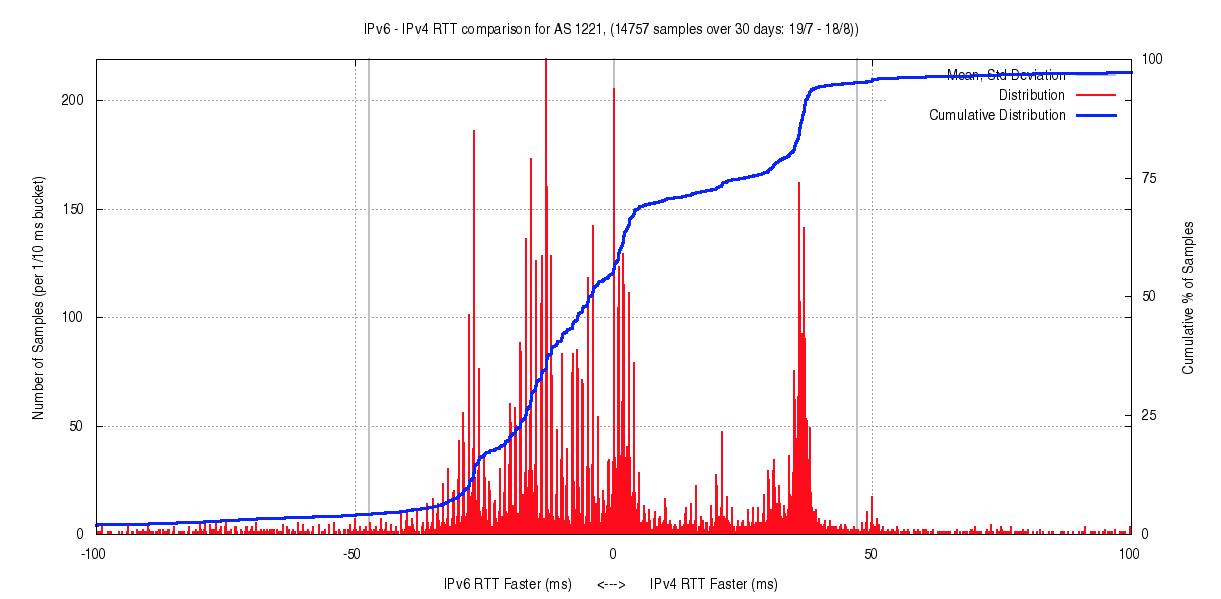
Figure 5 – Distribution of RTT values (AS1221)
This distribution shows a level of variation in RTT measurements that is not visible in the average value, nor in the mean standard deviation. In the case shown in Figure 5, there is a local peak of some 1,000 sample points where the IPv4 path is some 40ms faster than the equivalent IPv6 path. In this case slightly more than 50% of the samples show a faster path using IPv6, with some clustering at 10ms and 24ms.
AS7018 in the United States (AT&T Services) shows an interesting distribution (Figure 6). Slightly over one half of the samples show IPv6 being no slower than 10ms than the accompanying IPv4 RTT value. However, there are three local clusters where IPv6 is respectively 15ms, 25ms and 75ms slower.
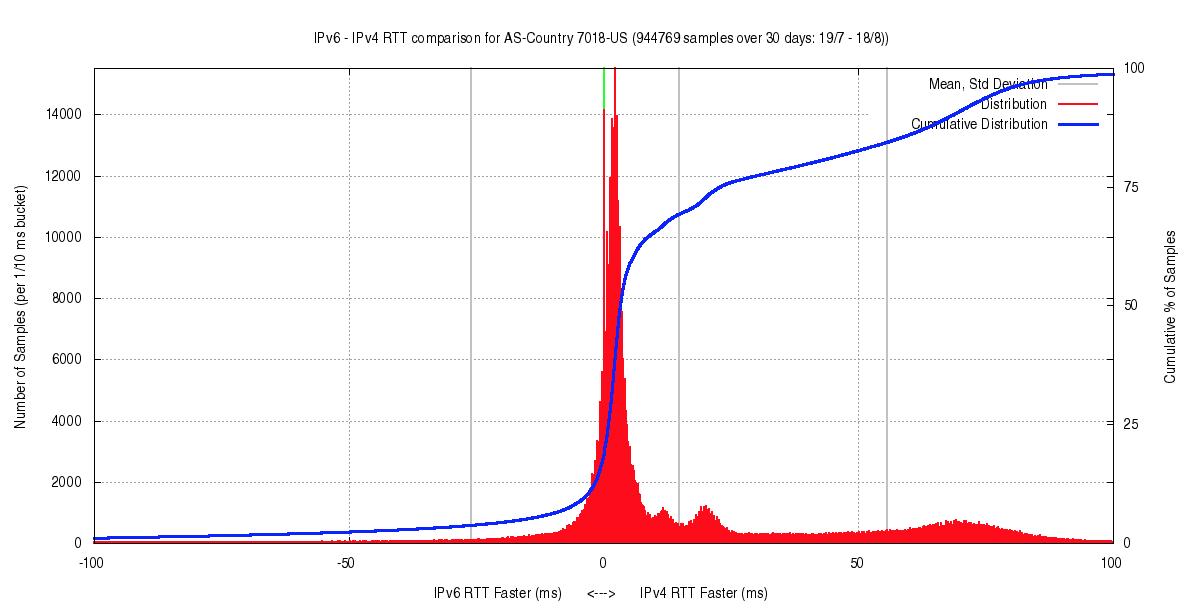
Figure 6 – Distribution of RTT values (AS7018)
The second plot is a time series plot of daily values, showing the average and the mean standard deviation of the daily data set for each day. An example of this plot is shown in Figure 7.
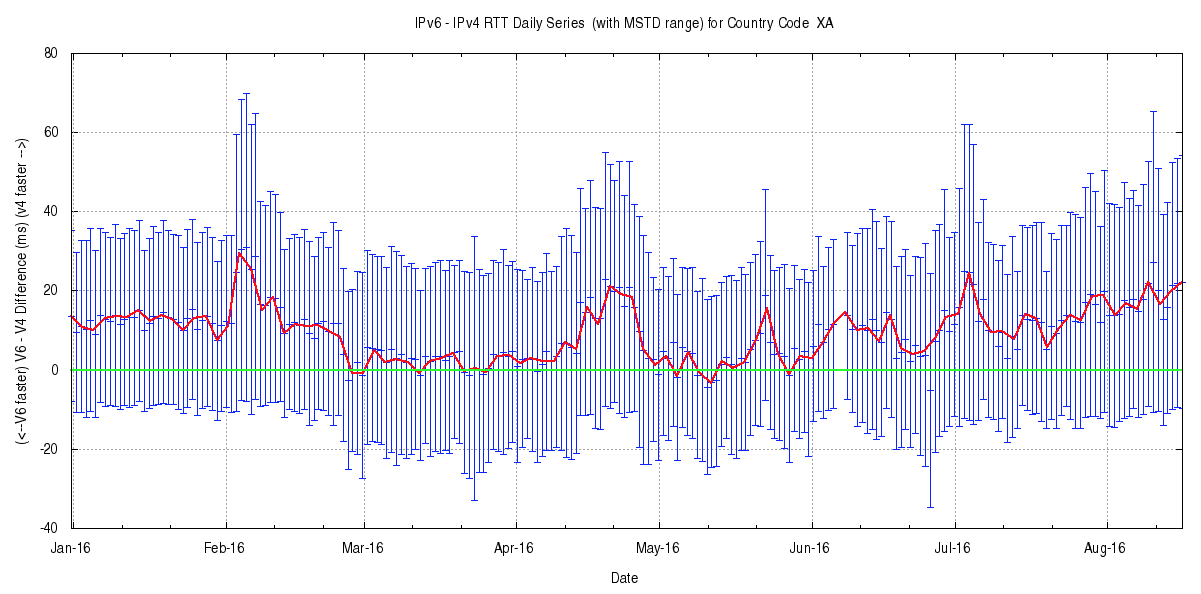
Figure 7 – Daily RTT values: average and mean standard deviation
The third plot shows the number of measurement sample points that have been gathered per day (Figure 8). The blue data points represent the number of IPv6 addresses that have completed a connection and are able to be associated with an IPv4 address in a dual stack scenario. The red data points are the total of all unique IPv6 addresses seen per day, including those addresses that fail to complete a connection. Teredo and 6to4 IPv6 addresses are not included in this count.
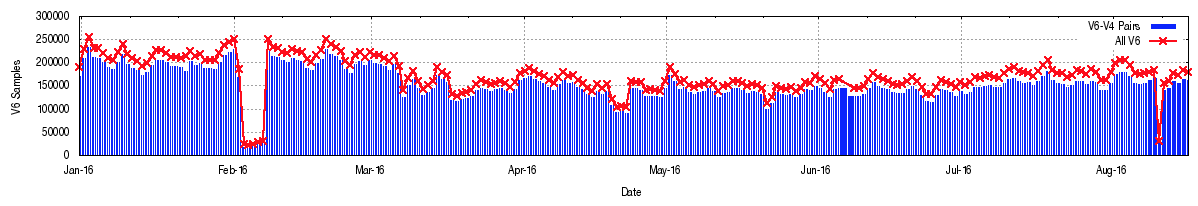
Figure 8 – Daily Sample Count
Conclusion
What can we conclude about the relative performance of IPv6 to IPv4 from these measurements?
These measurements show that in a large set of individual comparisons where the IPv4 and IPv6 paths between the same two dual stack endpoints are examined, the two protocols, as measured by the TCP SYN round trip time, are roughly equivalent on average, but with some significant outliers.
At a finer level of detail, there are discernible differences between geographic regions. IPv6 appears to be faster on average in Europe, Africa and Oceania, while IPv4 is faster in Asia, and the Americas. At a further level of detail these differences between IPv4 and IPv6 extend to individual access networks where some networks appear to handle IPv6 packets in an entirely different manner to IPv4 packets.
While the TCP connection performance is roughly equivalent once the connection is established, the probability of establishing the connection is not the same. The current connection failure rate for IPv4 connections was seen to be some 0.2% of all connection attempts, while the equivalent connection failure rate for unicast IPv6 is eight times higher, at 1.6% of all connection attempts.
So, with respect to the performance of IPv6, there is still some scope for improvement here.
These reports are available from APNIC Labs.
The views expressed by the authors of this blog are their own and do not necessarily reflect the views of APNIC. Please note a Code of Conduct applies to this blog.
Hmm, link to http://stats.apnic.net/v6perf broken in article, and typing that manually in the URL bar I’m getting a page not found.
Link should be: http://stats.labs.apnic.net/v6perf
To me, the fine detail in the distributions indicates that ‘country’ may not be the right statistical population to consider. At least not to produce a single representative figure for.
At the least, this is a great starting point!
I think that it would help to see how the data are pulled together – I have some doubts about the groupings that are evident in some of the apnic graphs/statistics, but it’s not possible to get to the sources to pin down the differences (e.g. the data for estimating user bases by AS at: http://stats.labs.apnic.net/cgi-bin/v6pop?c=GB, for AS21321, look odd when compared to the view at: http://stats.labs.apnic.net/ipv6/AS5607?a=5607&c=GB&x=1&s=1&p=1&w=1
When looking at graphs of numbers it’s all to easy to assume that the numbers represent the same things. APNIC’s doing a great job at measuring what’s going on, but (IMO), even more methodological and result transparency would help to boost the robustness of conclusions.
Digging in the US figures, it looks like the overall slowness is largely down to AS7018 (http://bit.ly/2bvU0vE). Is there comparable intra AS variation, I wonder?
Assuming not, for the moment, then given FB and others’ measurement of better user experiences over IPv6, there may be significant competitive variation between AS’s that isn’t currently being exploited by ISPs’ marcomms activities.
Hi Mark, Tim – that link has been fixed, thanks for the heads up.
Thanks
Tony
Tim is right – the US figure is heavily influenced by AT&T’s AS7018. This network is US-based, and the server is located in Dallas, so one would expect that the IPv4 and IPv6 paths would not diverge very much. http://nong.rand.apnic.net/cgi-bin/v6p-plot?c=7018-US&w=30&d=now&l=-50&h=100 shows that some 20% of clients in this network are experiencing a V6 RTT that is 75ms slower than IPv4. This is a very large number, and is probably more indicative of routing problems that dual stack packet processing (V4 -> V6 translation).