

To detect Distributed Denial-of-Service (DDoS) attacks we need to get information about observed traffic from network equipment first. At FastNetMon, our users use a variety of platforms in their networks, and we have complete support for all major vendors on the market (Cisco, Juniper, Arista, Extreme, Nokia, Huawei, Mikrotik, VyOS, and Netgate).
We use our own open source parsers (Netflow v9 and IPFIX) to decode the telemetry we receive from network equipment. It’s a fairly unique approach that allows us to examine different implementations of traffic telemetry export from the perspective of protocol implementation and from an operational standpoint.
Twelve years of experience has shown us that Juniper MX is the best platform for DDoS detection and mitigation available on the market.
Why Juniper MX is great for DDoS defence:
- Mature and well-tested BGP Flow Specification support
- Variety of supported telemetry protocols (such as sFlow, Netflow, IPFIX, inline monitoring services, sampled port mirror, and sampled port mirror over GRE)
Unfortunately, there are some issues with telemetry on the Juniper MX platform that have been present for many years, and we do not see any evidence that they will be fixed. That’s why we’re publishing this article. This post will focus on discarded traffic monitoring, but keep in mind that this is just one of several issues. We’ll address the others in subsequent discussions.
Why is discarded traffic monitoring so important?
When we defend customer networks from DDoS attacks we need to see what traffic was dropped by us. This information is very important as it allows us to monitor the scale of the attack and the efficiency of our filtering.
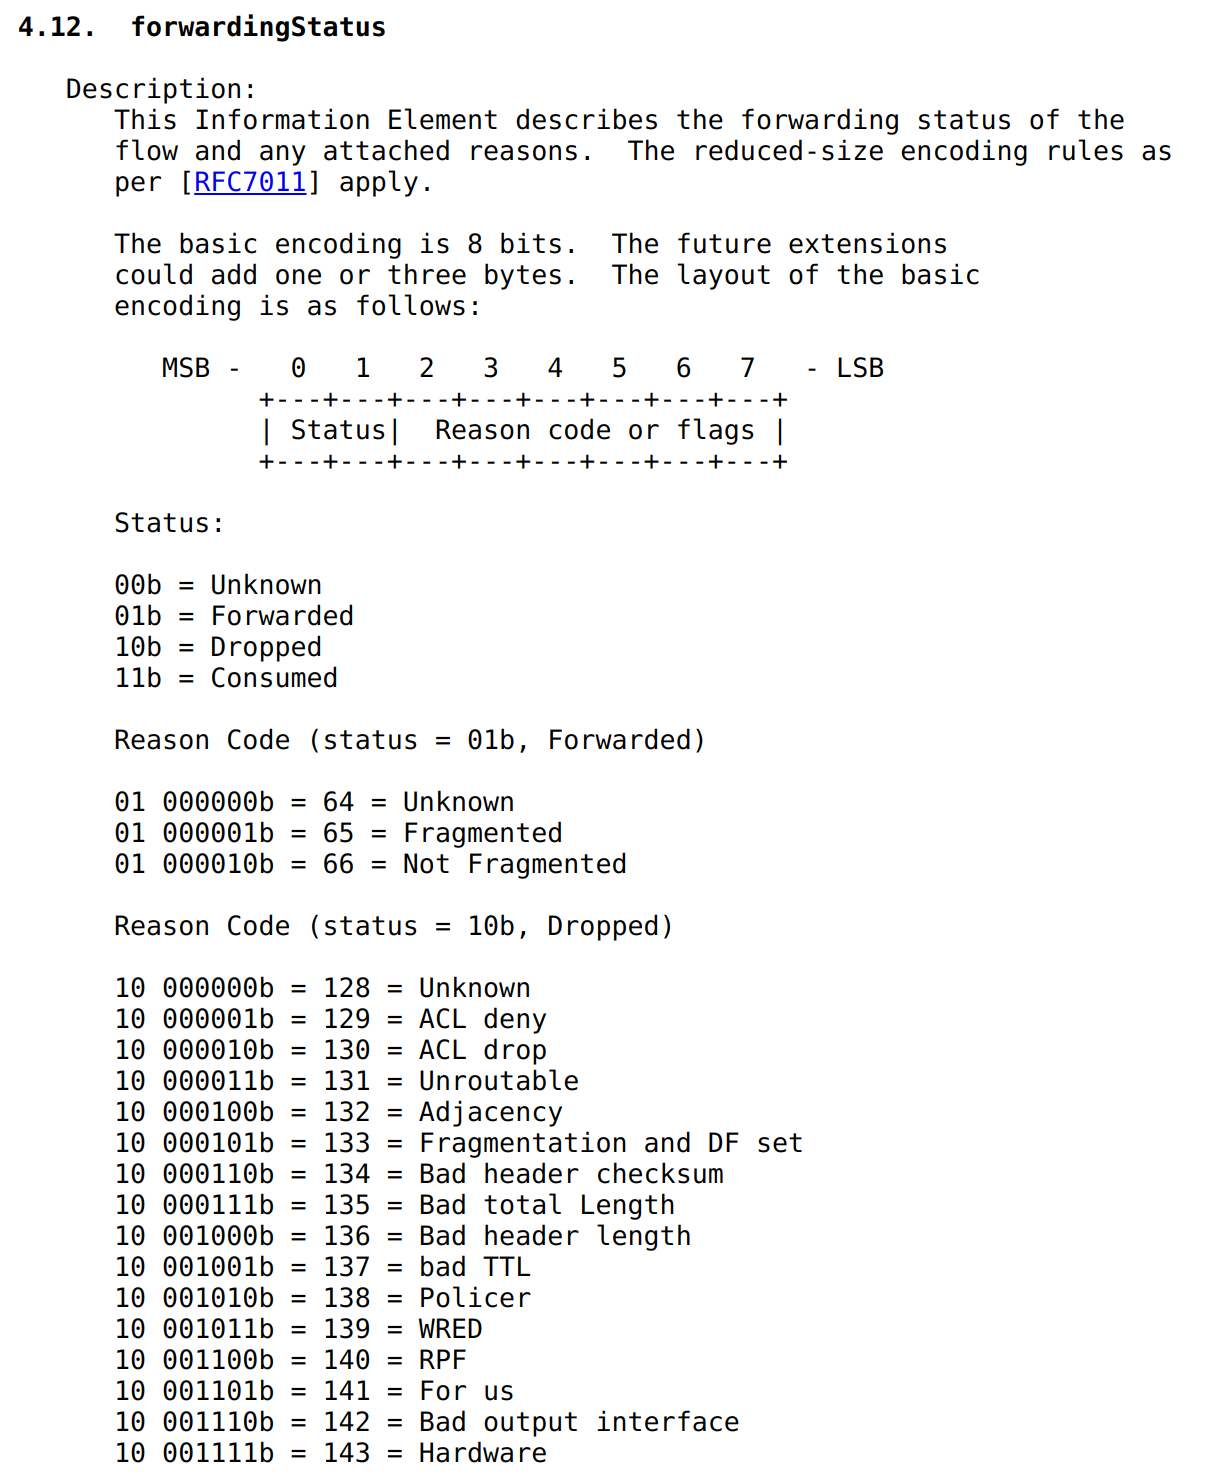
The IPFIX protocol (RFC 7270) includes a special entity called ‘forwarding status’ with ElementID 89. This entity encodes a limited subset of reasons for packet drops, and we support it in FastNetMon.
Let’s look at how major vendors report discarded traffic in their network traffic telemetry.
Nokia
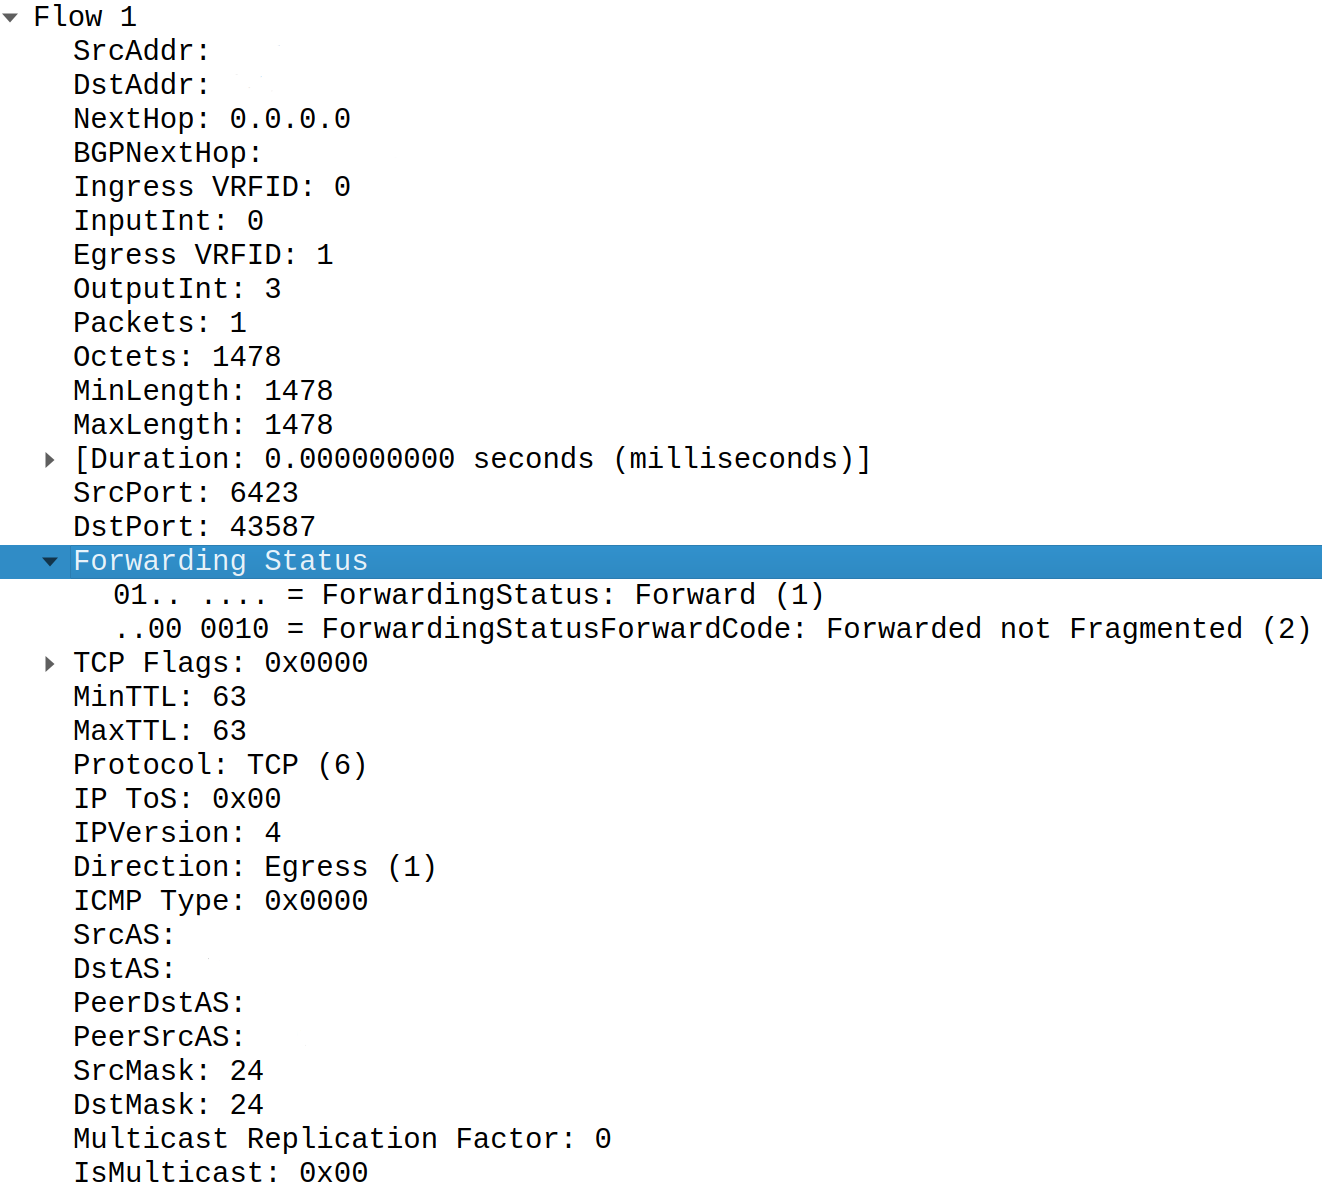
Nokia SR uses a forwarding status field to encode forwarding information in their IPFIX implementation:
Cisco
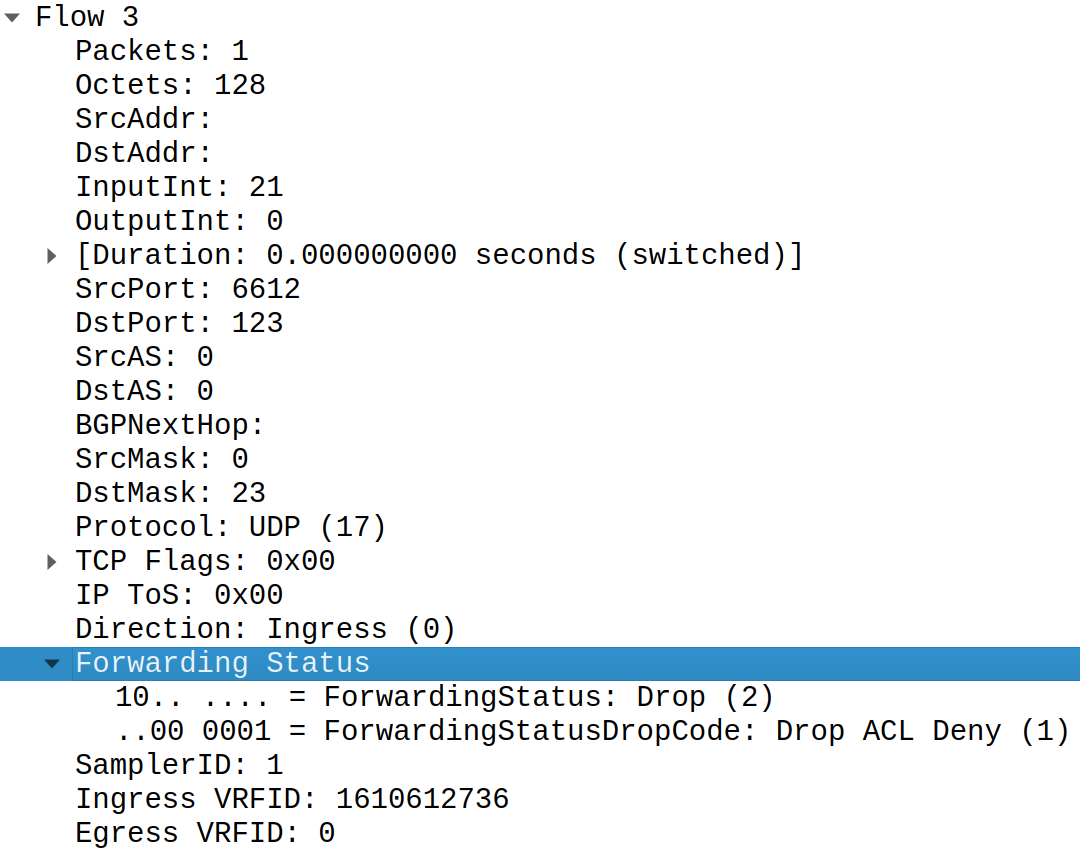
Cisco uses the forwarding status field in Cisco ASR 9000 for both Netflow v9 and IPFIX telemetry:
Huawei
Huawei uses forwarding status for both Netflow v9 and IPFIX:
What’s the deal with Juniper?
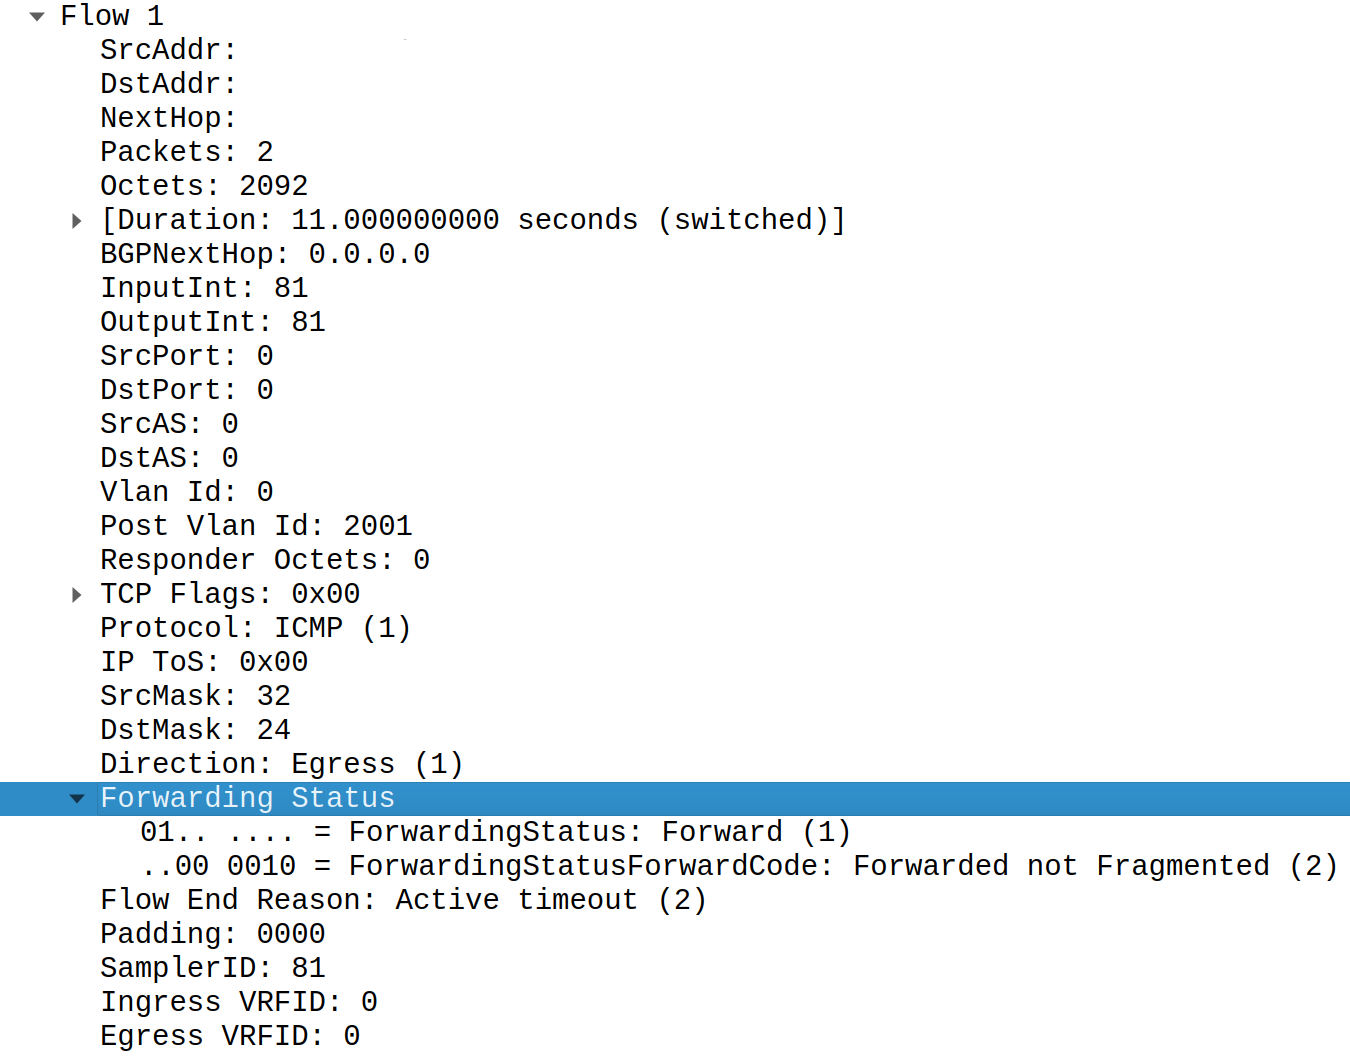
Here’s how Juniper MX reports information about discarded traffic in IPFIX mode:
Is the forwarding status field present? No, it’s clearly missing. I repeated my tests on the latest stable JunOS, and even there, the forwarding status field was missing.
How can we determine that this traffic was dropped? There is a rather obscure guide on the Juniper website that explains it:
You can now configure Junos OS to set the flow record value to 0 (zero) for rejected, discarded, and policed flows. You can configure the report-zero-oif-gw-on-discard statement at the [edit chassis fpc slot-number inline-services] hierarchy level to enable the FPC to set the value to 0 (zero) for the elements ipNextHopIPv6Address (Element ID 62), egressInterface (Element ID 14), and ipNextHopIPv4Address (Element ID 15) for the flow records for rejected, discarded, and policed flows.
If the report-zero-oif-gw-on-discard statement is not configured, the flow records display the available information for these elements, which is the default behavior.
After you configure the report-zero-oif-gw-on-discard statement, each sampled packet updates the forwarding action of that flow in the flow record. That is, the last sampled packet of the flow just before export determines the forwarding action of that flow. For example, in the case of a rate-limiting policer, forwarding action taken on a flow is not deterministic. The flow can be treated either as forwarded or as policed based on the forwarding action of the last sampled packet of that flow.
Yes, you read that right.
To get information about discarded traffic we need to enable the following configuration option on the Juniper MX platform first:
inline-services {
   report-zero-oif-gw-on-discard;
}
After that, we need to look at the ‘Output Interface’ field and ‘Next Hop’ as 0 value for the first and 0.0.0.0 for the second has a special meaning of ‘dropped’.
NextHop: 0.0.0.0
TC Flags: 0x00
OutputInt: 0
Tricky, isn’t it?
To interpret such complicated encoding we have a whole layer of logic in FastNetMon.
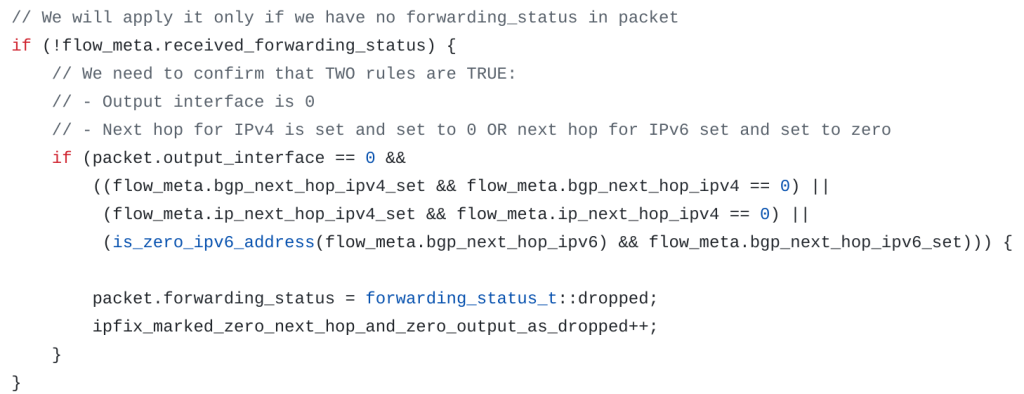
Encoding data (such as this ‘discarded’ status) in values that aren’t intended for such information is similar to the ‘magic number’ concept in software engineering. This approach is generally not recommended, as it is complicated to understand and requires extra logic to interpret correctly.
It’s pretty clear that this was the only way to encode ‘dropped traffic’ before the IPFIX RFC emerged as a standard in 2008. However, that was 16 years ago, and today we have RFC-compliant methods to deliver and encode such information for NetFlow/IPFIX collectors, and most vendors adhere to these standards.
I’m not aware of any other NetFlow/IPFIX collectors that require such a heavy amount of post-processing to detect dropped traffic. If you know of any, please share in the comments.
Conclusions
I hope that someday the JunOS development team will introduce RFC-compliant forwarding status to encode dropped traffic, allowing us to remove this complex logic from our product.
Thank you for reading!
Pavel is the author of FastNetMon, an open source DDoS detection tool with a variety of traffic capture methods and works in software development and community management.
Adapted from the original of Pavel’s blog.
The views expressed by the authors of this blog are their own and do not necessarily reflect the views of APNIC. Please note a Code of Conduct applies to this blog.