
This is the fifth blog post on the topic of the centralization of the Internet. The previous posts cover the diversity of authoritative name servers, the diversity of MX records, use of CAA records, and naked domains. This research was also presented at RIPE 88; video and slides are available here. But be warned — there’s a lot of data here, and you have to be quite a network data nerd to make it all the way through to the end, I suppose.
The year is 2035, the year of Linux on the desktop (fingers crossed, this one’s gonna be it!), imminent, widespread IPv6 adoption, and Amazon has just bought the last /8 it didn’t own: 255.0.0.0/8.
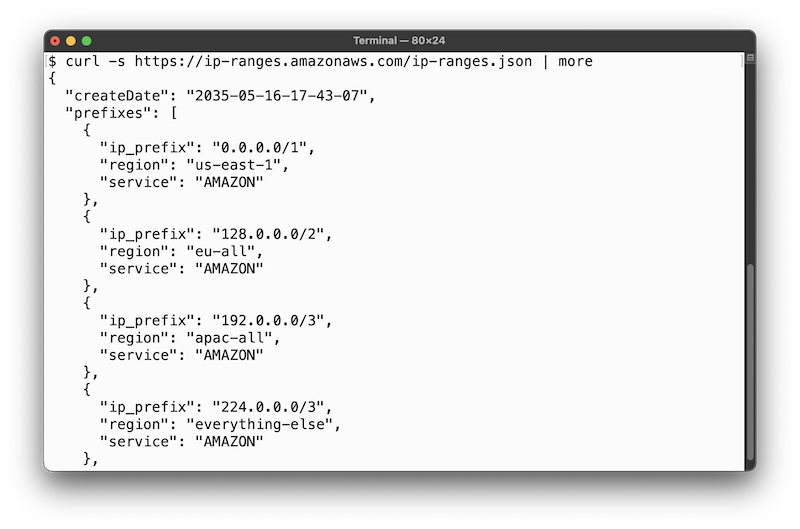
How did we get here?
Well, for starters, I think we’re a lot closer to this happening than 2035, and given that Amazon is already using class E addresses internally, why not:
$ traceroute www.amazon.com
traceroute to e15316.dsca.akamaiedge.net (23.209.110.82), 64 hops max, 40 byte packets
 1  244.5.5.97 (244.5.5.97)  8.543 ms
    244.5.5.81 (244.5.5.81)  3.580 ms
    244.5.5.97 (244.5.5.97)  6.846 ms
 2  240.0.56.98 (240.0.56.98)  0.388 ms
    240.0.56.65 (240.0.56.65)  0.367 ms
    240.4.112.65 (240.4.112.65)  0.352 ms
 3  242.0.227.213 (242.0.227.213)  1.687 ms
    242.0.227.81 (242.0.227.81)  1.448 ms
    242.0.227.83 (242.0.227.83)  1.055 ms
 4  240.3.180.14 (240.3.180.14)  1.319 ms
    240.3.180.12 (240.3.180.12)  1.320 ms
    240.3.180.15 (240.3.180.15)  1.991 ms
[...]
It’ll be fun when that netblock is eventually allocated by IANA (as proposed in this draft, for example) and Amazon basically says ‘Sorry, we had dibs. You can’t expect us to renumber all of EC2, so you might as well just give us the whole /4, kthanxbye.’
The draft argues that the “future has arrived, and it wants IPv4 unicast addresses far more than it wants permanently unusable IPv4 addresses”. I’d argue that the future really wants more IPv6, but that seems like, to use terrible business speak, ‘a big ask’, apparently.
(Side note — their IPv6 addresses do what everybody else does, of course, and encode the IPv4 address in the bottom bytes of their v6 addresses:
$ traceroute6 www.amazon.com
traceroute6: `www-amazon-com.customer.fastly.net' has multiple addresses; using `2606:2cc0::374'
traceroute6 to www-amazon-com.customer.fastly.net (2606:2cc0::374) from 2600:1f18:400c:b800:bdf1:6584:1971:4efe, 64 hops max, 12 byte packets
 1  2620:107:4000:2210:8000:0:f405:667  58.911 ms  # 244.5.102.7
    2620:107:4000:2210:8000:0:3ec:3e71  0.831 ms
    2620:107:4000:2210:8000:0:3ec:3e73  0.808 ms
 2  2620:107:4000:a792::f000:3841  0.419 ms        # 240.0.56.65
    2620:107:4000:a792::f000:3843  0.473 ms
    2620:107:4000:a792::f000:3842  0.4 ms
 3  2620:107:4000:cfff::f20c:2b01  17.258 ms       # 242.12.43.1
    2620:107:4000:cfff::f20c:2b81  12.562 ms
    2620:107:4000:cfff::f200:e353  2.026 ms
 4  2620:107:4000:c5c0::f3fd:1  1429.46 ms  1299.83 ms
    2620:107:4000:c5c0::f3fd:3  1368.37 ms
 5  2620:107:4000:cfff::f202:d4c3  2.15 ms
    2620:107:4000:cfff::f202:d545  1.931 ms
    2620:107:4000:cfff::f202:d445  1.358 ms
 6  2620:107:4000:8001::24  2.469 ms
    2620:107:4000:8001::44  10.271 ms
    2620:107:4000:8001::24  1.16 ms
[...]
$
This practice is really useful for infosec nerds wearing various shades of hats, as the vast IPv6 address space becomes a bit more manageable and in this way, you may glean additional information about a target, so thanks for that — but I digress.)
Anyway, so I think you see where I’m going with this. We were told that IANA allocates IP space to the Regional Internet Registries (RIRs), who further manage the allocated netblocks. Some early adopters got a special gift from Jon Postel, the original IANA — their very own /8.
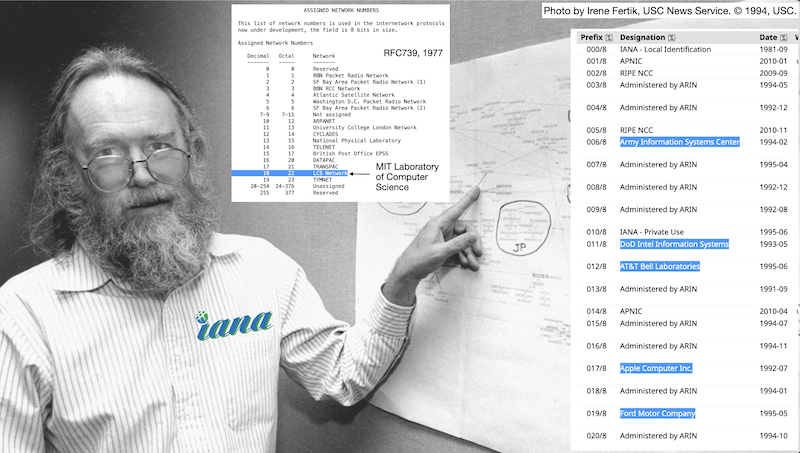
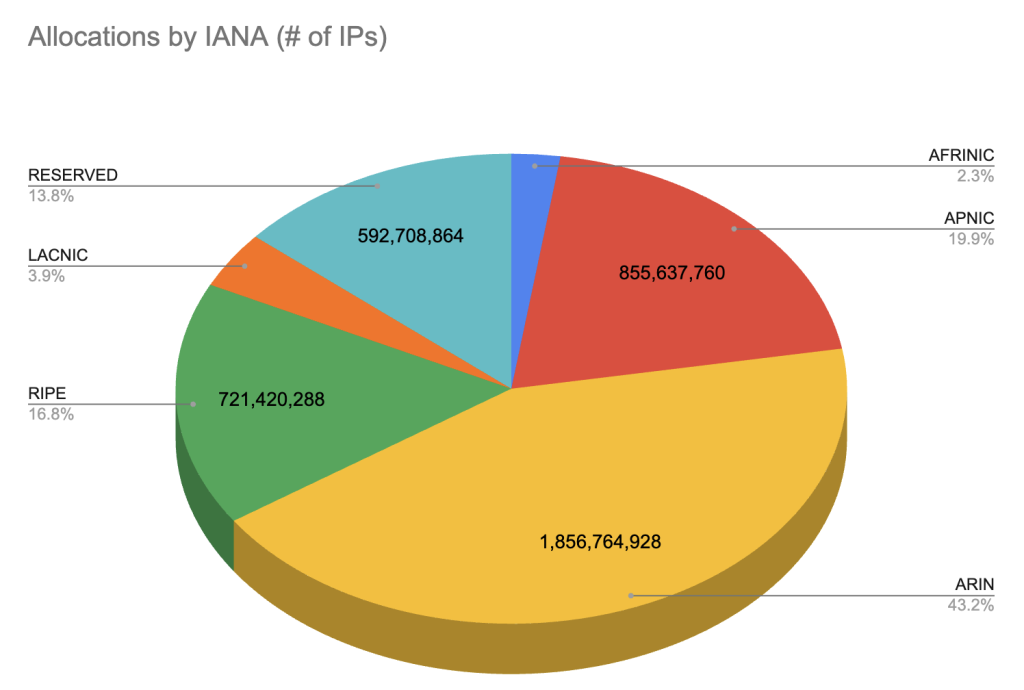
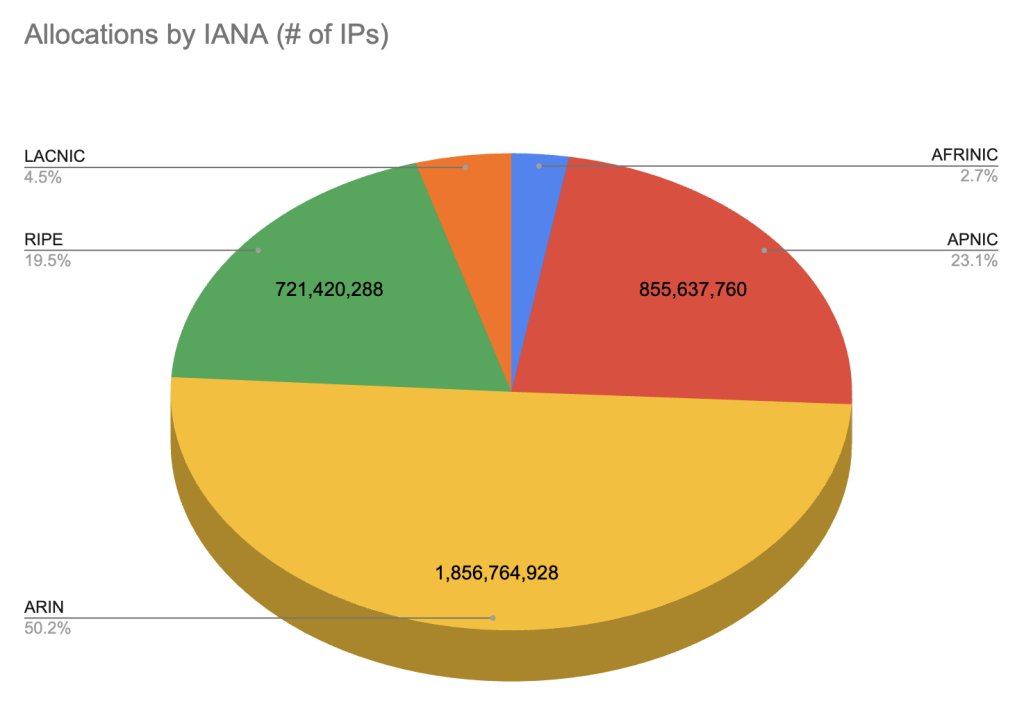
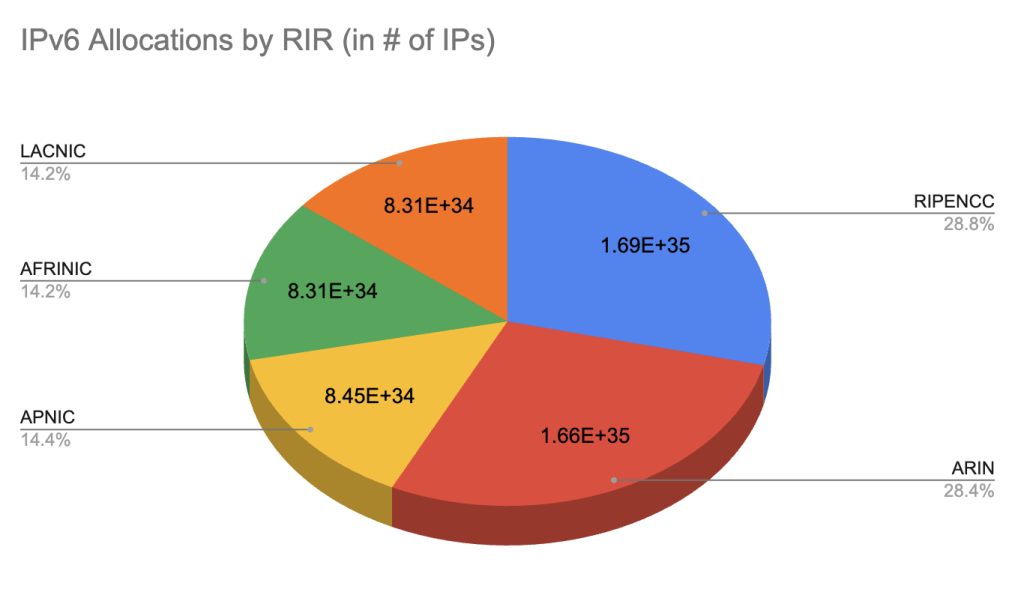
On the RIR level, the available IP space wasn’t divided evenly. If we take out the reserved IP space (35 /8s in total, comprising the Class E, multicast, and select other netblocks) and look only at the actually available IP addresses as allocated to the different RIRs, then we find that ARIN manages over 50% of the IPv4 IP space, while AFRINIC only manages 2.7%. In comparison, the IPv6 address space is quite a bit more evenly assigned:
And of course, as we ran out of IP addresses, netblocks were reallocated and reassigned, transferred between regional registries, and companies started to trade netblocks, which turned out to be a pretty good way to make a quick buck if you had, you know, a spare /9 lying around or so.
There are many such instances, such as Google buying 35.192.0.0/12 from Merit Networks in 2017, but let’s take Amazon as one specific example:
- 2013: Amazon buys 52.0.0.0/11 and 52.64.0.0/11 from DuPont (today owns 52.0.0.0/10, 52.64.0.0/12)
- 2017: Amazon buys 18.128.0.0/9 from MIT
- 2018: Amazon buys 3.0.0.0/8 from GE
- 2019: Amazon buys 44.192.0.0/10 from Amateur Radio Digital Communications (ARDC)
Oh, and in 2023, AWS began charging for the use of public IPv4 addresses: $0.005 / hour.
But I basically started this research because I happened to be looking at the IP ranges file that AWS publishes, and I thought to myself: ‘Well, that’s a lot of IP addresses for just one company’. And that’s not even all of Amazon, just AWS:
$ curl -s https://ip-ranges.amazonaws.com/ip-ranges.json | jq -r '.prefixes[].ip_prefix' | wc -l
    9180
$ curl -s https://ip-ranges.amazonaws.com/ip-ranges.json | \
    jq -r '.prefixes[].ip_prefix' | \
    awk -F/ '{ sum += 2^(32-$2) } END { printf("%'"'"'d\n", sum) }'
144,578,747
$
By the way, if you apply Amazon’s logic and charge half a cent per hour per IP address, that Classless Inter-Domain Routing (CIDR) provides Amazon with a net value of a cool 6.3 billion dollars per year. Not too shabby.
But looking at the big stake Amazon has here, and seeing the various other netblock trades, reallocations, and reassignments, I was wondering — do we even know who owns what parts of the IP space? I mean, sure, we kind of ‘know’ in that this information is necessarily available… somewhere. But how do we view this data?
Now if you don’t happen to be a RIR yourself, how do you even look for this information? We know that CIDR block assignments are in whois, and while whois is great in that it’s dead simple and the output is really easy to read when you’re a human, trying to do anything at scale with whois data is going to be a mess.
“Some people, when confronted with a problem, think ‘I know, I’ll use whois.’ Now they have unstructured text problems.”
Fortunately for us, the RIRs publish statistical data themselves, in a well-documented format showing the ASN, IPv4, and IPv6 assignments they made jointly here (or per RIR for AFRINIC, ARIN, APNIC, RIPE NCC, and LACNIC). Here’s what that data looks like:
$ curl -s https://ftp.ripe.net/pub/stats/ripencc/nro-stats/latest/nro-delegated-stats | \
    grep "|ipv4|"
[...]
iana|ZZ|ipv4|0.0.0.0|16777216|19810901|reserved|ietf|iana
apnic|AU|ipv4|1.0.0.0|256|20110811|assigned|A91872ED|e-stats
apnic|CN|ipv4|1.0.1.0|256|20110414|assigned|A92E1062|e-stats
apnic|CN|ipv4|1.0.2.0|512|20110414|assigned|A92E1062|e-stats
apnic|AU|ipv4|1.0.4.0|1024|20110412|assigned|A9192210|e-stats
apnic|CN|ipv4|1.0.8.0|2048|20110412|assigned|A92319D5|e-stats
apnic|JP|ipv4|1.0.16.0|4096|20110412|assigned|A92D9378|e-stats
apnic|CN|ipv4|1.0.32.0|8192|20110412|assigned|A92319D5|e-stats
apnic|JP|ipv4|1.0.64.0|16384|20110412|assigned|A9252414|e-stats
apnic|TH|ipv4|1.0.128.0|32768|20110408|assigned|A91CF4FE|e-stats
[...]
$
So that’s pretty useful, but note that we don’t get the actual CIDR allocations — we get starting addresses and IP address count. We do get CC information (yay!), but no Autonomous System (AS) information and no ownership data. So not quite what we’re looking for.
But hey — we remembered that because whois is stupid, the Internet has agreed to use RDAP instead? That’s going to be neat! RDAP is RESTful! It’s JSON! It’s specified in RFCs (so many, many, maaaaany, many RFCs), and there’s even actually useful documentation!
$ curl -s -L https://rdap.db.ripe.net/ip/2.19.4.0
{
  "handle" : "2.19.0.0 - 2.19.15.255",
  "startAddress" : "2.19.0.0",
  "endAddress" : "2.19.15.255",
  "ipVersion" : "v4",
  "name" : "AKAMAI-PA",
  "type" : "ASSIGNED PA",
  "country" : "EU",
  "parentHandle" : "2.16.0.0 - 2.23.255.255",
  "cidr0_cidrs" : [ {
    "v4prefix" : "2.19.0.0",
    "length" : 20
  } ],
  "status" : [ "active" ],
  "entities" : [ {
    "handle" : "AKAM1-RIPE-MNT",
[...]
This looks pretty useful, but of course in the end I used a combination of all these intersecting sources of truth: I simply started at 0.0.0.0, looked up the RDAP information, extracted the endAddress, determined the immediately following address and repeated the RDAP lookup, iterating over the entire IPv4 space in this manner. (If you’re interested, this is the Perl script I used to pull RDAP data in various iterations. The data I collected using this tool can be found here (3.5MB xz compressed)). I then performed a DNS lookup against Team Cymru’s IP to ASN service, and cross-referenced all that with the data from published RIR statistics using the usual hodgepodge of Perl, awk(1), and shell glue.
Now the thing about using multiple sources of truth is — as anybody who has ever tried to create, use, or interact with, for example, an asset inventory can tell you — that you at best get an intersecting view of all the different sources…

‘whois is stupid, use RDAP. It’ll be great!’ … they said
The fun part about collecting large amounts of data from different sources on the Internet using a standardized protocol is how it ruins your belief in standardized protocols while simultaneously making you bang your head against all the edge cases you run into.
RDAP has a lot going for it, but the service is run by more than five major parties (the RIRs plus various regional NICs). I found numerous errors and problems:
- HTTP redirects with and without payload bodies.
- Redirect loops between RIRs (to name but one example, an RDAP lookup for
45.68.33.0used to redirect-loop between ARIN and LACNIC. This was fixed after I reported it to both registries). - RDAP IP query results don’t include AS numbers (
whoissometimes does). - AFRINIC has API limits, but won’t tell you what they are.
- Upon exceeding the unknown API limit, AFRINIC returns a 429 status code (yay), but without a Retry-After header (boo).
https://rdap.registro.br/will tell you that their API limit is 1 request every 20 seconds; if you exceed it, it’s 403 Forbidden — goodbye! (Time to rotate source addresses…)- AFRINIC sometimes returns a netmask of -1 (for example,
196.28.253.0/22). endAddressmay not match the last address of theCIDR0_CIDRS(this can happen for partial CIDR block allocations (CIDR0_CIDRSmay represent the full CIDR block, while theendAddressfield only represents the last IP address in the allocated portion of the block) or for aggregated CIDR blocks (CIDR0_CIDRSmay represent the aggregated CIDR notation, while theendAddressfield represents the last IP address in the entire aggregated range).- ARIN and LACNIC do not include CC info in RDAP.
- JPNIC doesn’t include an allocation type, literally setting it to
null. - …
So yeah…
RDAP: Same GIGO as ‘whois’, but at least it’s JSON.
IPv4 allocations by CC
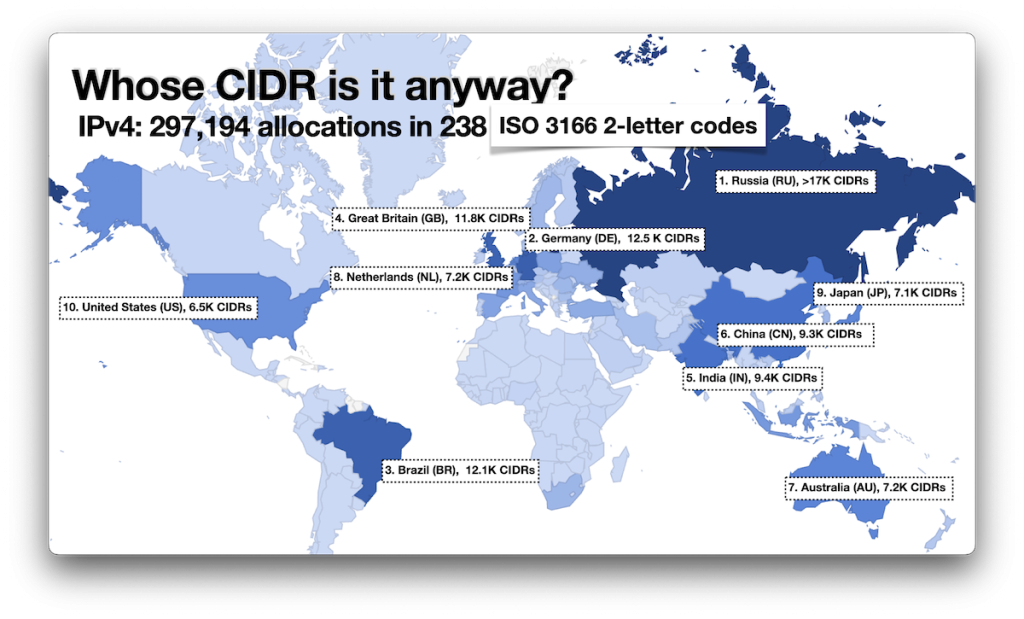
After collecting and correlating all the data, I ended up with information about 300K CIDR allocations (the actual number of allocations is larger. In processing the data, I combined adjacent allocations to the same entity, such that, two /24s would be rolled up into a single /23, or two sequential /23s into a single /22) in almost 240 economies (the United Nations recognizes 193 member states plus two observer states (the Holy See and Palestine); the CIA World Factbook also notes Taiwan, Kosovo, and Western Sahara. IANA defines 316 ccTLDs in the Root Zone Database, while there are 249 ISO 3166-1 alpha-2 codes). The top ten economies by CIDR allocation count (it’s worth noting that just because a CIDR is marked as being allocated for a given economy doesn’t mean that that is where it is actually used) are:
But not all CIDRs are equal — having hundreds of /24s assigned doesn’t make up for having a single /8 assigned. Maybe counting IP addresses might be better? We can easily add up the numbers and then compare them to the grand total IPv4 address space:
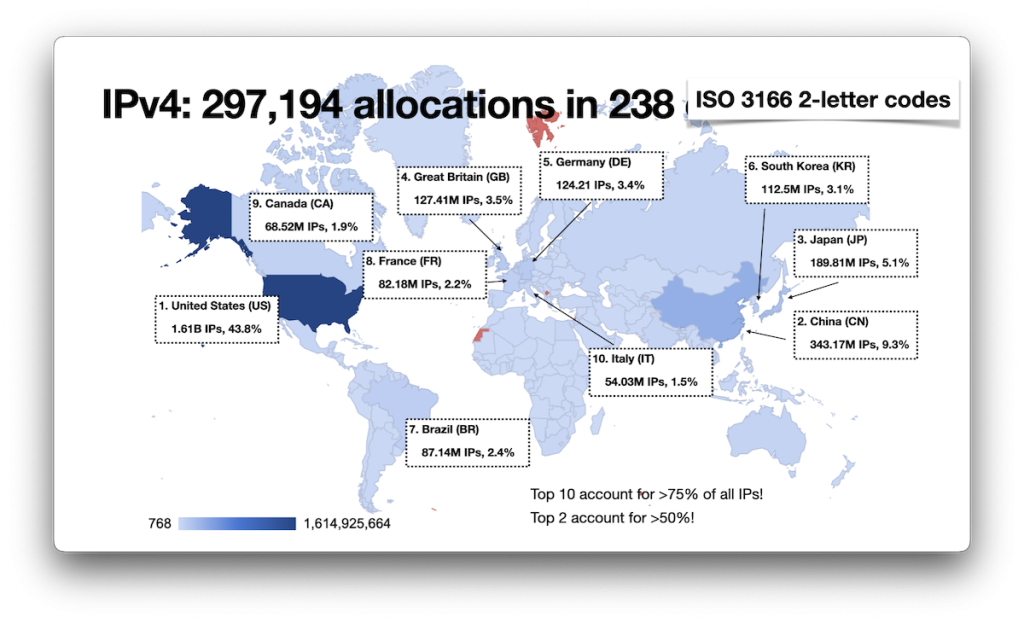
What stands out here is of course the huge number of IP addresses allocated to the US, as well as the fact that the US and China together account for over 50%, and the top ten economies for over 75% of the entire IPv4 address space.
IPv6 allocations by CC
For IPv6 allocations, my data is based only on the RIR statistics. By and large, the information there is much less interesting, simply because the IP space is so huge that centralization really isn’t a problem. I’ve included IPv6 findings here for the sake of completeness:
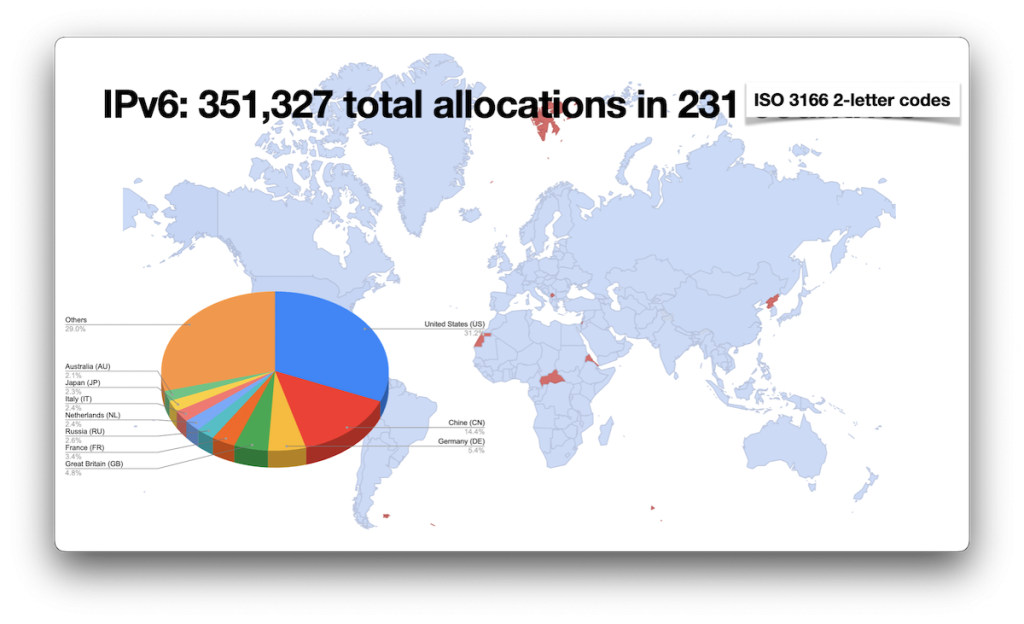
Of interest here is the fact that, apparently, there have been no IPv6 allocations for Central African Republic, Eritrea, and North Korea (as well as, perhaps less surprisingly, Antarctica, Falkland Islands, French Southern and Antarctic Lands, Kosovo, Svalbard and Jan Mayen, and Western Sahara).
IPv4 allocations by RIR
AFRINIC
If we look at this from an RIR perspective, we note that AFRINIC covers a lot more than just Africa, although the top ten allocations made by AFRINIC — accounting for over 80% of all of its allocations — are within that continent. Well, with the exception of Hong Kong:
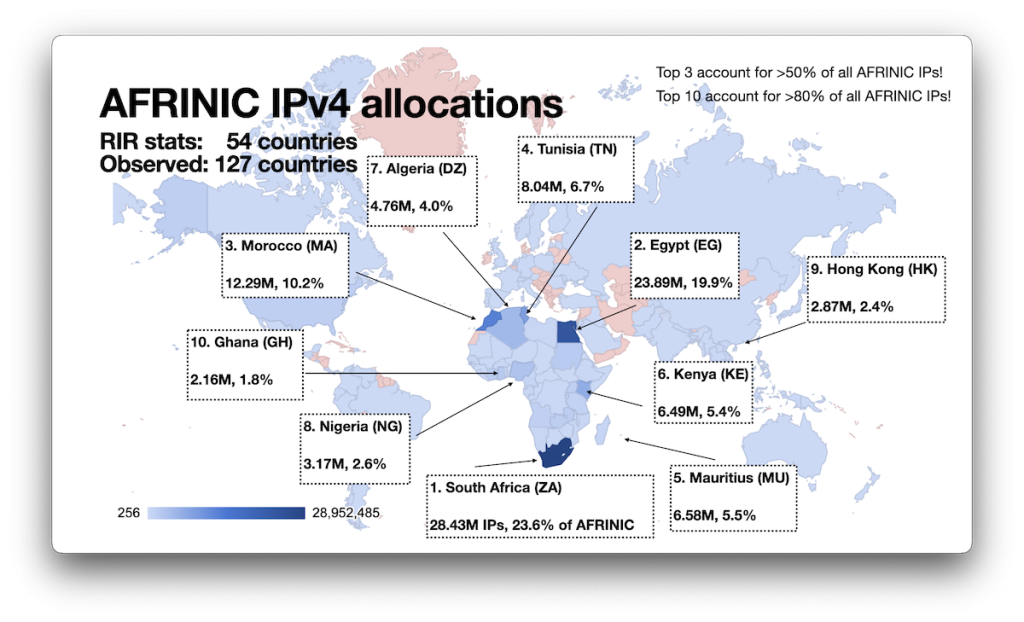
One thing to note here is that the RIR statistics only identify 54 economies to which AFRINIC allocated IP blocks, but the data collected from RDAP hints at a much broader spread. This suggests that there is a pretty active trade of CIDR blocks taking place here.
Another surprise (to me, at least) was the large allocation made to Mauritius, a comparatively small economy. Normally, I’d have expected allocations to be roughly proportional to population although perhaps the economic weight of an economy plays a bigger role here: Mauritius was ranked 3rd within Africa, at least in 2014. But then again, there’s also the fact that AFRINIC has its headquarters in Mauritius… naaaaah.
APNIC
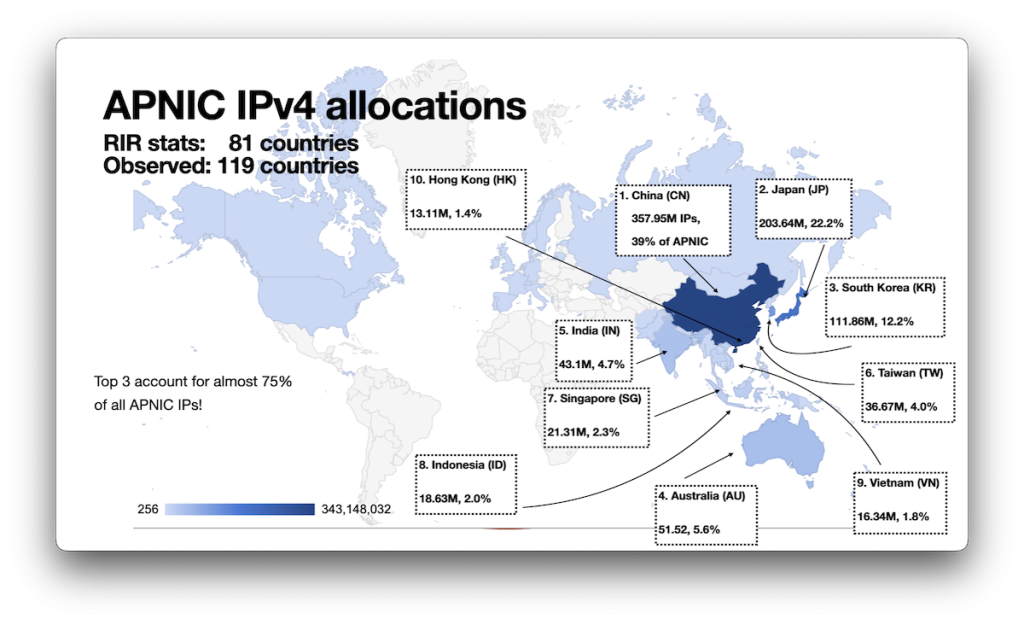
APNIC, not surprisingly, has China as the economy with the most IP addresses, followed by Japan and South Korea, with the rest of the top ten at least all within Asia, albeit once again highly concentrated: China, Japan, and South Korea account for almost 75% of all of APNIC allocated IP addresses:
ARIN
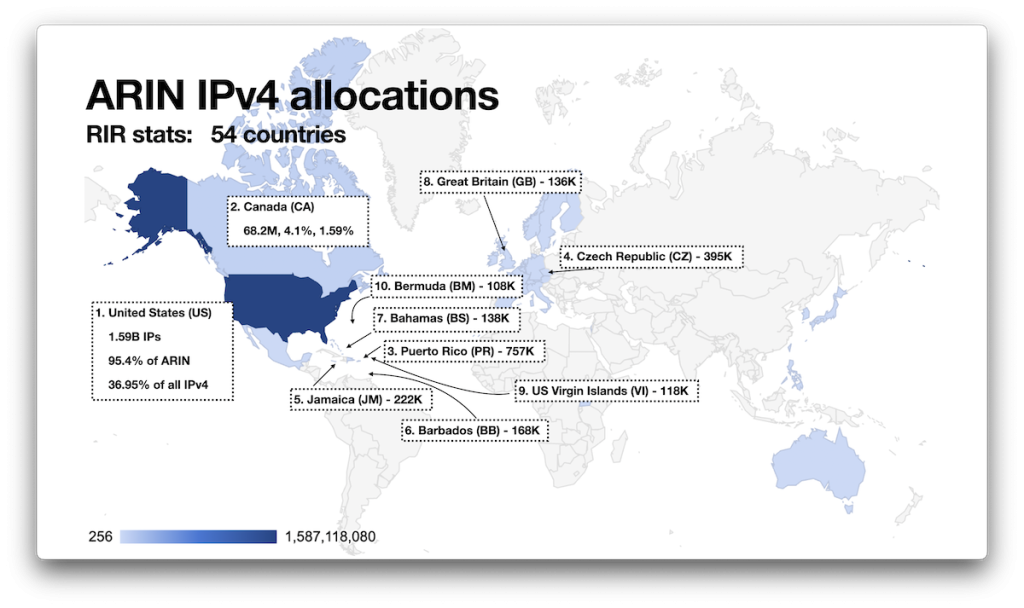
The geographical distribution of the IP addresses allocated by ARIN here is derived only from the RIR statistics since the RDAP data provided by ARIN does not include CCs. As with the other RIRs, we see allocations well outside their supposed geographical region, and of course, the main outlier is, unsurprisingly, the United States, accounting for over 95% of all of ARIN’s allocations:
LACNIC
Like ARIN, LACNIC’s RDAP service does not provide CCs (although nic.br does), so these stats here are again only based on the RIR statistics:
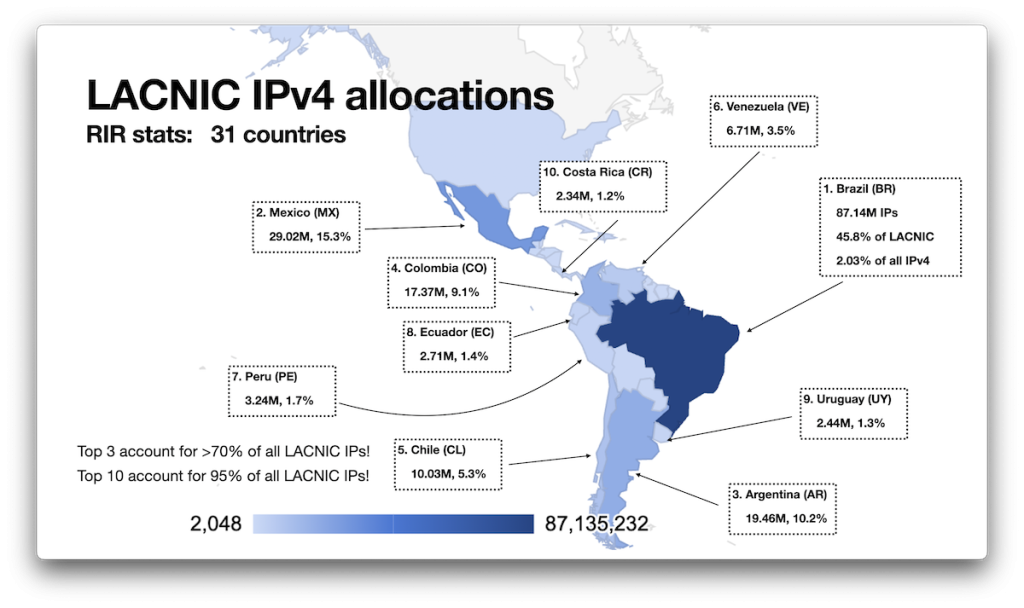
Note that LACNIC appears to be the most regionally restricted registry, pretty much staying within the assigned boundaries, if you will. That is, there appear to be fewer trades of IP blocks to LACNIC from the other RIRs.
RIPE NCC
Now our nicely redundant European IP Networks Network Coordination Center is the RIR with the broadest global reach, responsible for allocations in a surprising 164 economies around the globe:
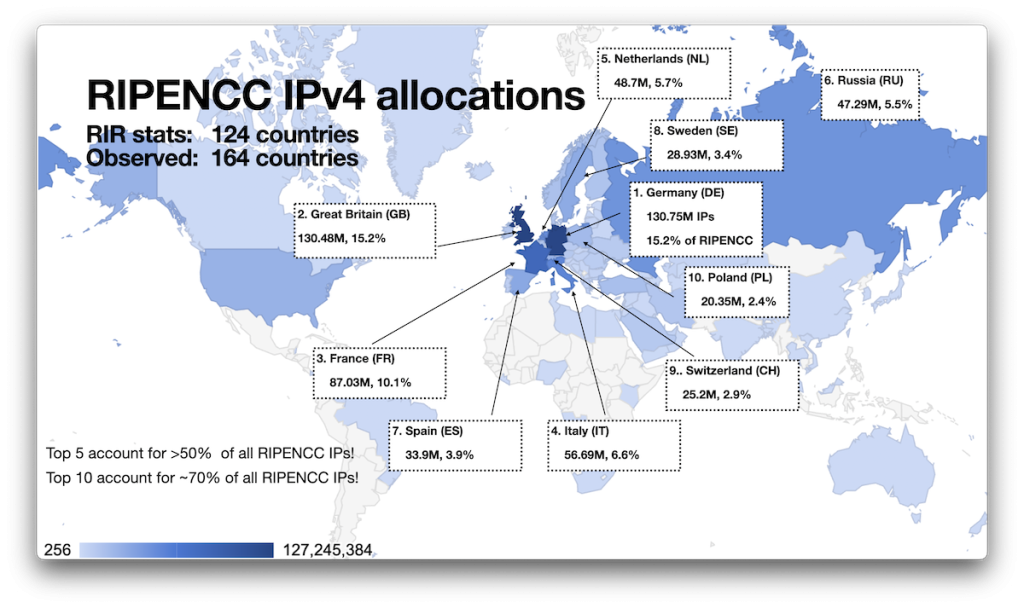
Allocations by allocation type
Another thing I looked at was what types of netblocks were assigned by the different RIRs. This information is found in the RDAP responses, and remember, RDAP is great because it’s well-defined! For example, RFC 9083 tells us:
type — a string containing an RIR-specific classification of the network per that RIR’s registration model
RFC 9083
Oh, goodie, a string. Well. Yeah. It won’t come as a surprise to you then that different RIRs chose to define different strings:
- AFRINIC: Seven types (defined here)
- ARIN: Four types (defined here)
- APNIC: Five types (defined here)
- LACNIC: Five types observed
- RIPE NCC: 11 types defined (here), seven observed
See for example, APNIC’s explanation of the different allocation types; in general ‘PA’ stands for ‘Provider Aggregatable’, while ‘PI’ stands for ‘Provider Independent’.
The full distribution of all 22 distinct allocations by type is shown in Figure 15.
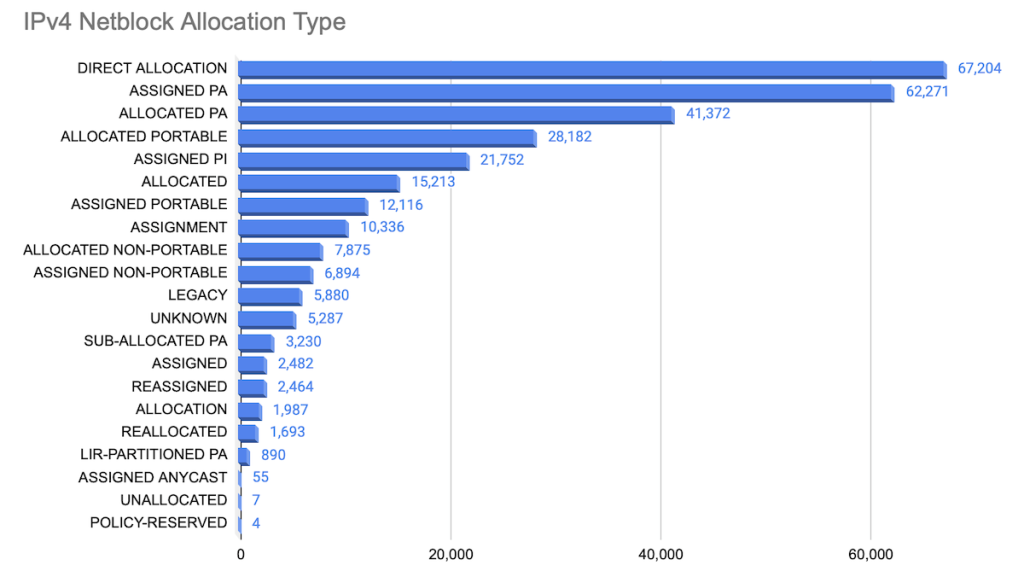
This data comes with one caveat: JPNIC’s RDAP results consistently had the ‘Allocation Type’ field set to null. But let’s compare these allocations by RIR (Figures 16 – 20).
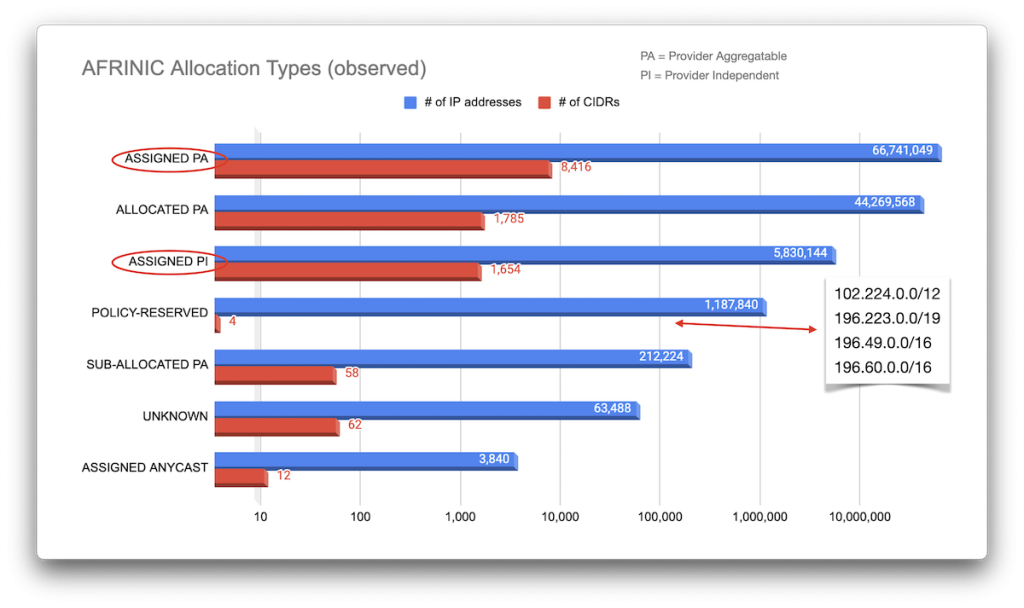
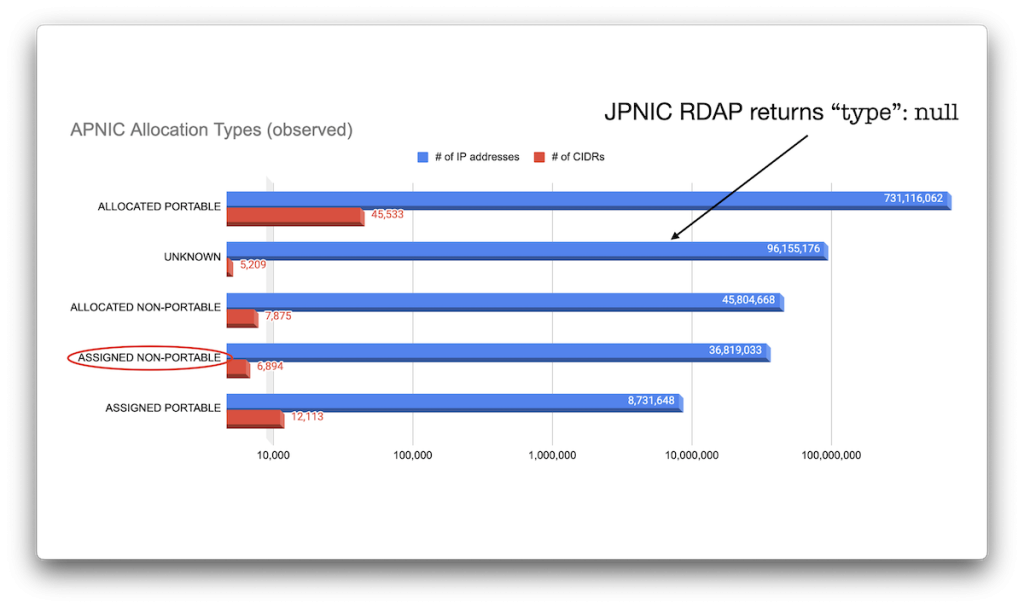
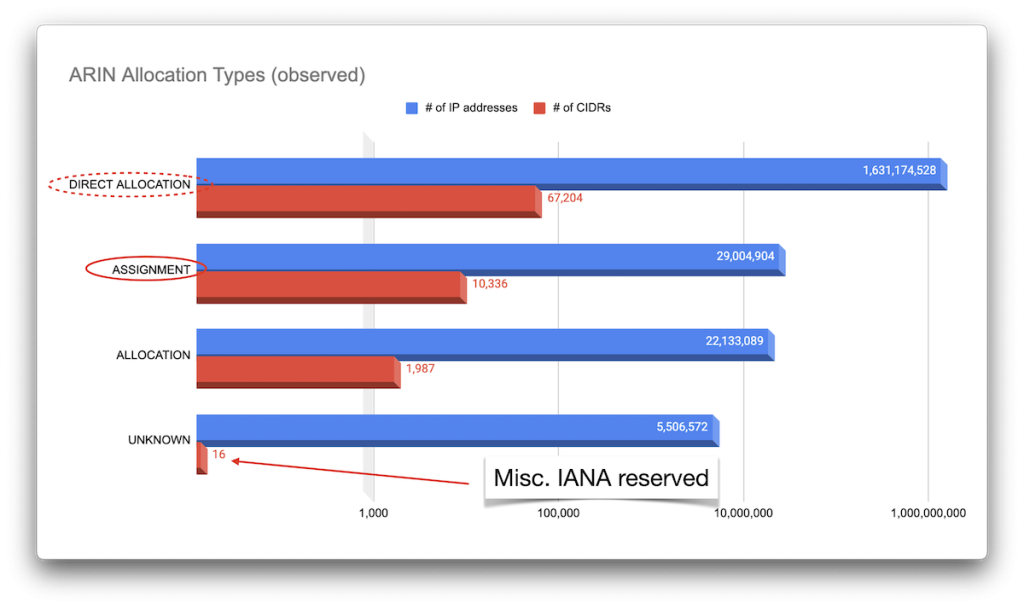
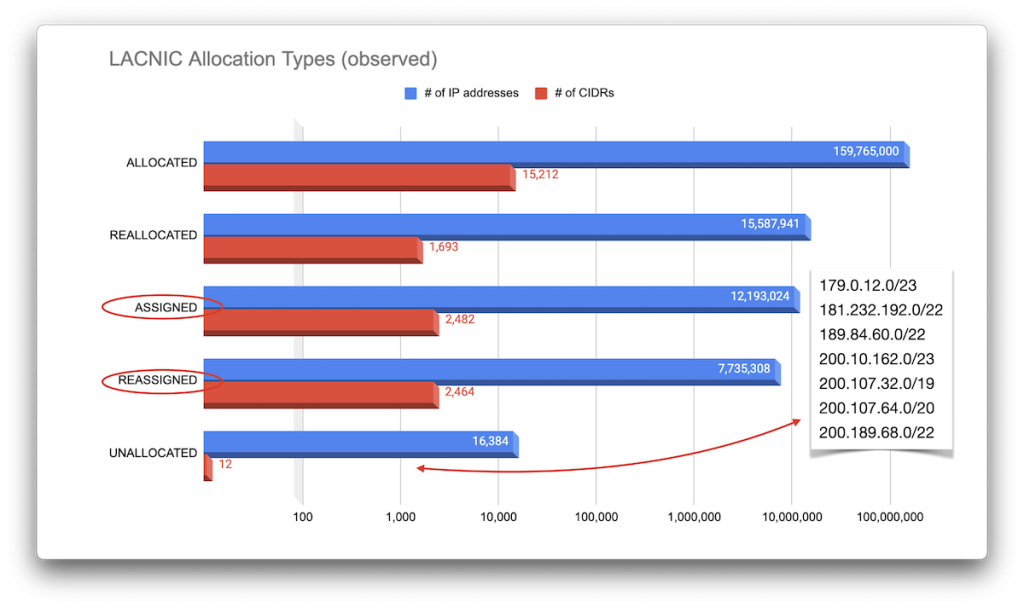
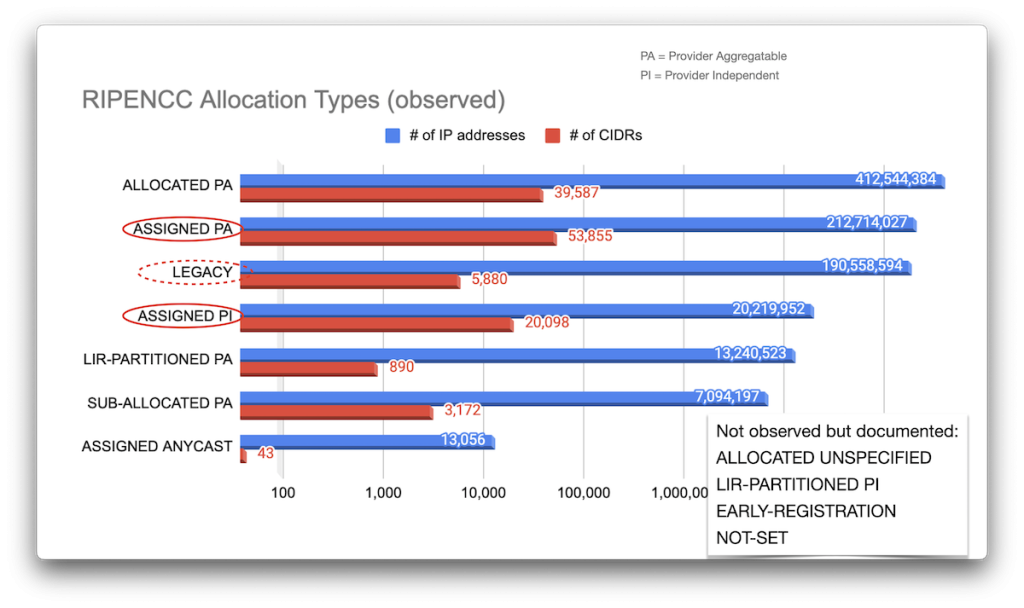
To help us answer our question of who owns the CIDRs, it probably makes sense to separate allocations for local registries from those for end users. Unfortunately, different RIRs use different types for these (circled in red in each of the images above), but in reality, this is a difficult distinction to make.
For example, ARIN’s ‘DIRECT ALLOCATION’ ought to be for local registries and ISPs / telcos, but it’s not clear whether, for example, a bank that may reallocate netblocks for its ATM network be considered a local registry; for our purposes here, they are the same owner. Oh, and of course RIPE NCC’s ‘LEGACY’ assignments may or may not be end-user allocations. Who knows.
Allocation sizes
Next, I looked at how large the allocated netblocks are. I found 25 different CIDR sizes, with ~5K allocations with /n < /16, and ~7.2K allocations with /n > /24. The majority were /24s, /22s and /23s, but there are of course still 23 /8s, 11 /9s, and a non-negligible number of outliers on either end of the spectrum (Figure 21).
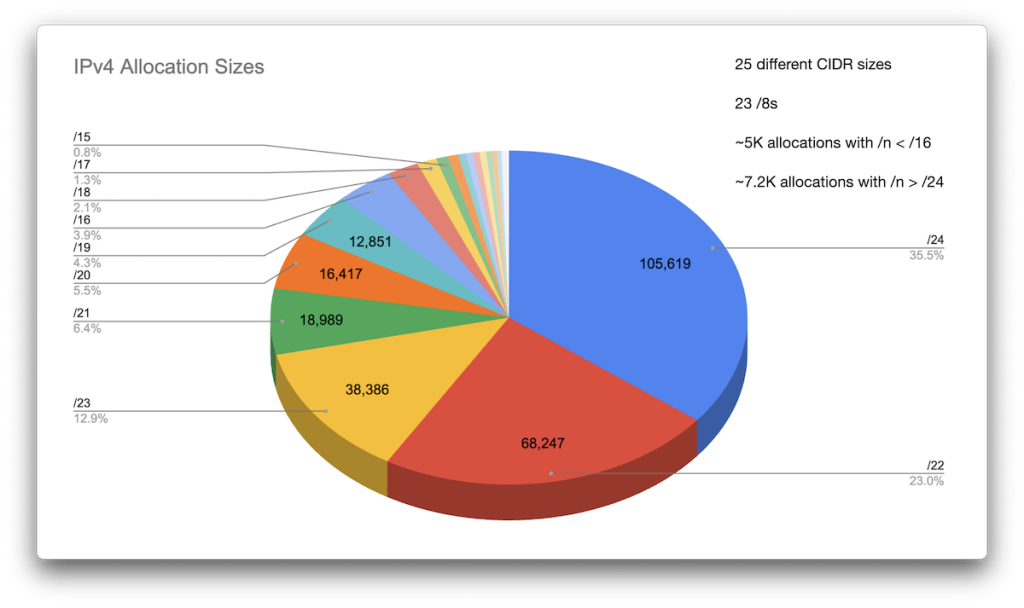
Data science nerds tell me that pie charts are terrible, so here’s a Pareto chart of the same data (Figure 22).
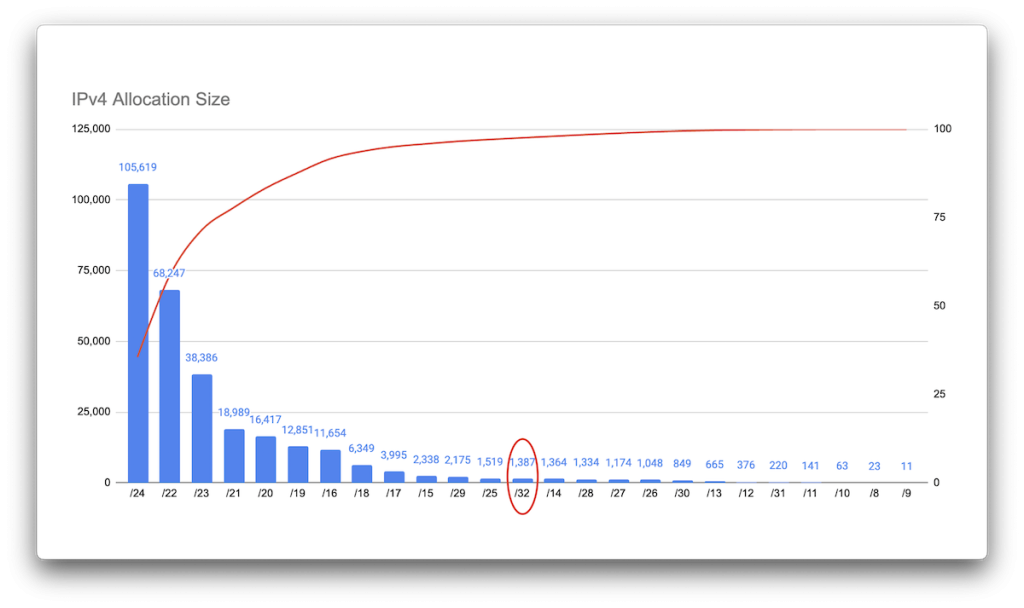
What surprised me a bit was the notable number of /32 allocations (1,387), but otherwise entirely unsurprisingly, /24 allocations are the most common ones by far, which is reflected in all of the RIR’s allocations as well — except LACNIC, which appears to favour /22s. (You can see Pareto charts for each RIR here: AFRINIC, APNIC, ARIN, LACNIC, RIPE NCC.)
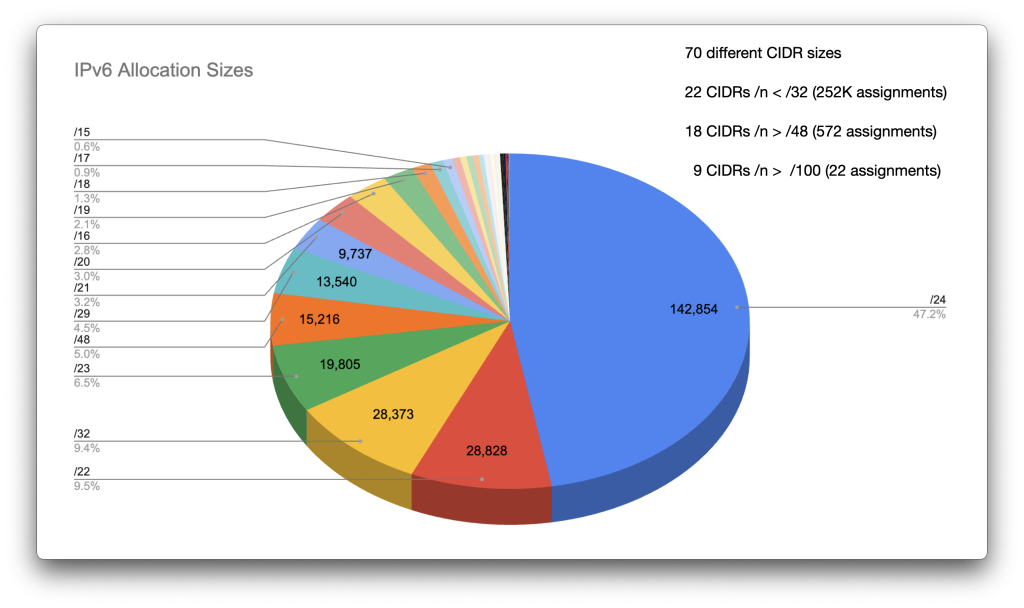
Just for kicks, I also checked the IPv6 allocation sizes (70 different allocation sizes; 22 CIDRs /n < /32 (252K assignments), 18 CIDRs /n > /48 (572 assignments), 9 CIDRs /n > /100 (22 assignments)), and there, too, a /24 was the most popular one. Of course in IPv6 a /24 is something like two decillion IP addresses rather than 256, but ok.
Allocations by net name
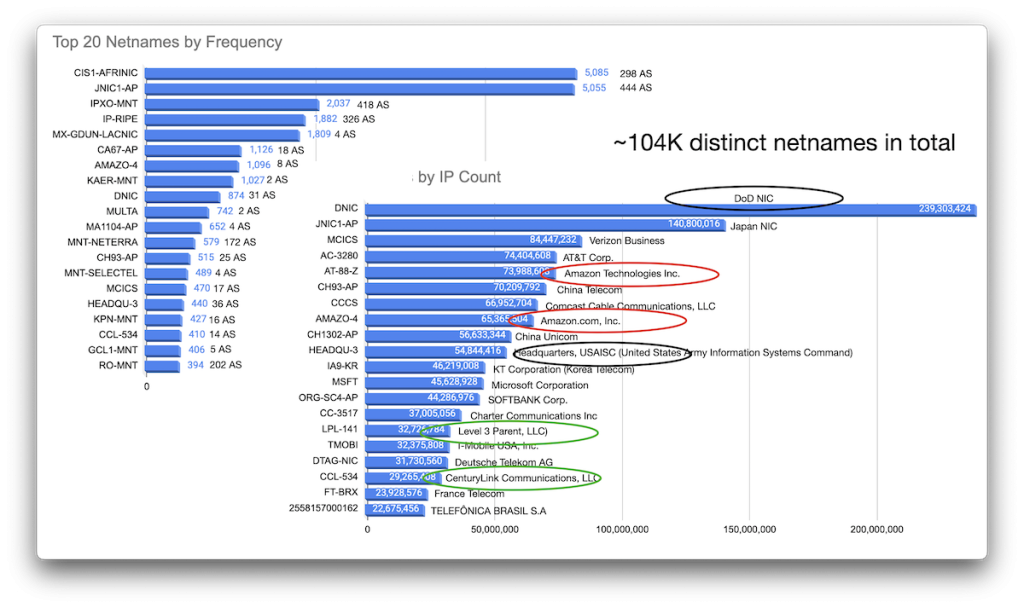
But I’m still looking for the actual owner names of the netblocks. RDAP (much like whois) identifies the subnet with a ‘netname’, so we can count those by frequency of allocations as well as by the total number of IP addresses allocated to a given netname.
Each netname may be associated with a large number of distinct ASNs, and netnames are of course not necessarily very descriptive or revealing — you need a fair bit of human correlation to try to map these names to actual organization names.
What’s more, sometimes you need to know (or deduce) that different entities actually are one and the same: ‘Amazon Technologies Inc.’ and ‘Amazon.com Inc.’ are obviously related, but the fact that networks identified as being owned by ‘Level 3 Parent LLC’ and ‘Century Link Communications’ have the same parent owner (Lumen Technologies, Inc. in this case) is far from obvious. After my presentation at RIPE 88 (slides, YouTube), I was informed of a rather useful-looking tool that promises to map legal entities via their Legal Entity Identifier (LEI) and which might facilitate a more automated approach for this correlation: LEI Search.
Allocations by ASN
Trying to map the data by correlating IP addresses to ASNs (as noted above, primarily via Team Cymru’s IP to ASN service), I found around 63K distinct ASNs (Figure 25).
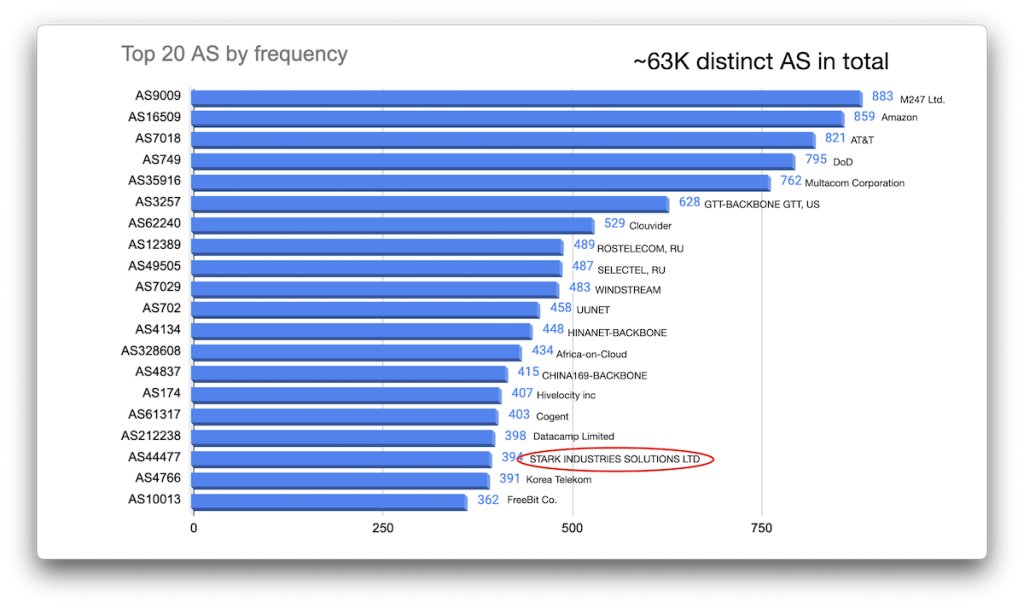
(And yes, the highlighted ‘Stark Industries’ in this graphic is the one recently discussed by Brian Krebs in a different context. I merely mentioned it because it struck me as a very tech-bro kind of name).
But the frequency of AS observed is one factor. If we tally up the IP addresses for a given CIDR and map those by AS, a different view emerges (Figure 26).
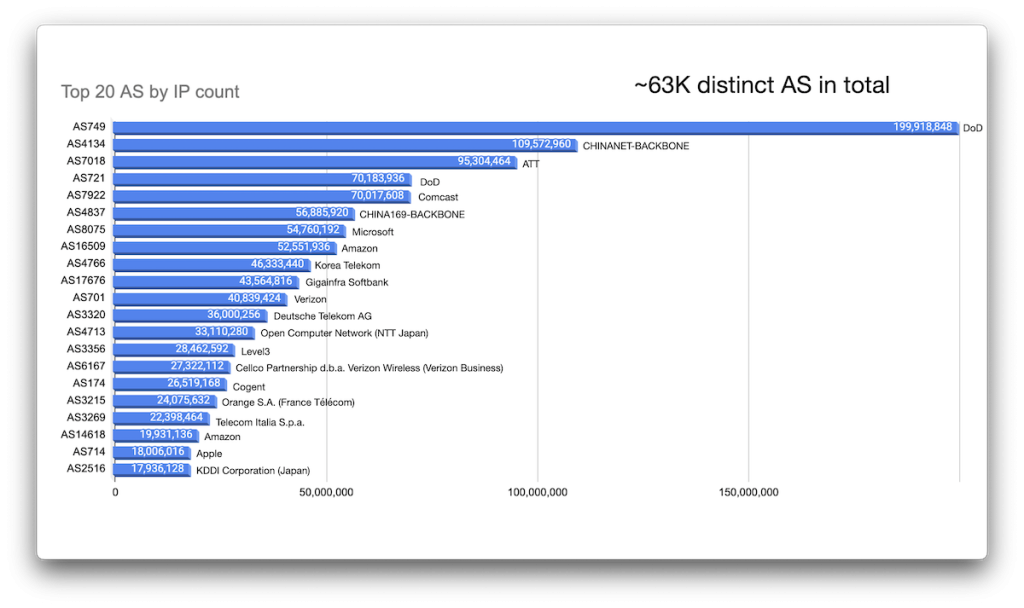
In other words, we find ourselves as one of the blind men touching an elephant — we get different views from different sides without really getting the whole view. Trying to combine the ASNs and netnames and manually correlating them to entities, I came up with a rough distribution of the top organizations owning the largest number of IP addresses, which make up a sizable portion of all IP space and answer our initial question at least somewhat. The top ten (by this count, anyway), are:
- US Department of Defense (DoD) (352M IP addresses, 8.19% of all IPv4 addresses)
- Amazon (181M, 4.21%)
- China Telekom (112M, 2.61%)
- AT&T (111M, 2.59%)
- Verizon (101M,2.35%)
- Comcast (71M, 1.64%)
- Lumen Technologies (65M, 1.52%)
- Microsoft (59M, 1.37%)
- Softbank (48M, 1.1%)
- Korea Telekom (46M, 1.08%)
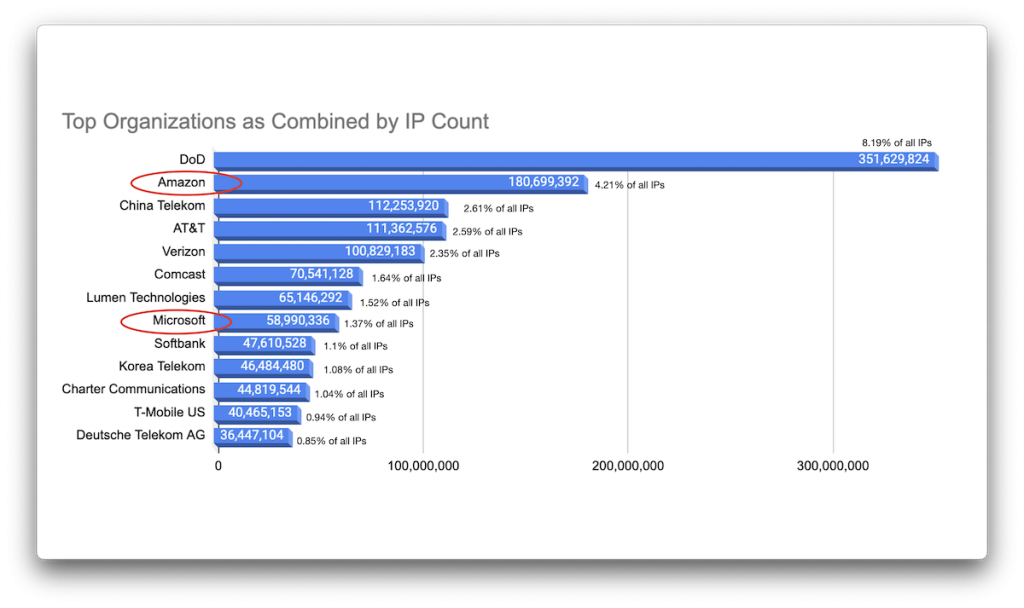
One thing to call out here (besides the DoD being an obvious outlier) is that there are only two companies that are not telecom providers: Amazon and Microsoft. All others are, effectively, ISPs, and telcos.
Summary
Hmm, so that’s a lot of data, all presenting a slightly different view. Does the data answer our leading question of who owns which CIDRs? Only to some extent, really. The whole exercise is a bit frustrating, but here are some concluding findings:
First of all, it’s really difficult to differentiate between ‘end users’ and Local Internet Registries (LIRs). Is Amazon an LIR because via AWS different customers use their IP space?
We also find several inconsistencies in different RIR definitions, which makes it difficult to correlate data, and some of the data in RDAP is inconsistent within a single RIR, flawed, or incomplete. I’ve reported a few findings to the different RIRs; some of the findings have been addressed, but overall it strikes me as an area with much room for improvement.
Another thing that surprised me a bit was that the RIRs seem a lot less regional than you might think, due to blocks being traded, transferred, or assigned to entities outside of their region.
But overall, based on what I saw, it looks like roughly 30% of all IP addresses are managed by just a few organizations, and of course, the DoD still owns the bulk of it. (Remember the Mystery of AS8003? The Internet kind of lost its shit there and assumed all sorts of nefarious reasons behind that — and of course, things did break because some people had simply squatted on that IP space internally and got a fun surprise that morning. This IP space is now announced via the DoD’s AS749.)
We’ve seen that other than ISPs / telcos or LIRs, for whom it seems reasonable to own large parts of IP space, there are only two large Internet companies among the top ten. These two companies also happen to control other aspects of the Internet or industry and marketplace, hinting at a trend in centralization once more.
And lastly, doing the same exercise with IPv6 is a lot less interesting. There’s just so much of it that the considerations of trading netblocks and so on are just not as relevant. IPv6 is boring. And that’s a good thing. I really like boring — we should do more of that. Perhaps even before 2035.
Jan Schaumann is a Distinguished Infrastructure Security Architect, and Adjunct Professor of Computer Science, with an interest in information security and the overall health of the Internet, as well as the safety and privacy of its users. You can follow Jan on Mastodon.
This post is adapted from the original at Jan’s Blog.
The views expressed by the authors of this blog are their own and do not necessarily reflect the views of APNIC. Please note a Code of Conduct applies to this blog.

So much fun reading. What I needed to start the day and glad you wrote this and I had time to read. I will go back to reading the prior blogs as a result. (A little more time on my hands and as a user since 1983 and my first consultant I hired started his journey in ~1967 on ARP Network designs and implementations. What was not surprising is the final display of results except I thought I would see more Google. It kind of makes sense. As I have been working on new encryption methodologies, we have new implementations to announced July 2024 and we also are concerned that network administrators will deploy when crisis hits.)