

Traditional wisdom tells us that DNSSEC validation uses more computer resources than non-validated responses. But is it true?
We at Internet Systems Consortium (ISC) decided to test the theory and ran some specific tests to look at the performance effects of DNSSEC validation in BIND 9: These tests looked at latency, bandwidth, CPU consumption, number of operating system sockets, and memory.
Everything starts with the dataset
Realistic data is crucial in experiments like these. Fortunately, a real European telco gave us actual anonymized data with a mix of landline and mobile clients gathered during February 2022.
In our tests, we looked at opposite ends of the data spectrum: A lightly loaded server handling 9,000 queries per second (QPS), and a heavily loaded resolver seeing 135,000 queries per second.
We took our huge dataset and downsampled it into smaller sets. We split them into complete sets of queries by source IP address; if the client IP address was included in the dataset, all the queries were included, and if the client IP address was not included, no queries were included. This was important because we needed to keep the cache hit/miss rate exactly as it was in the live dataset.
Test setup
Our test resolver was running BIND 9.18.4 (the latest stable version at the time), and we started each test run with an empty cache. We tested two configurations: One with validation enabled, and one without. Everything else remained the same between the two sets of tests.
We simulated the queries using DNS Shotgun, which replays a packet capture (PCAP) and then records the exact timing of queries and replies to the resolver.
Then came the hard part: Dealing with the Internet. We needed authoritative servers, including timing, latency, and reliability, which are hard to measure and simulate. So our test server was measured against the live Internet. Of course, that causes lots of noise. To counter that, we repeated each measurement ten times and then performed statistical post-processing. Resource-consumption charts in this article show average values over ten measurements as a solid line, and the coloured background shows a range between minimum and maximum values across all ten measurements.
We were concerned with resources consumed on the resolver side, so we needed tools to monitor resource consumption. We wrote scripts that scraped files in /proc and /sys and stored them on disk with timestamps. When everything was complete, we post-processed the raw test files to generate charts.
Scenario 1: 9,000 QPS
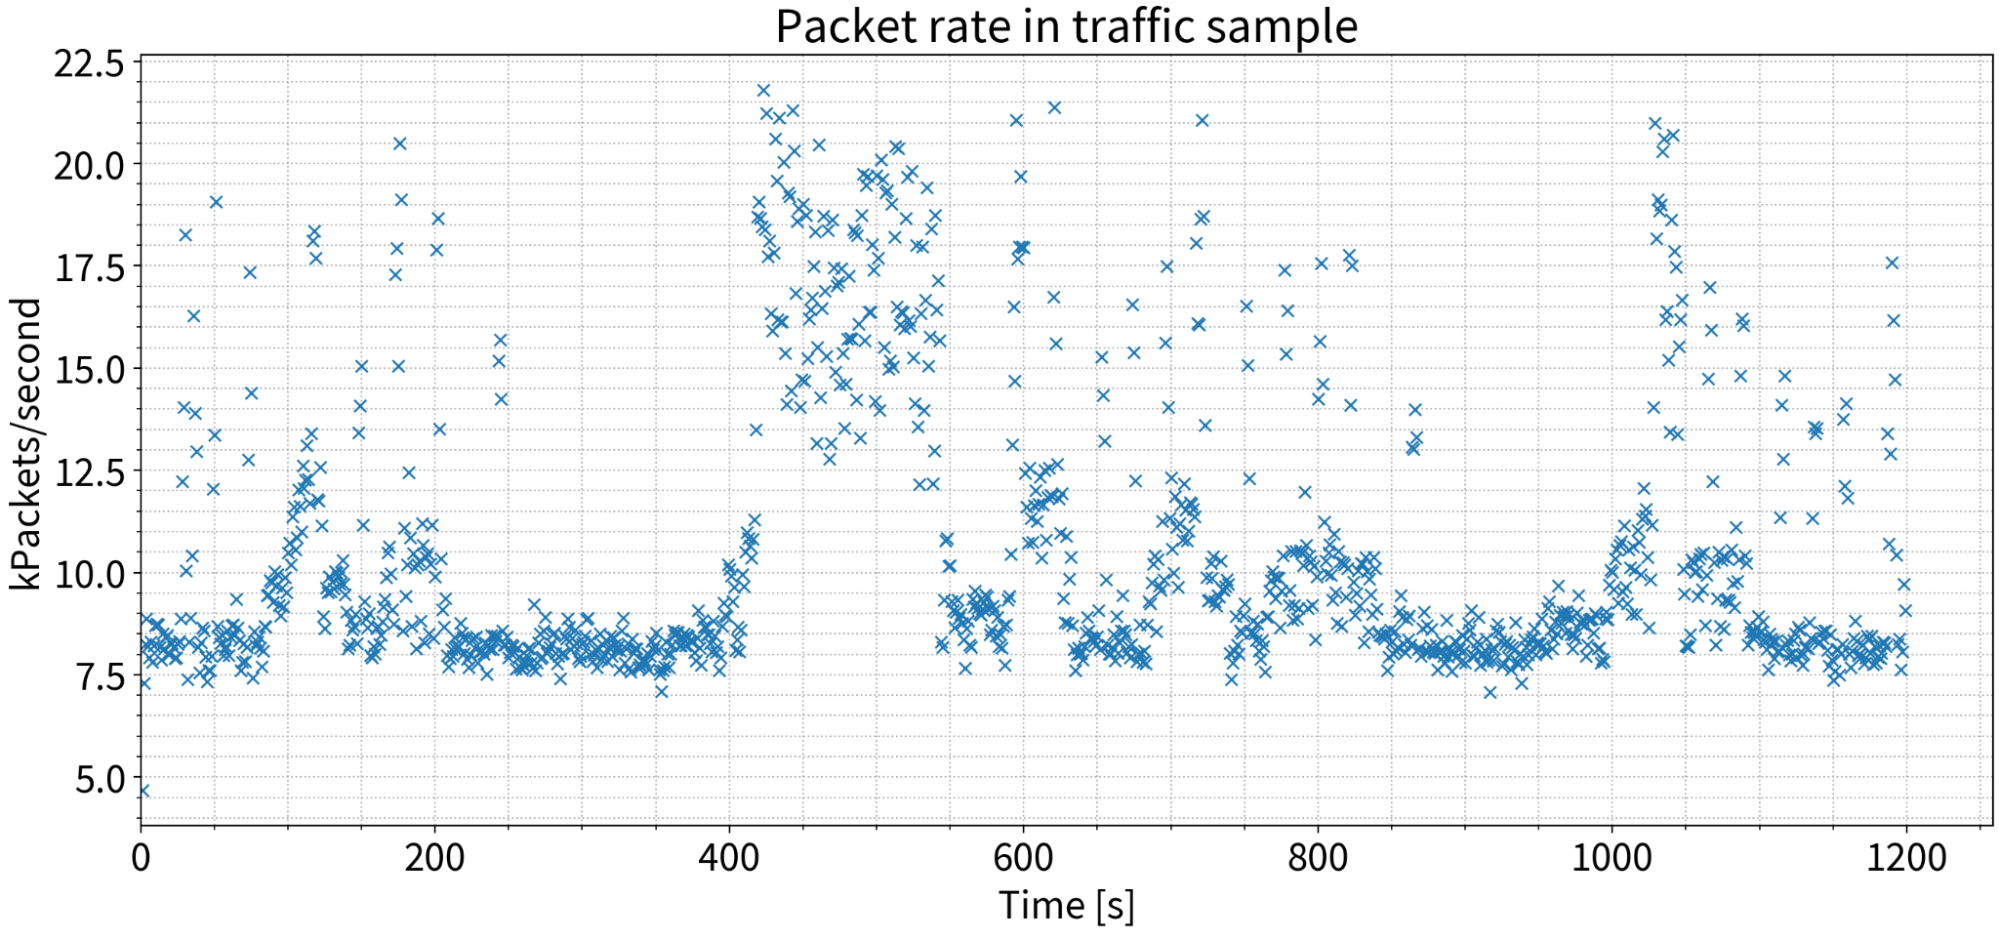
Note that the 9,000 QPS is not a steady query rate like you would get from DNSperf or a similar tool. The packet rate from the PCAP we used as input for DNS Shotgun jumps around, like a live network.
Latency
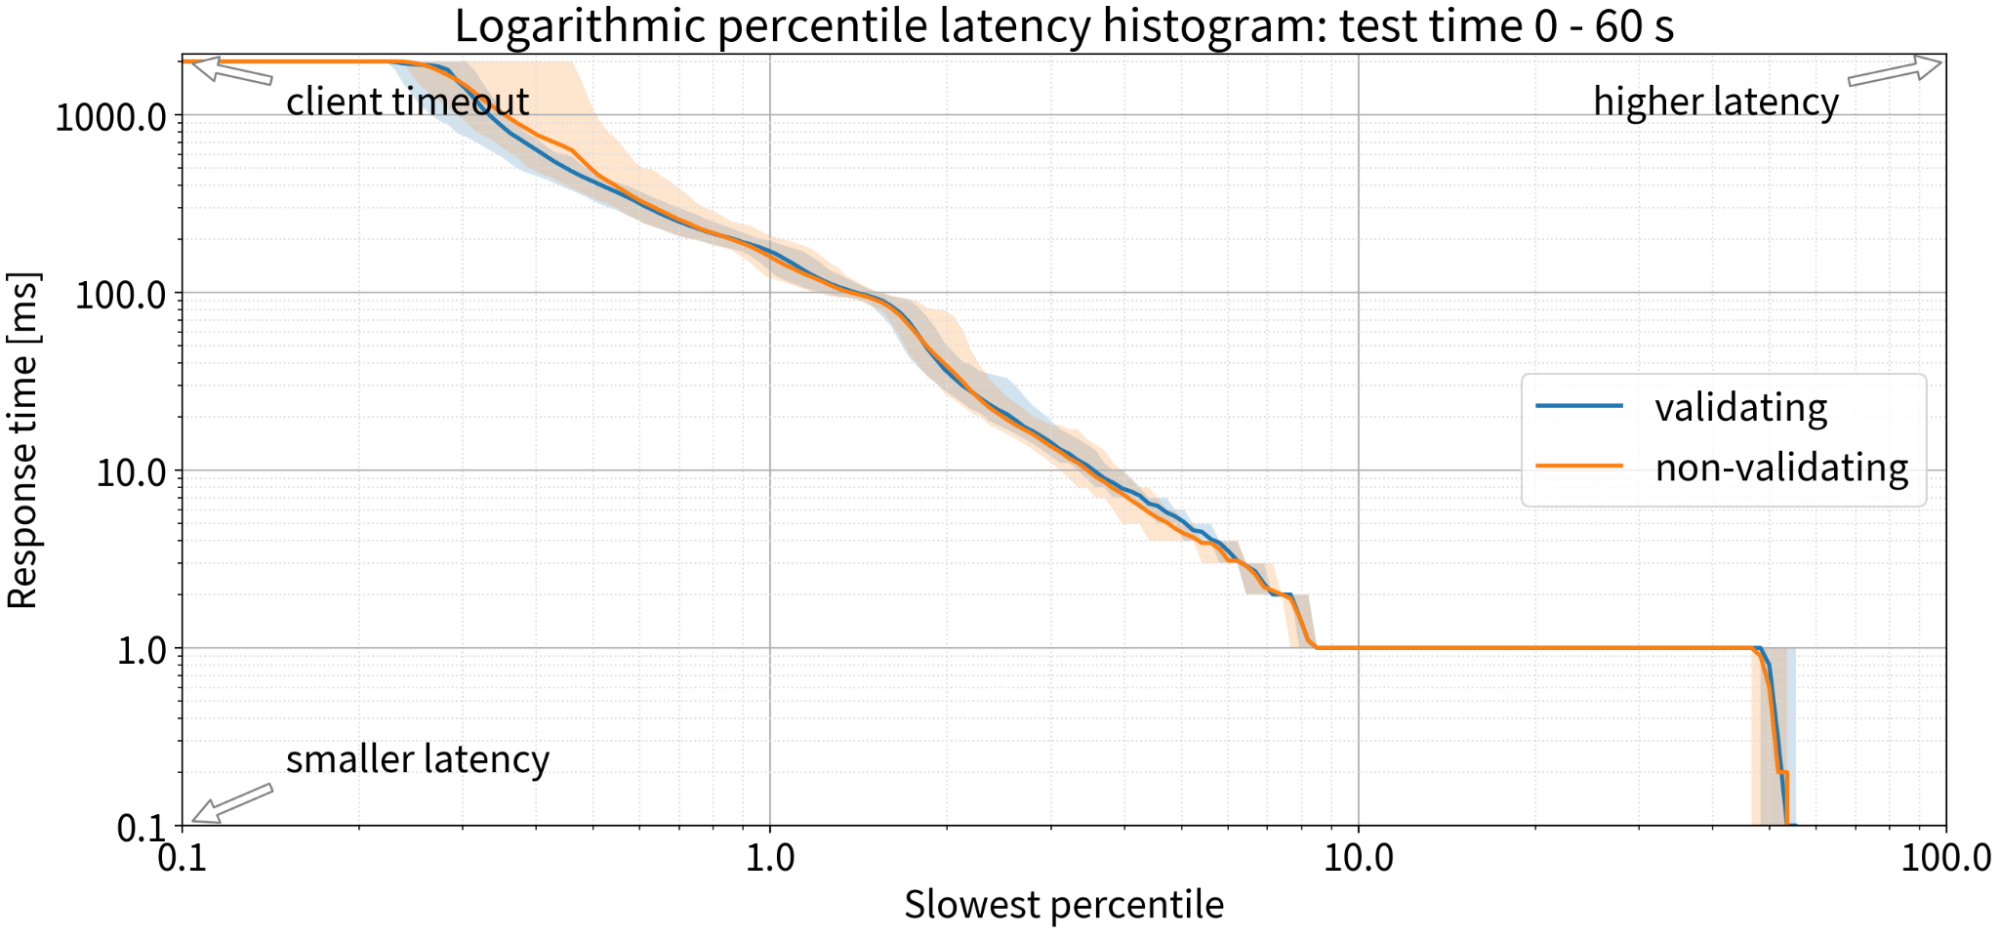
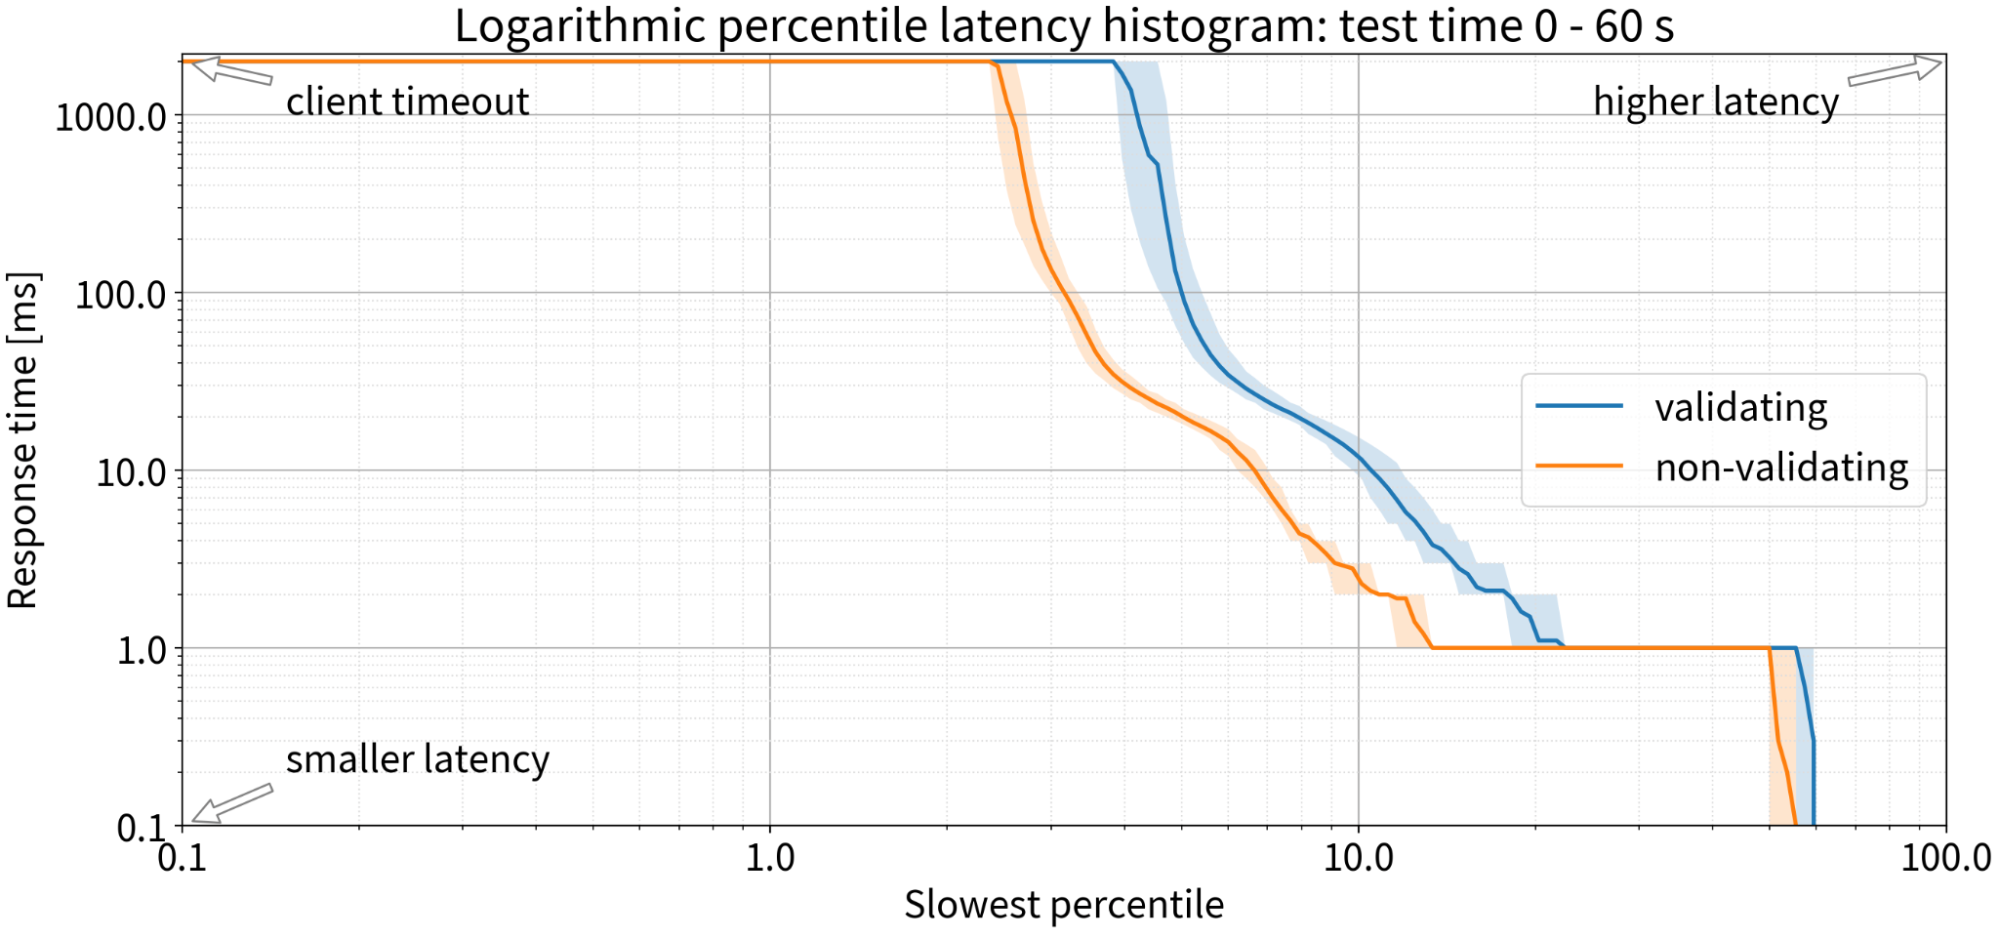
Since we’re talking about the DNS, we’re obliged to be obsessed with latency. Traditional DNSSEC validation wisdom tells us that there should be a significant increase in latency because validation is complex, but our experiment doesn’t agree: The latency we saw with both validating and non-validating resolvers was practically the same. In both cases, 90% of the queries were answered within 1 ms; only 10% took 1 ms or more to receive a response, in the first minute, with a completely empty cache.
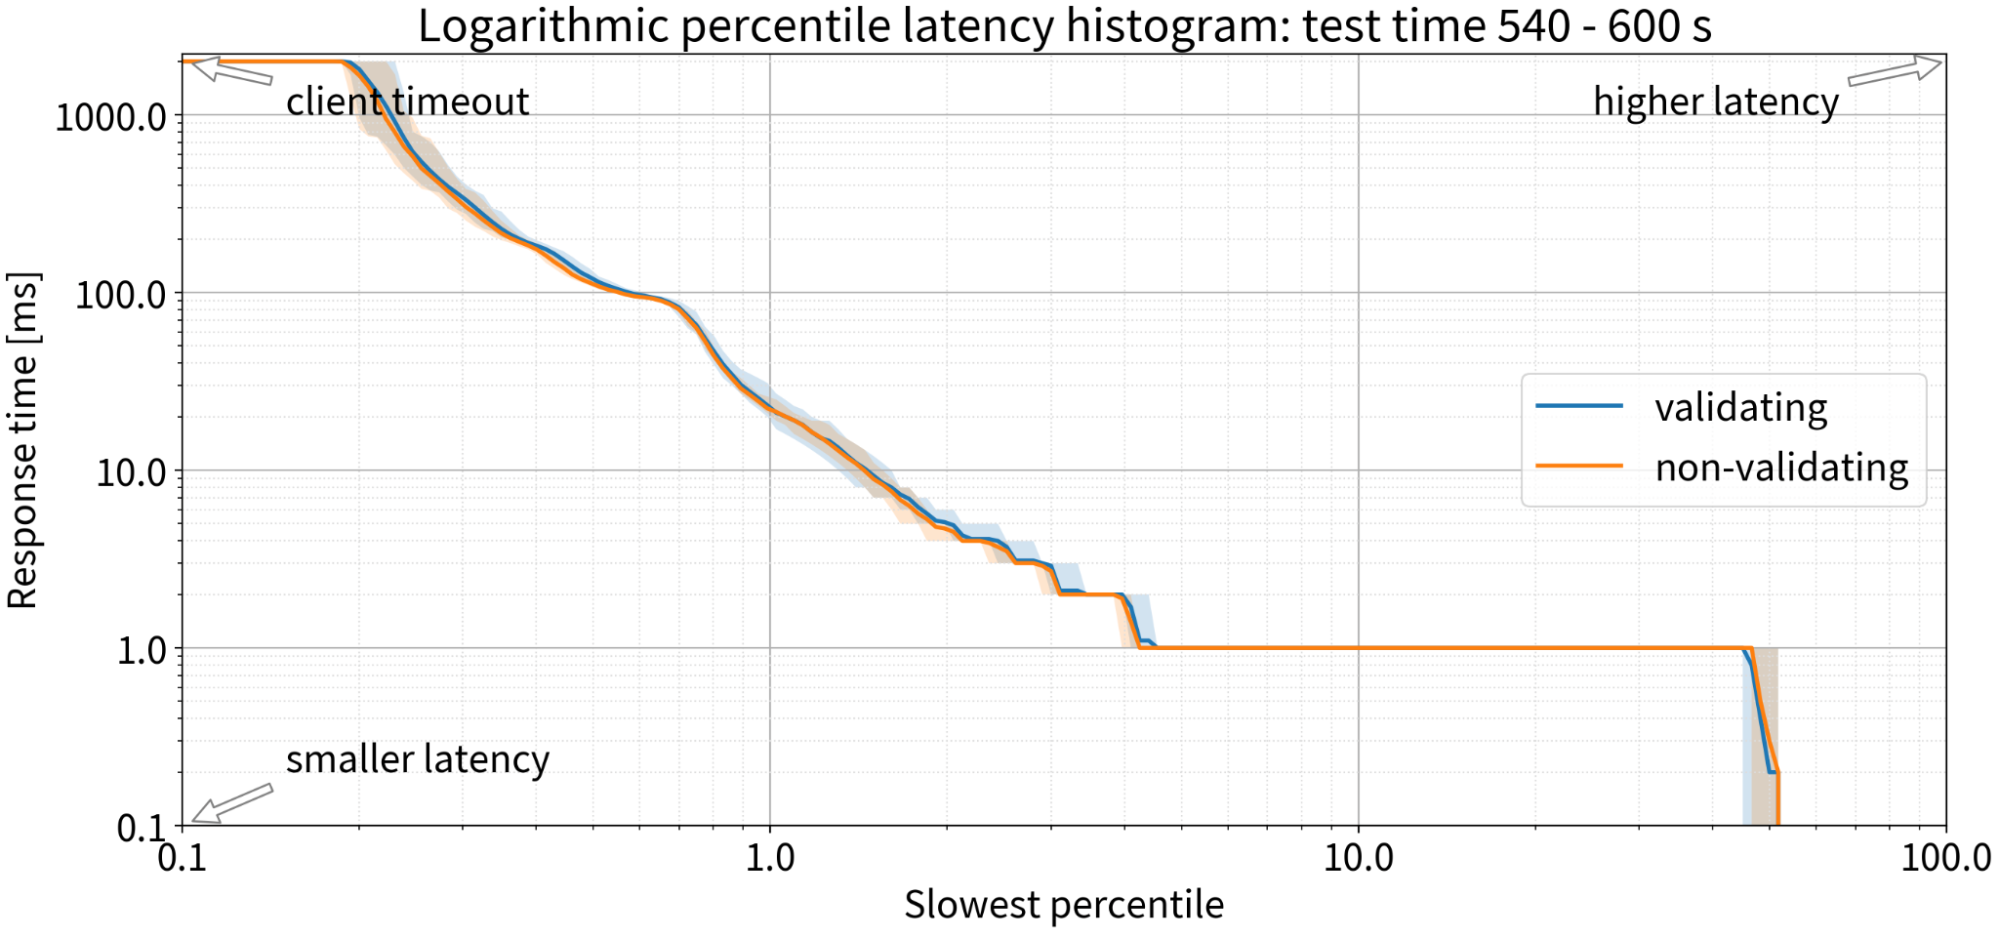
At the last minute of the ten-minute test, the chart lines were even closer – nothing to see. For 9,000 QPS, DNSSEC validation causes no difference in latency.
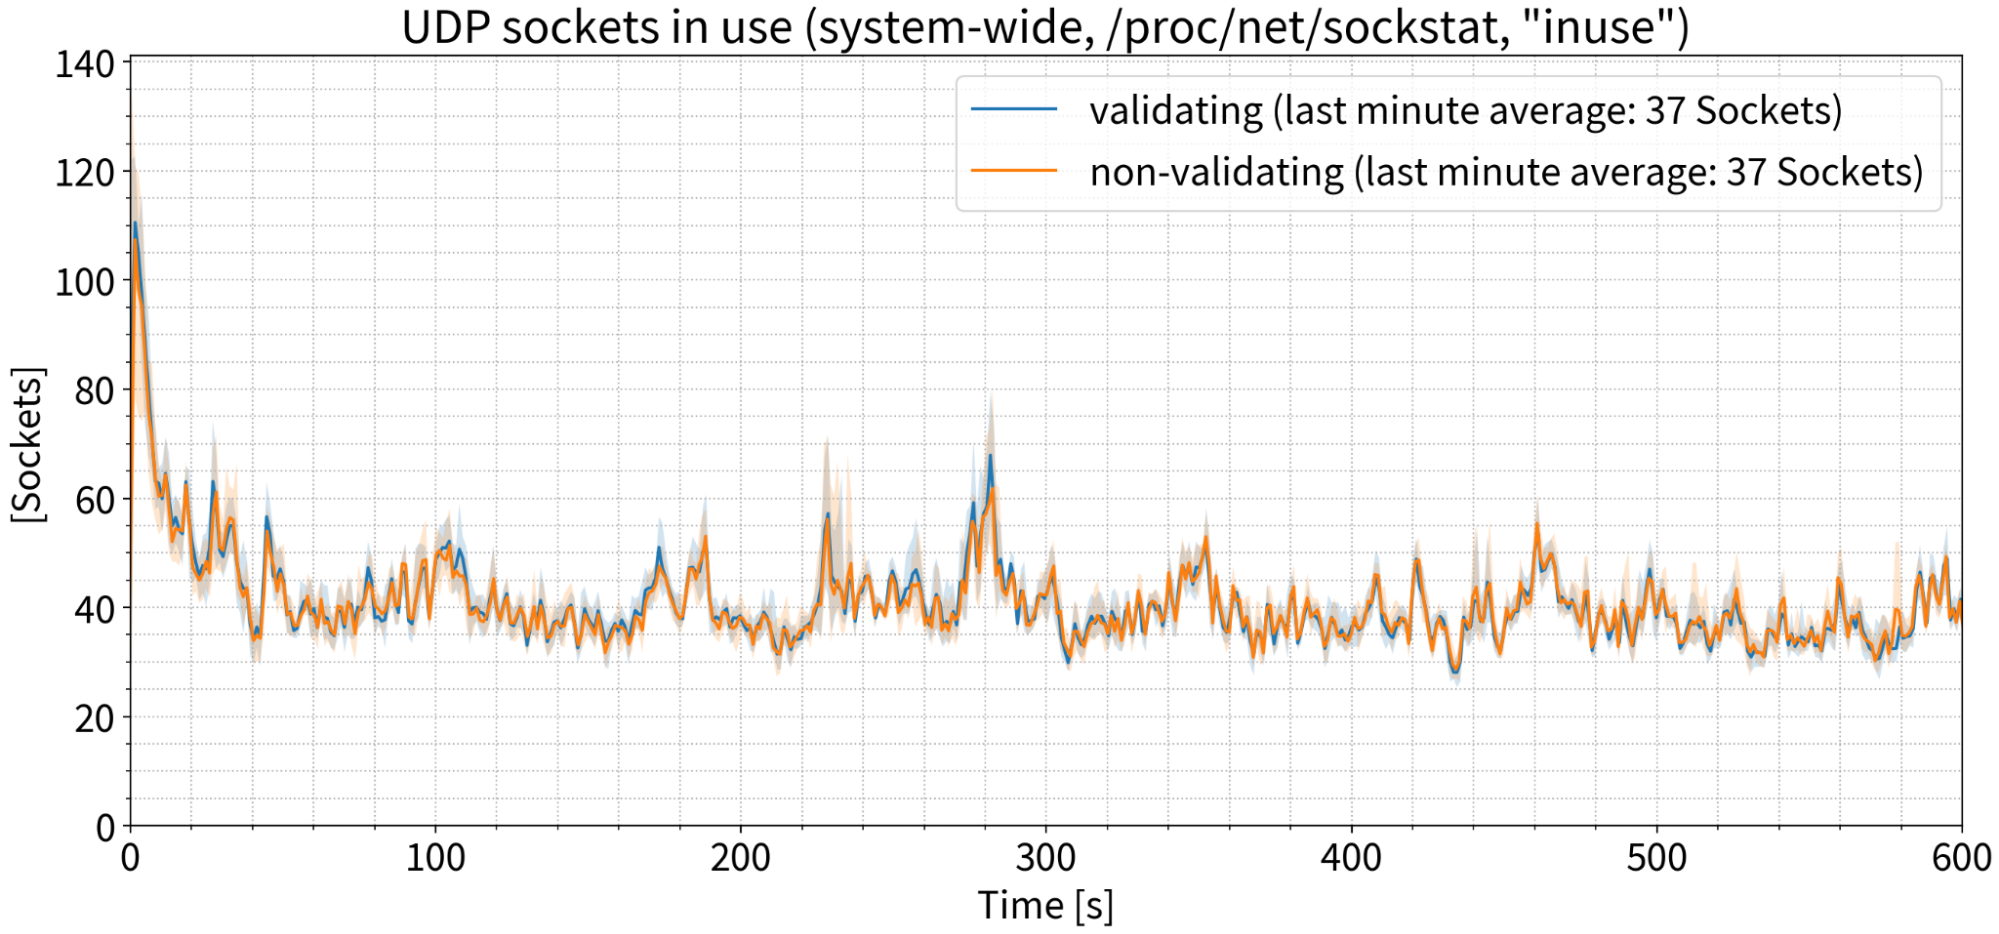
Number of OS sockets
Traditional wisdom says we’ll need more TCP sockets because DNSSEC packets are larger. To measure this, we focused on the number of TCP sockets in use, as reported by the operating system. But once again, we saw practically no difference between the validating and non-validating use cases. If we focus on just the last minute and average the number of sockets in use, the numbers for validating and non-validating are exactly the same.

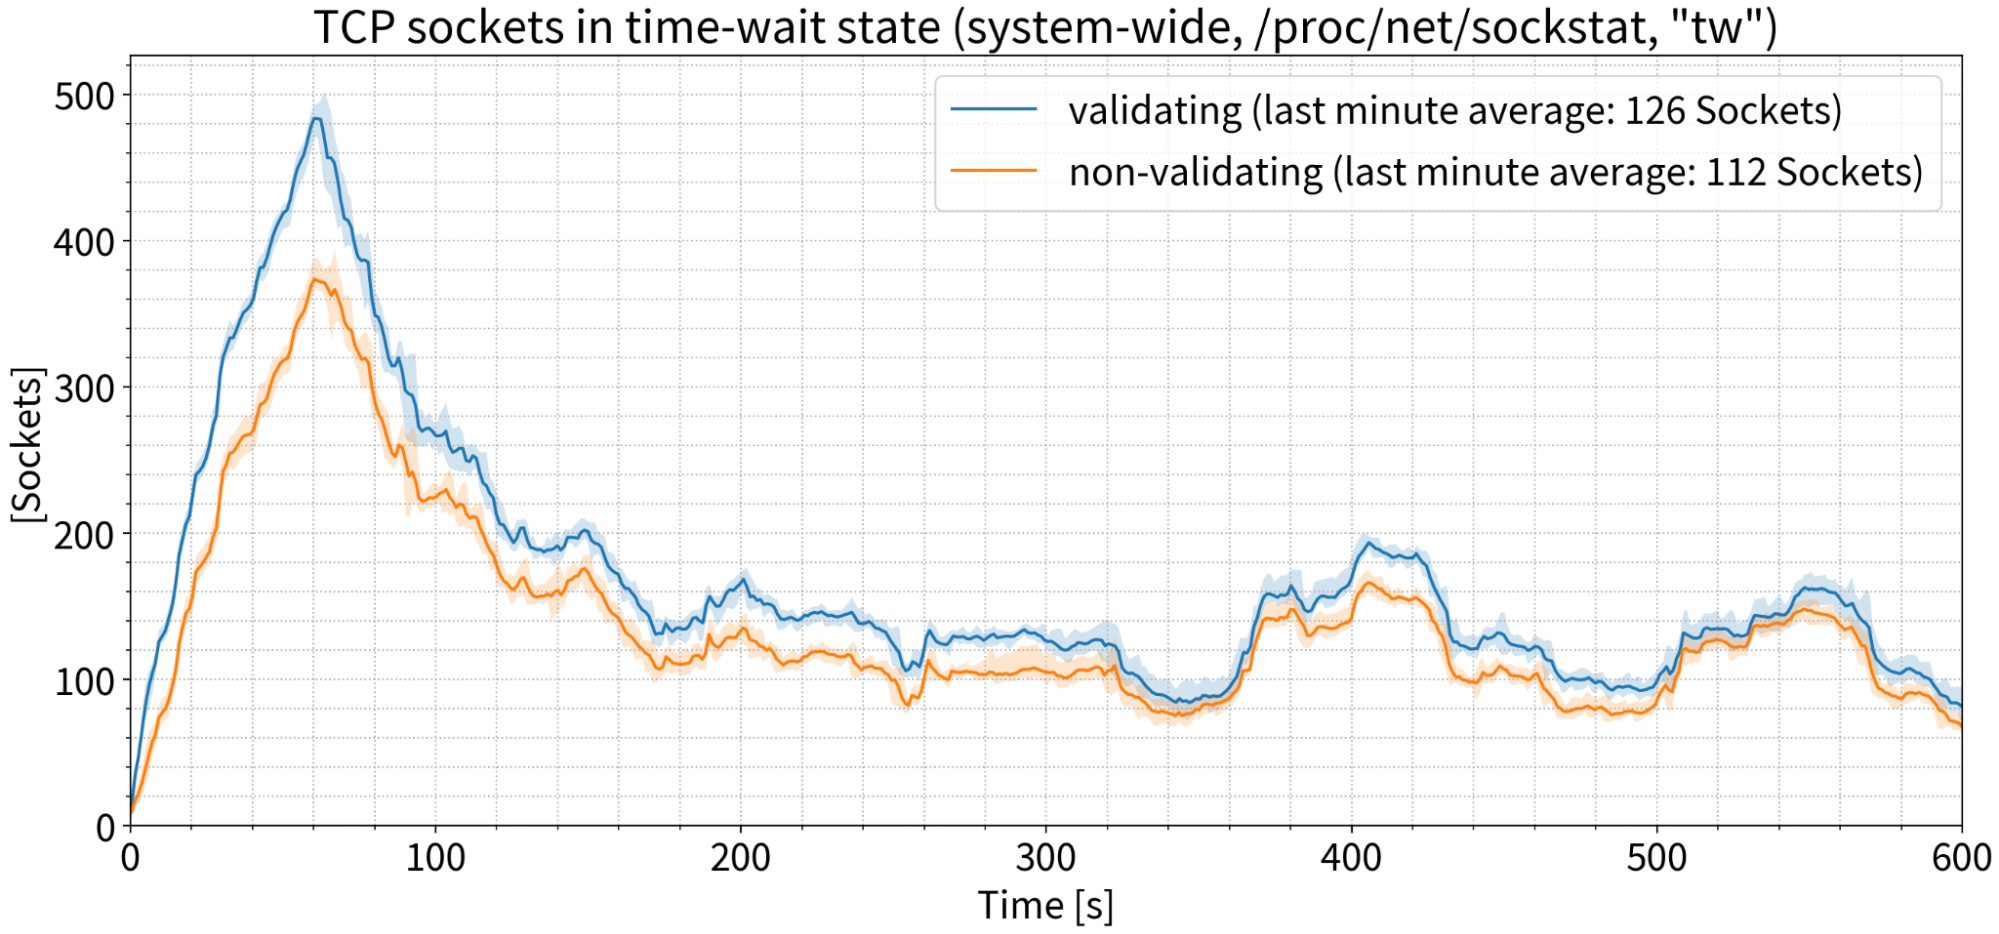
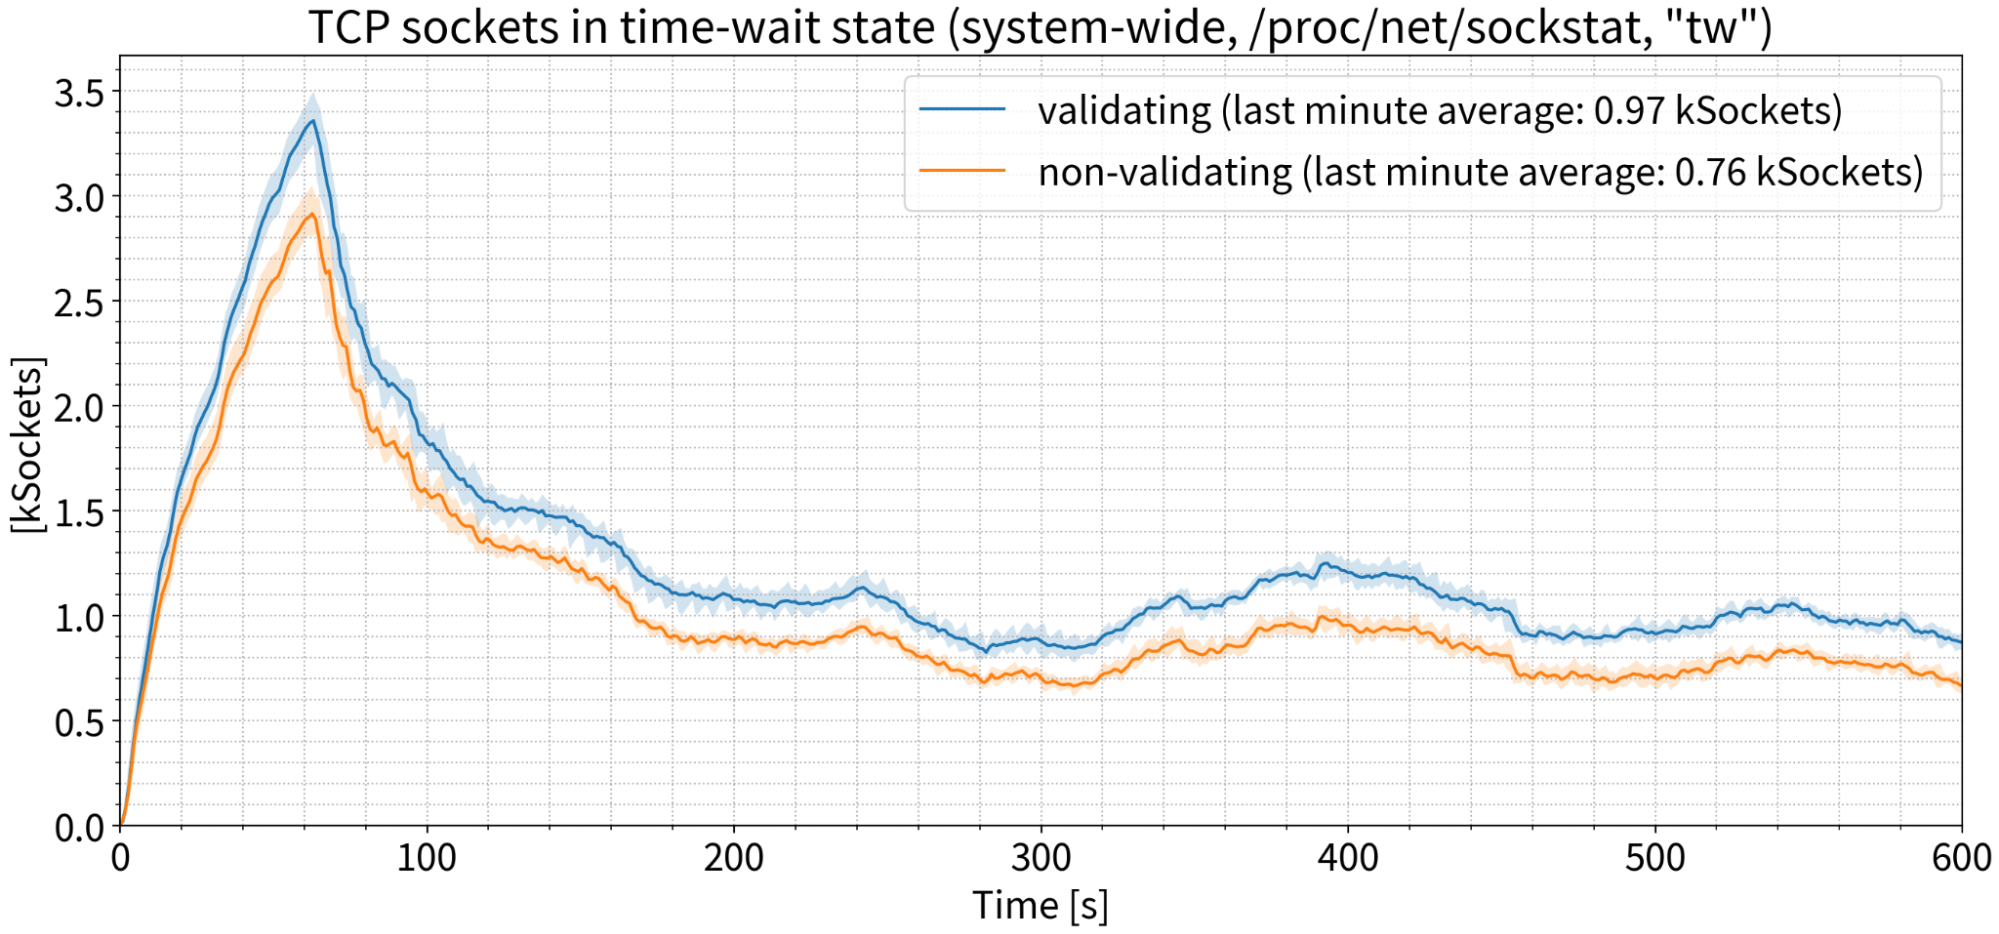
The number of sockets actually in use at any given moment might not reflect the number of sockets over the test period, since some sockets might be so short-lived that they wouldn’t be recorded by point-in-time statistical sampling. To account for this, we measured the number of TCP sockets in a ‘time-wait’ state; that is, sockets that were closed by the resolver once a DNS transaction was finished and remained in the ‘time-wait’ state for a short period of time after closing. We also measured this at the OS level where there were some differences — about 14 sockets on average on a resolver that’s handling 9,000 QPS, which is insignificant.
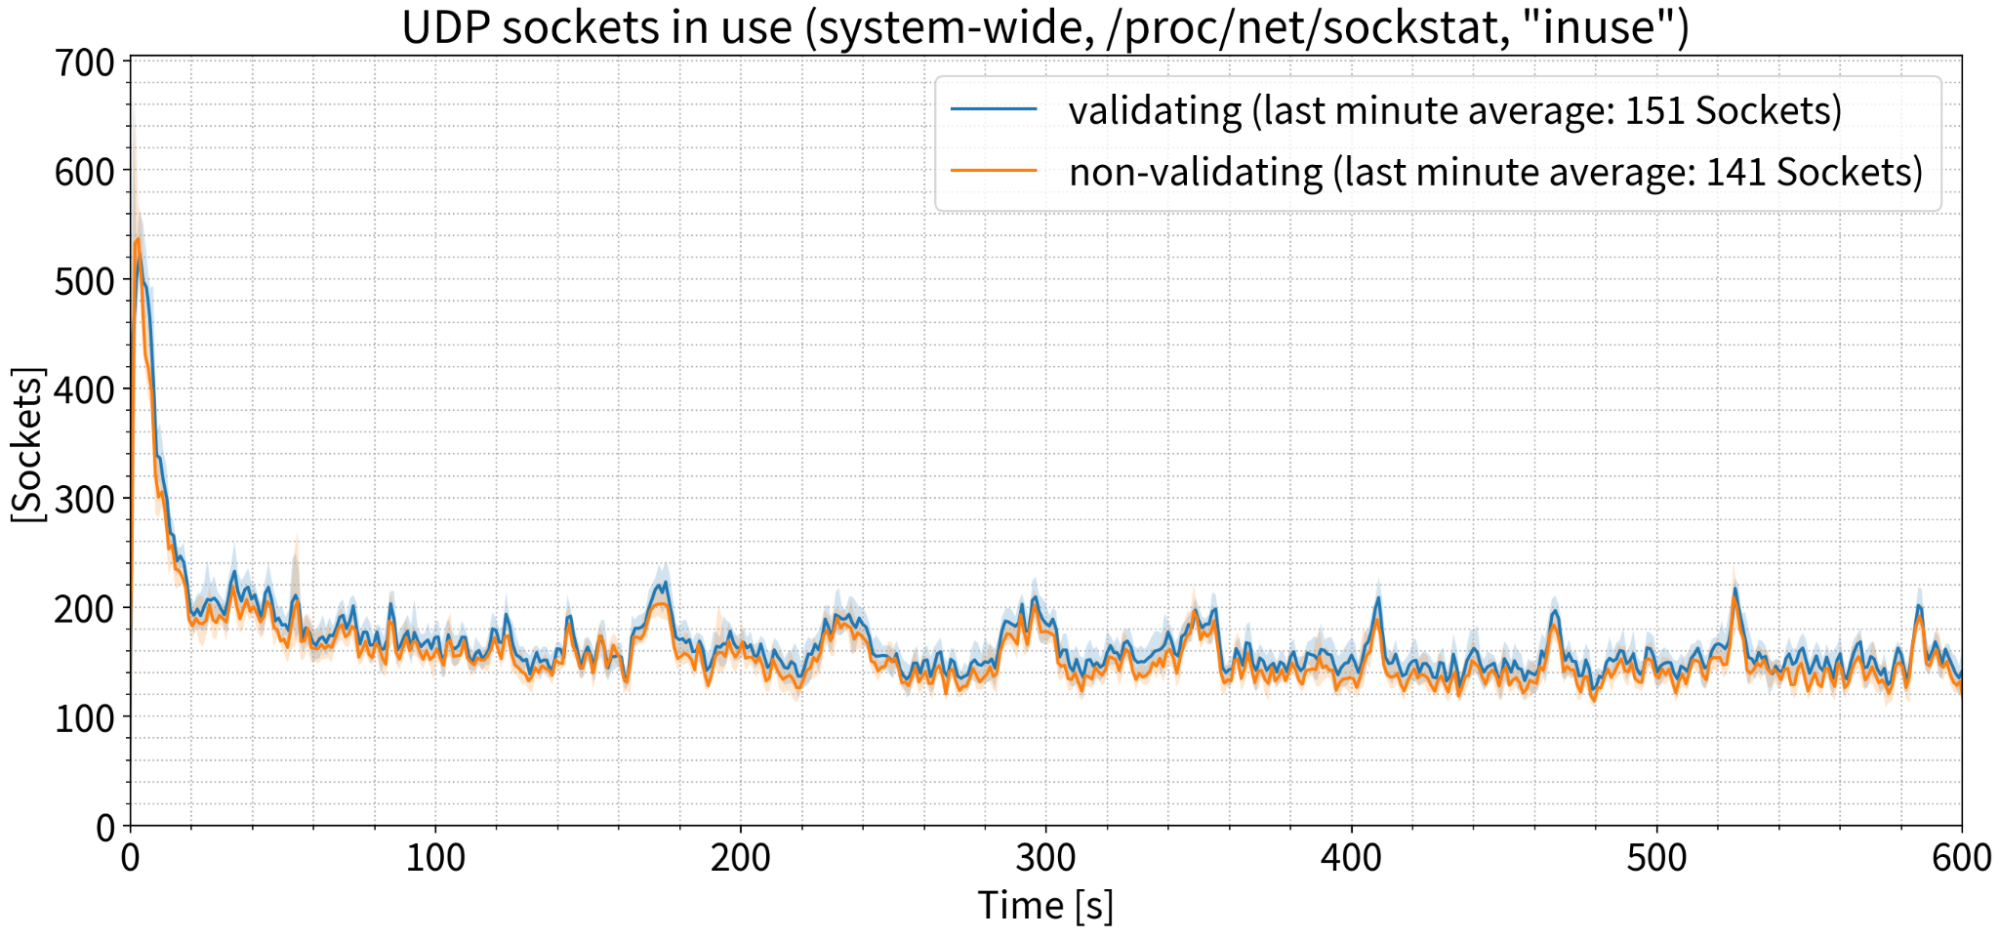
For UDP sockets, the story is the same: Exactly the same number of sockets in use during the last minute of the test, on average.
Bandwidth
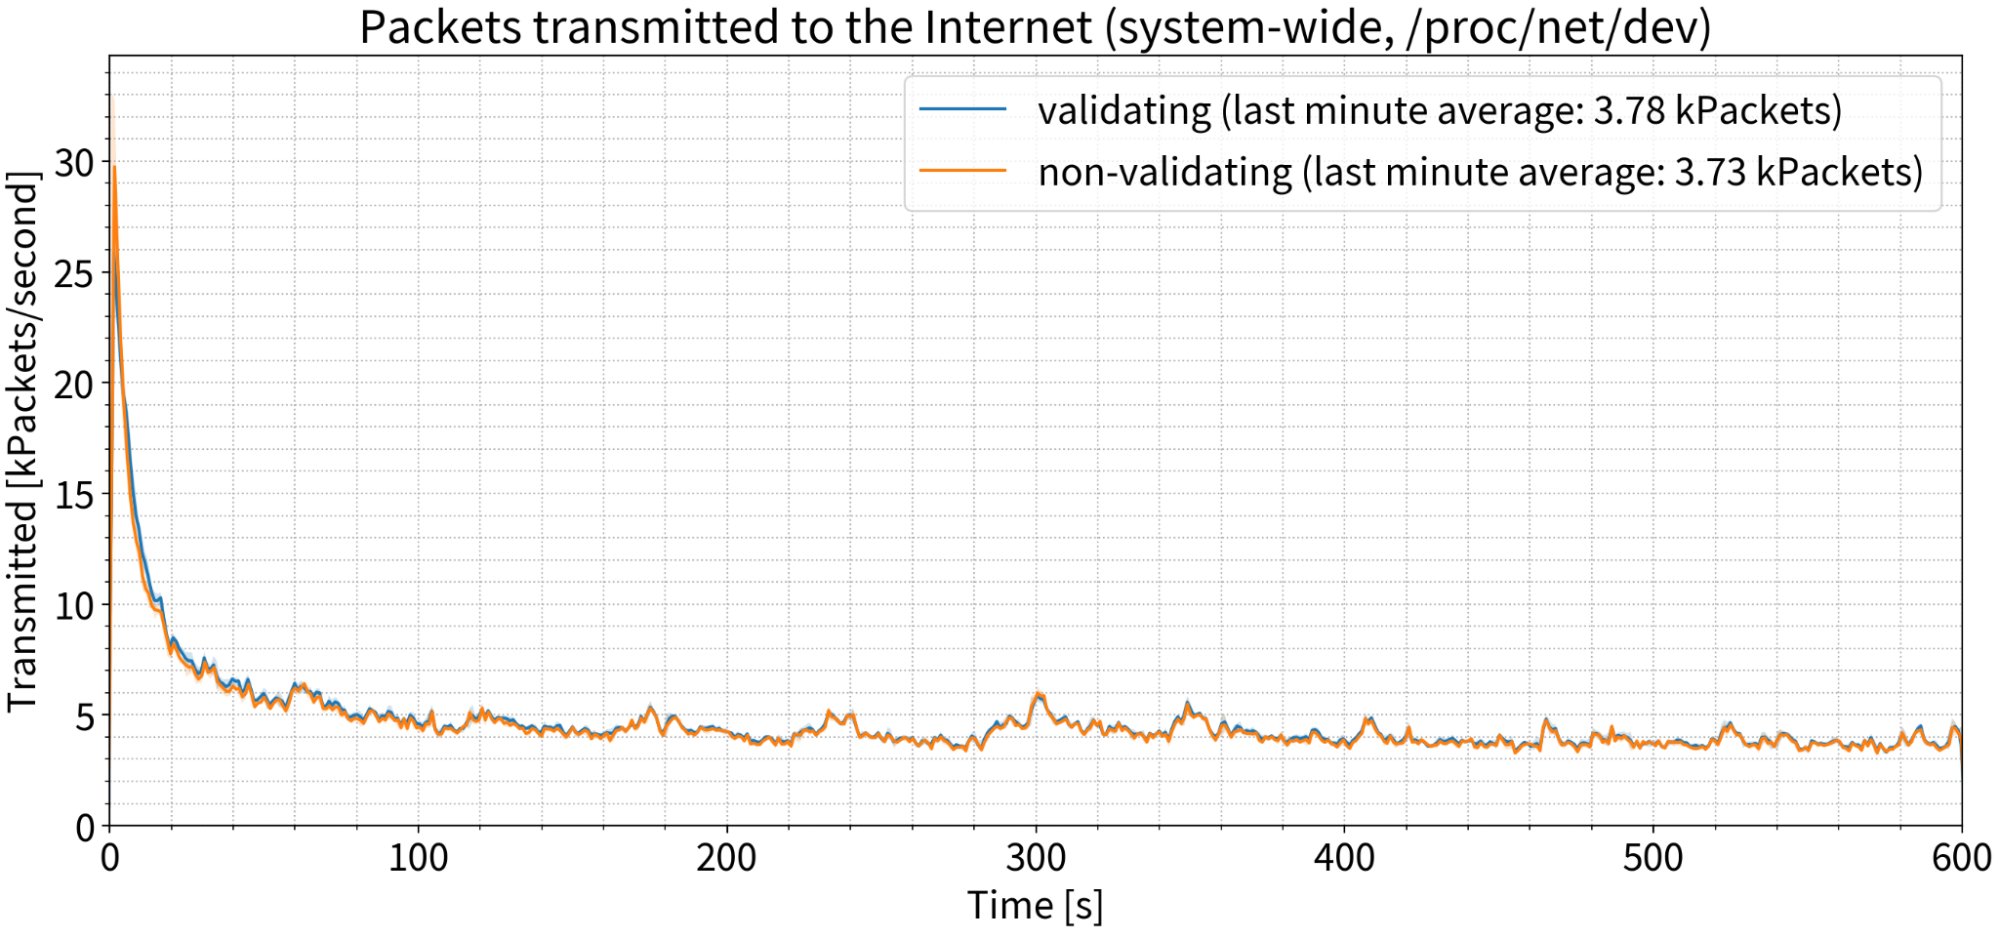
Traditional wisdom tells us that DNSSEC validation will cause more packets to be sent; but again, this was not the case in our experiment. There was an extremely small increase in the first couple of seconds of the test, but after that, we saw no difference.
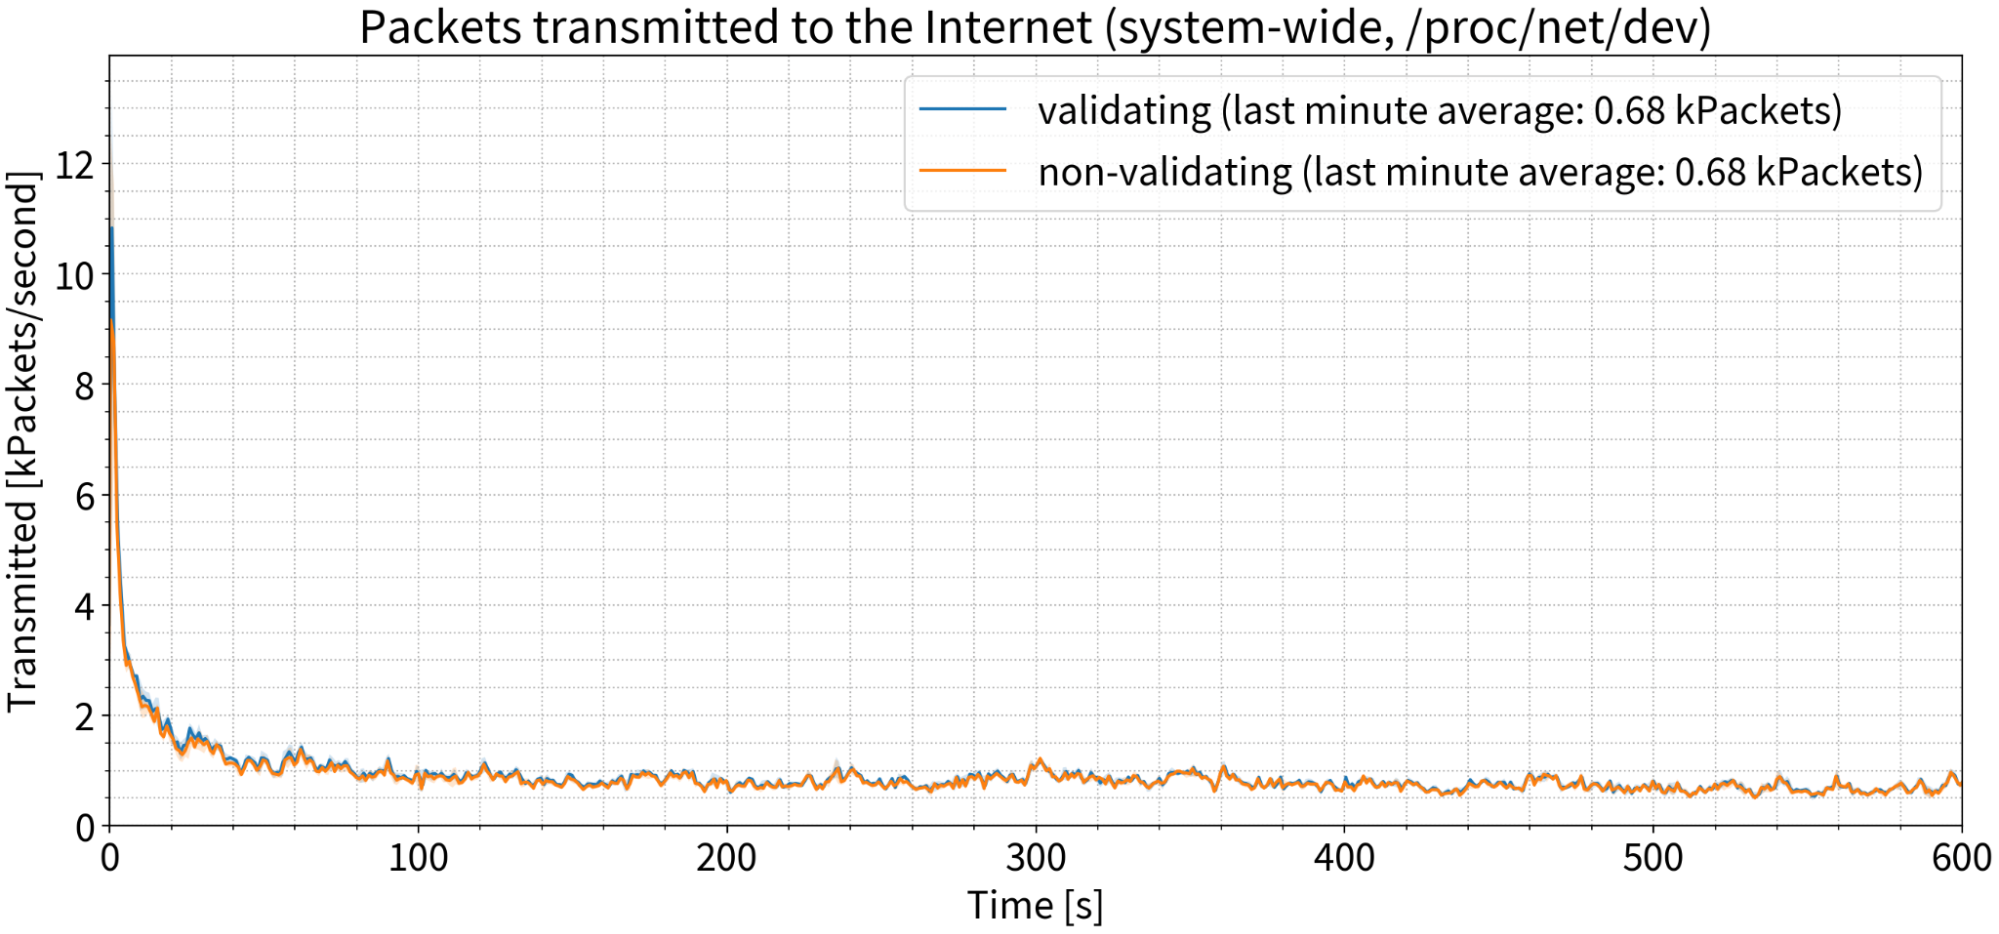
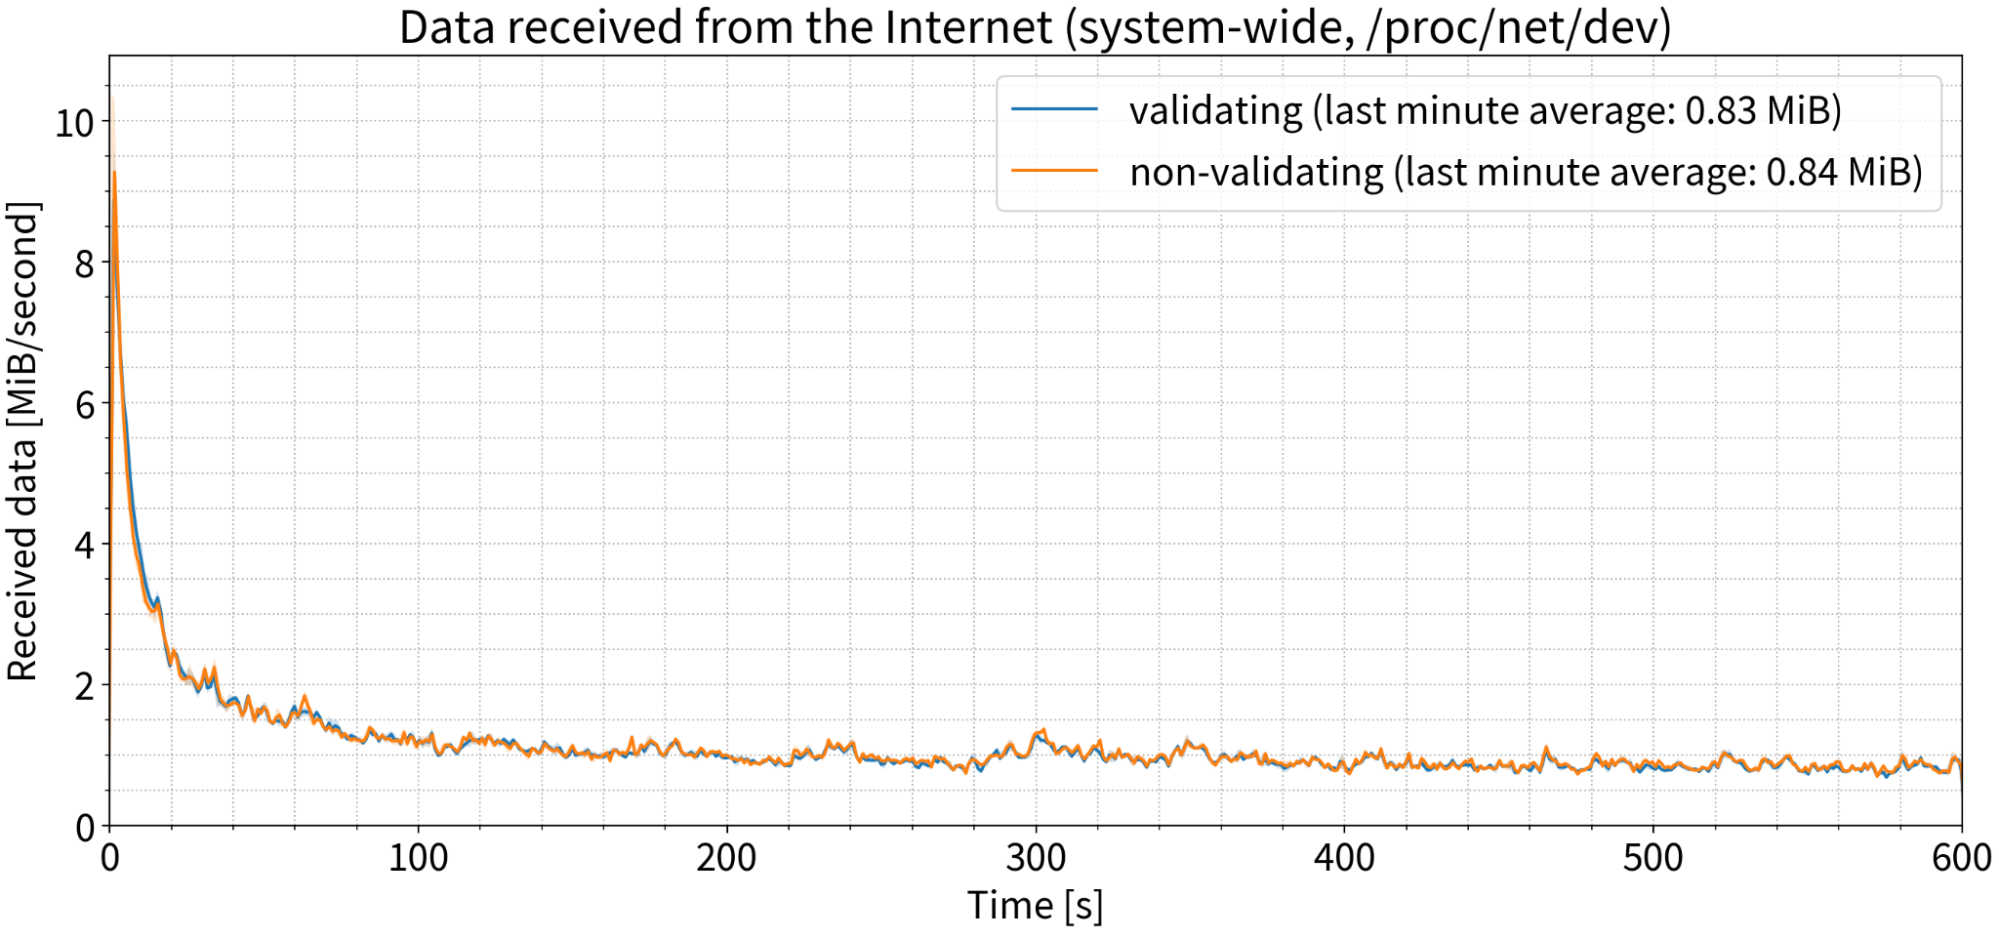
So bandwidth used must increase, right? Again, not really. We saw a tiny spike in the first second, but again, by the last minute, there is no practical difference between validating and non-validating configurations.

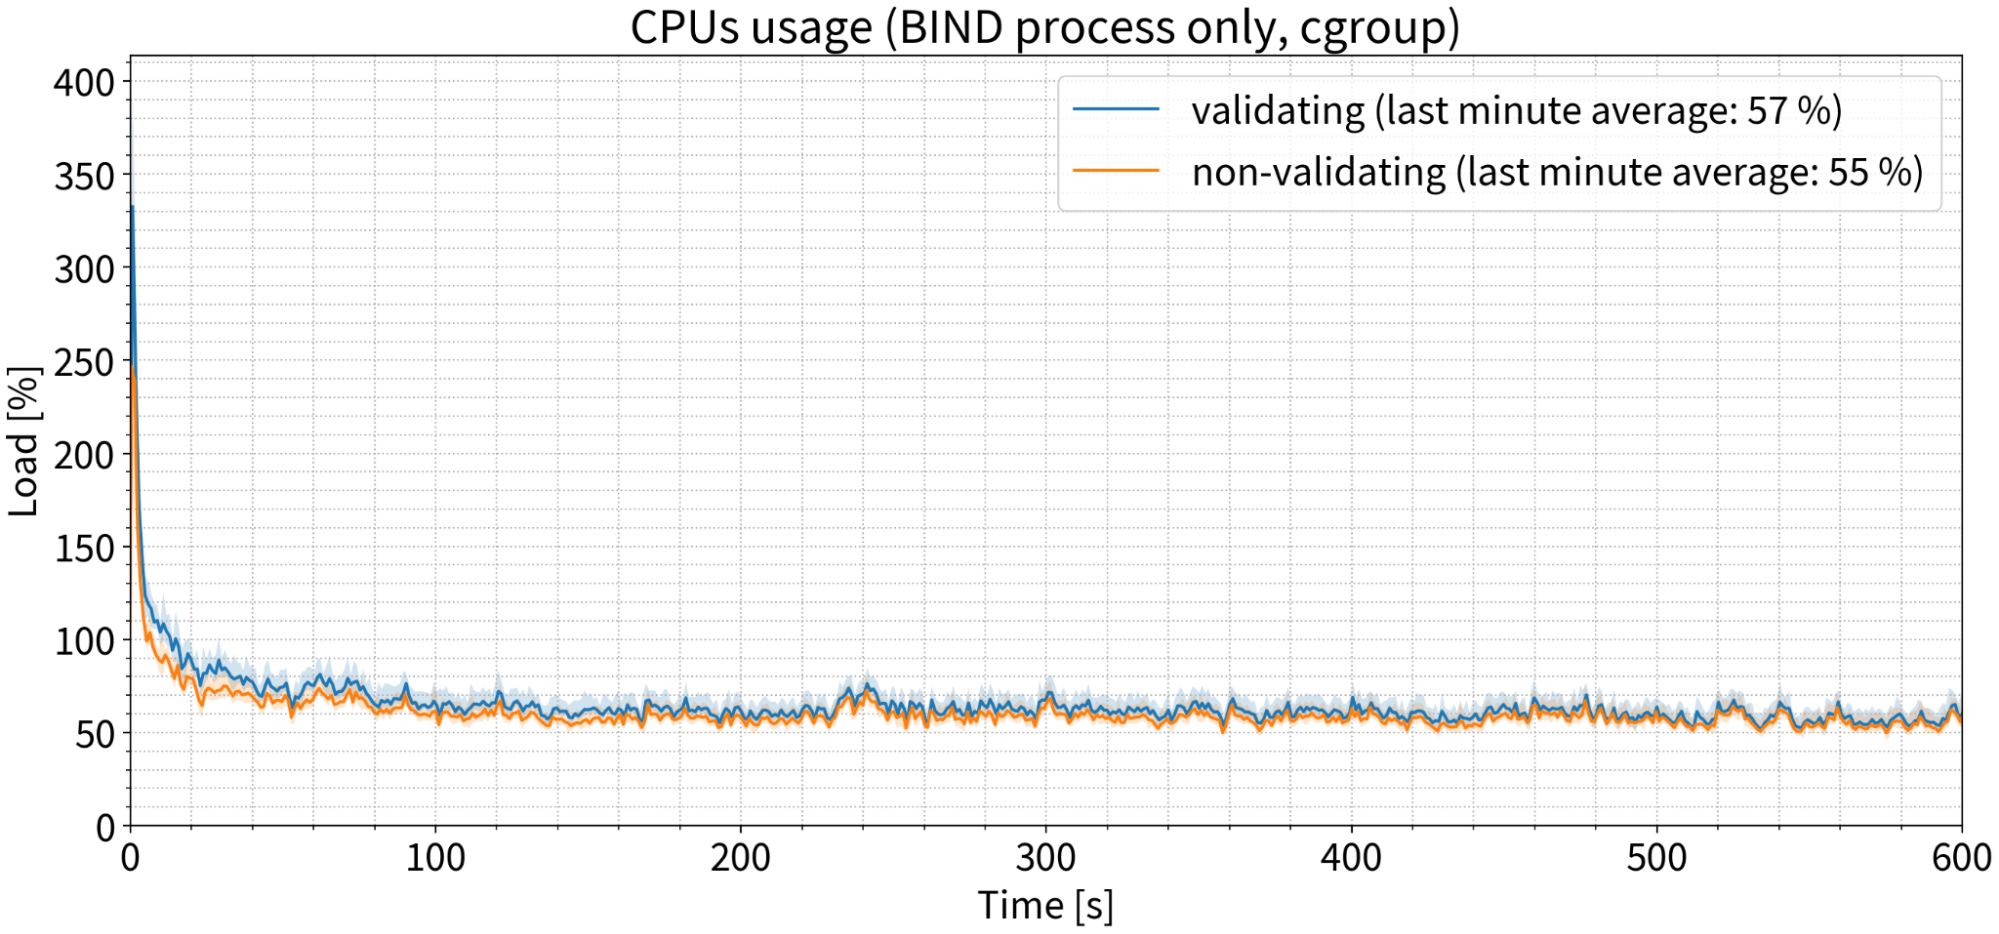
CPU consumption
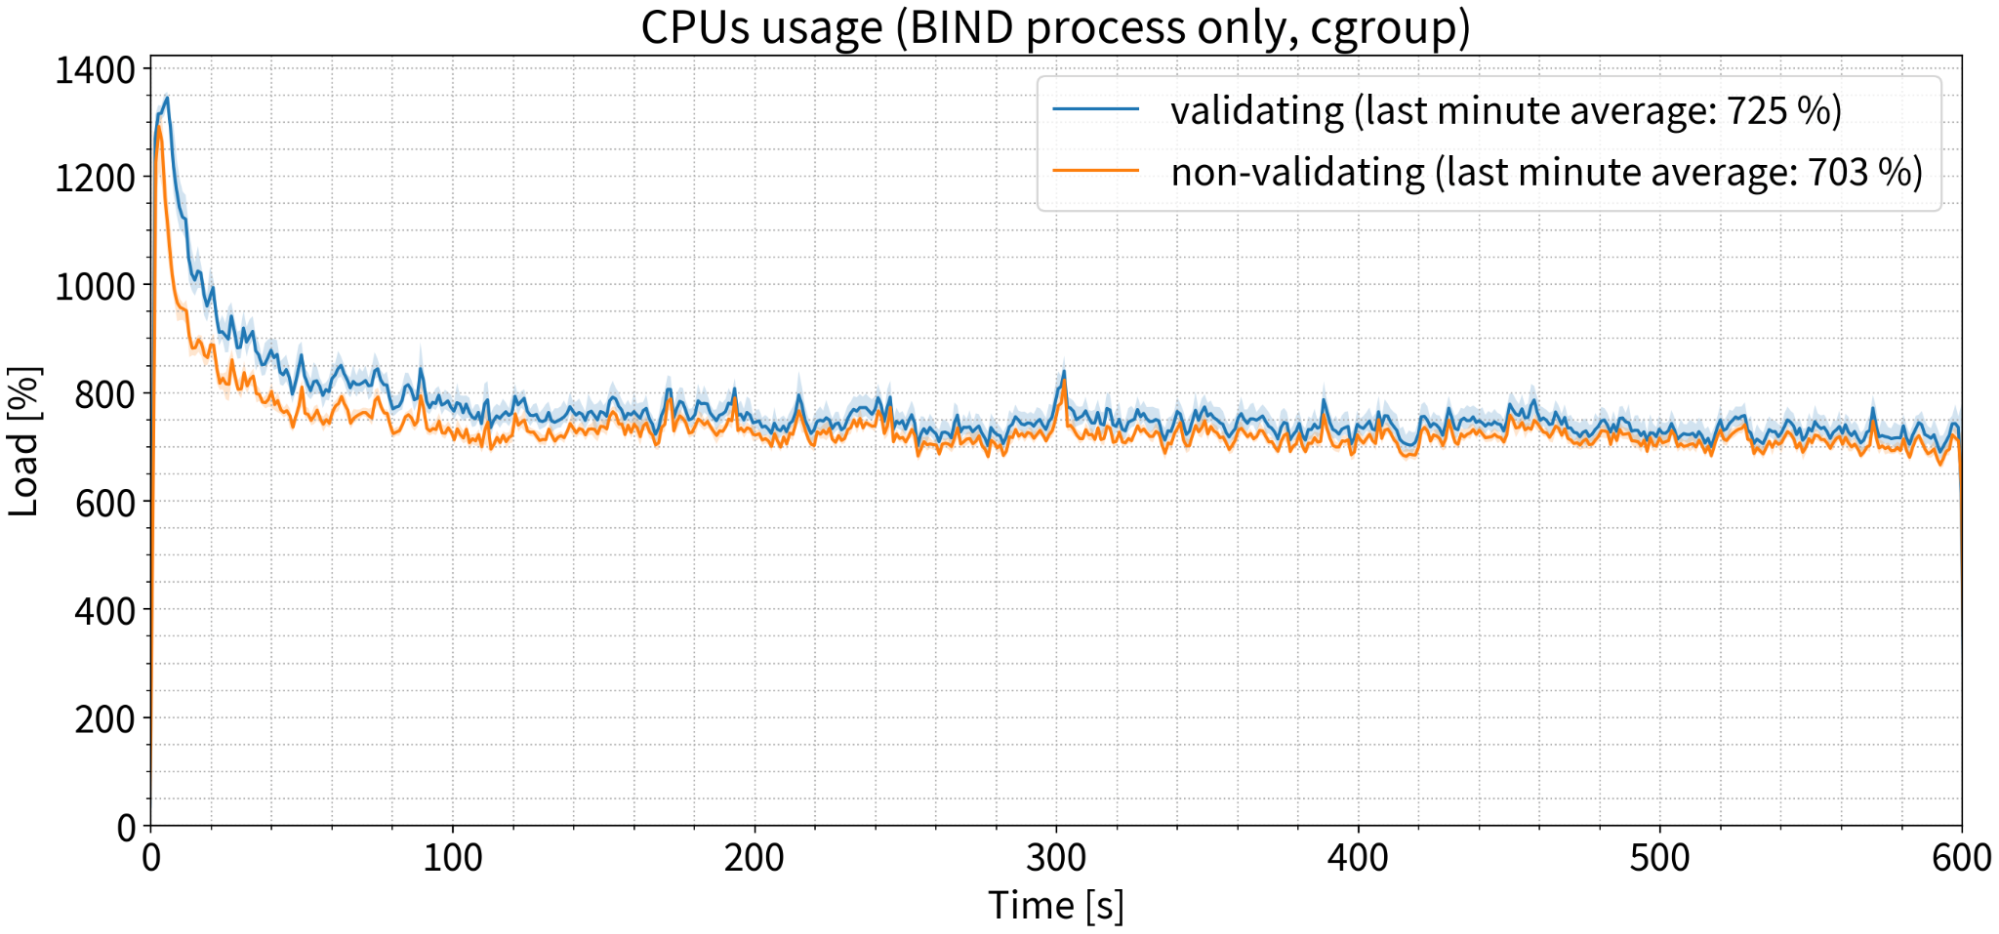
If we listen to conventional wisdom, then DNSSEC validation must be CPU-intensive. But, yet again, that is not the case. We saw a slight difference in the first minute or two, but the data quickly converged with the values for the non-validating configuration, and by the last minute there was a difference of only 2% on average. In this case, 100% means one CPU core, so 2% is practically nothing.
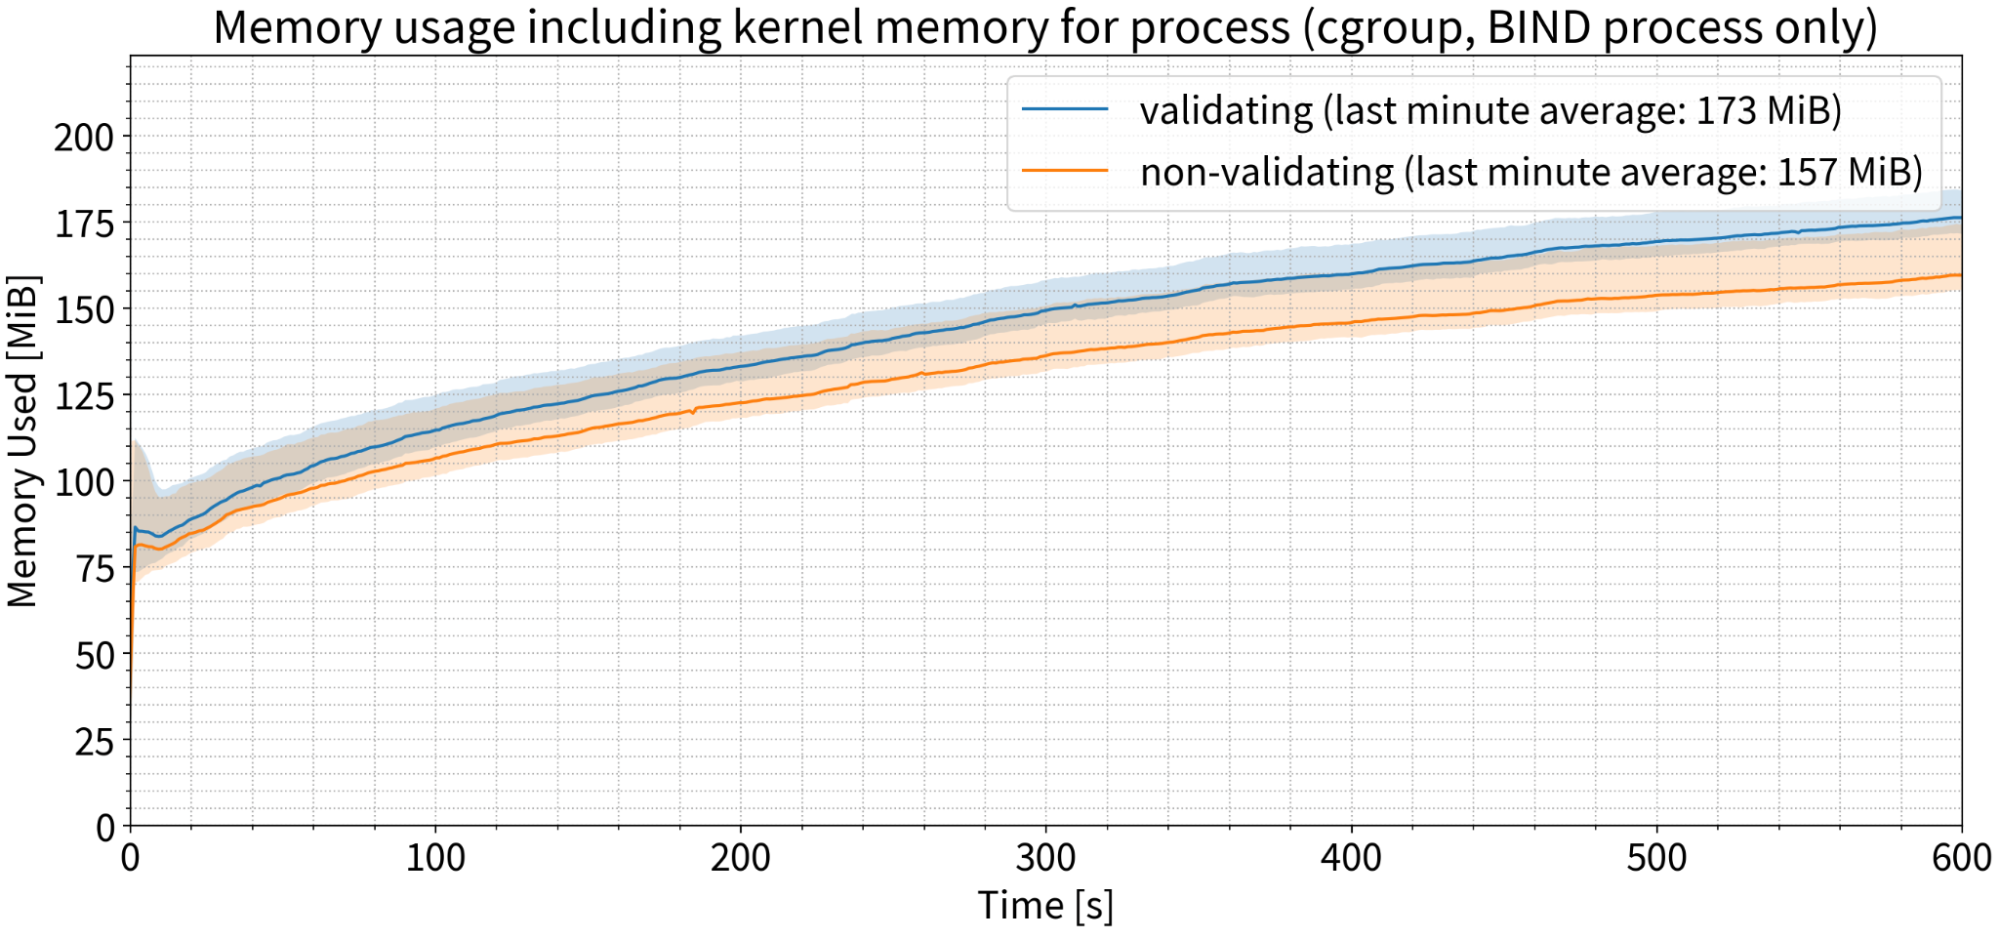
Memory use
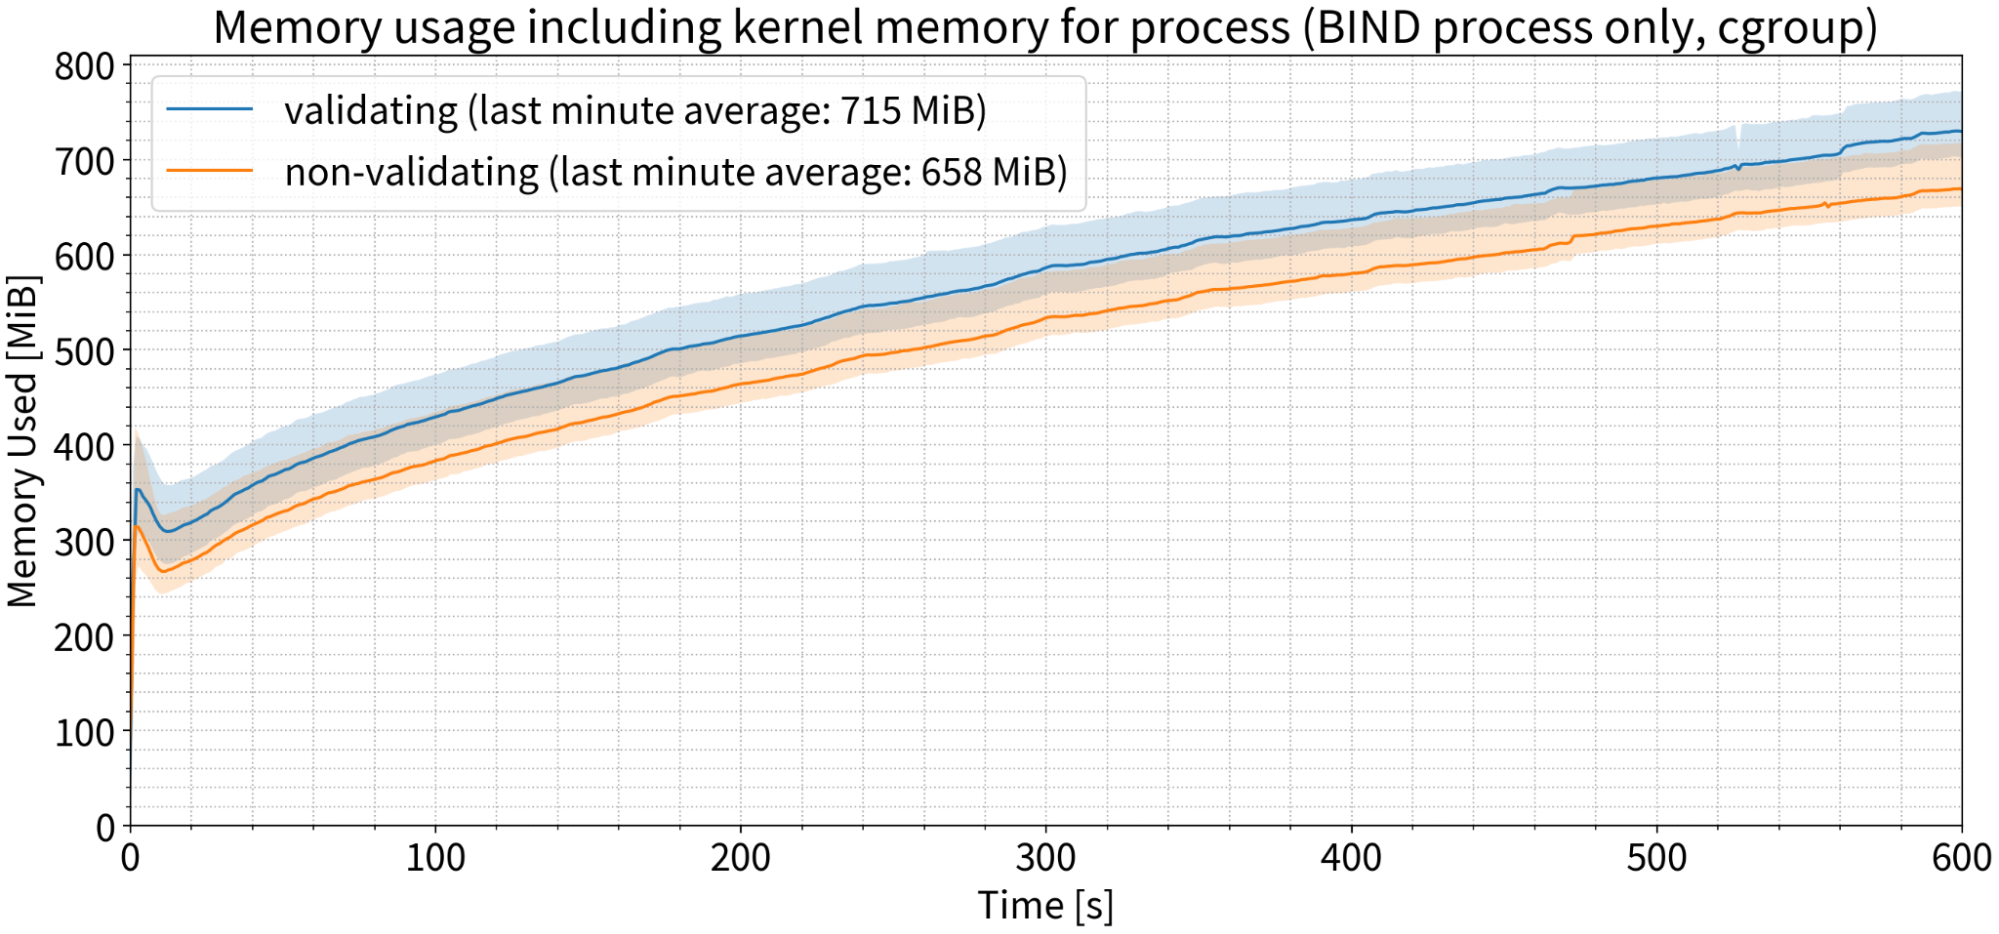
Last but not least: Memory use — finally, somewhere where validating makes a visible and reproducible difference, outside the margin of error! Validation used approximately 10% more memory on average than on a non-validating resolver during the last minute of our tests.
Scenario 2: 135,000 QPS
In this set of tests, we ran the exact same set of experiments as before, but this time the resolver was heavily loaded.
Latency
With a completely empty cache, validation did make a difference in the first minute; the percentage of responses that did not arrive within the client timeout (the typical Windows client timeout is two seconds) increased. But we noticed that in the very first minute, both validating and non-validating resolvers can’t keep up: They’re not warmed up and the cache is empty. More than 2% of queries were not answered in time for both validating and non-validating resolvers, so the issue was not with validation.
But in the second minute, it was slightly worse for validating, and as time went on their performance converged. By the tenth minute, it was hard to say if there was a meaningful difference or not.
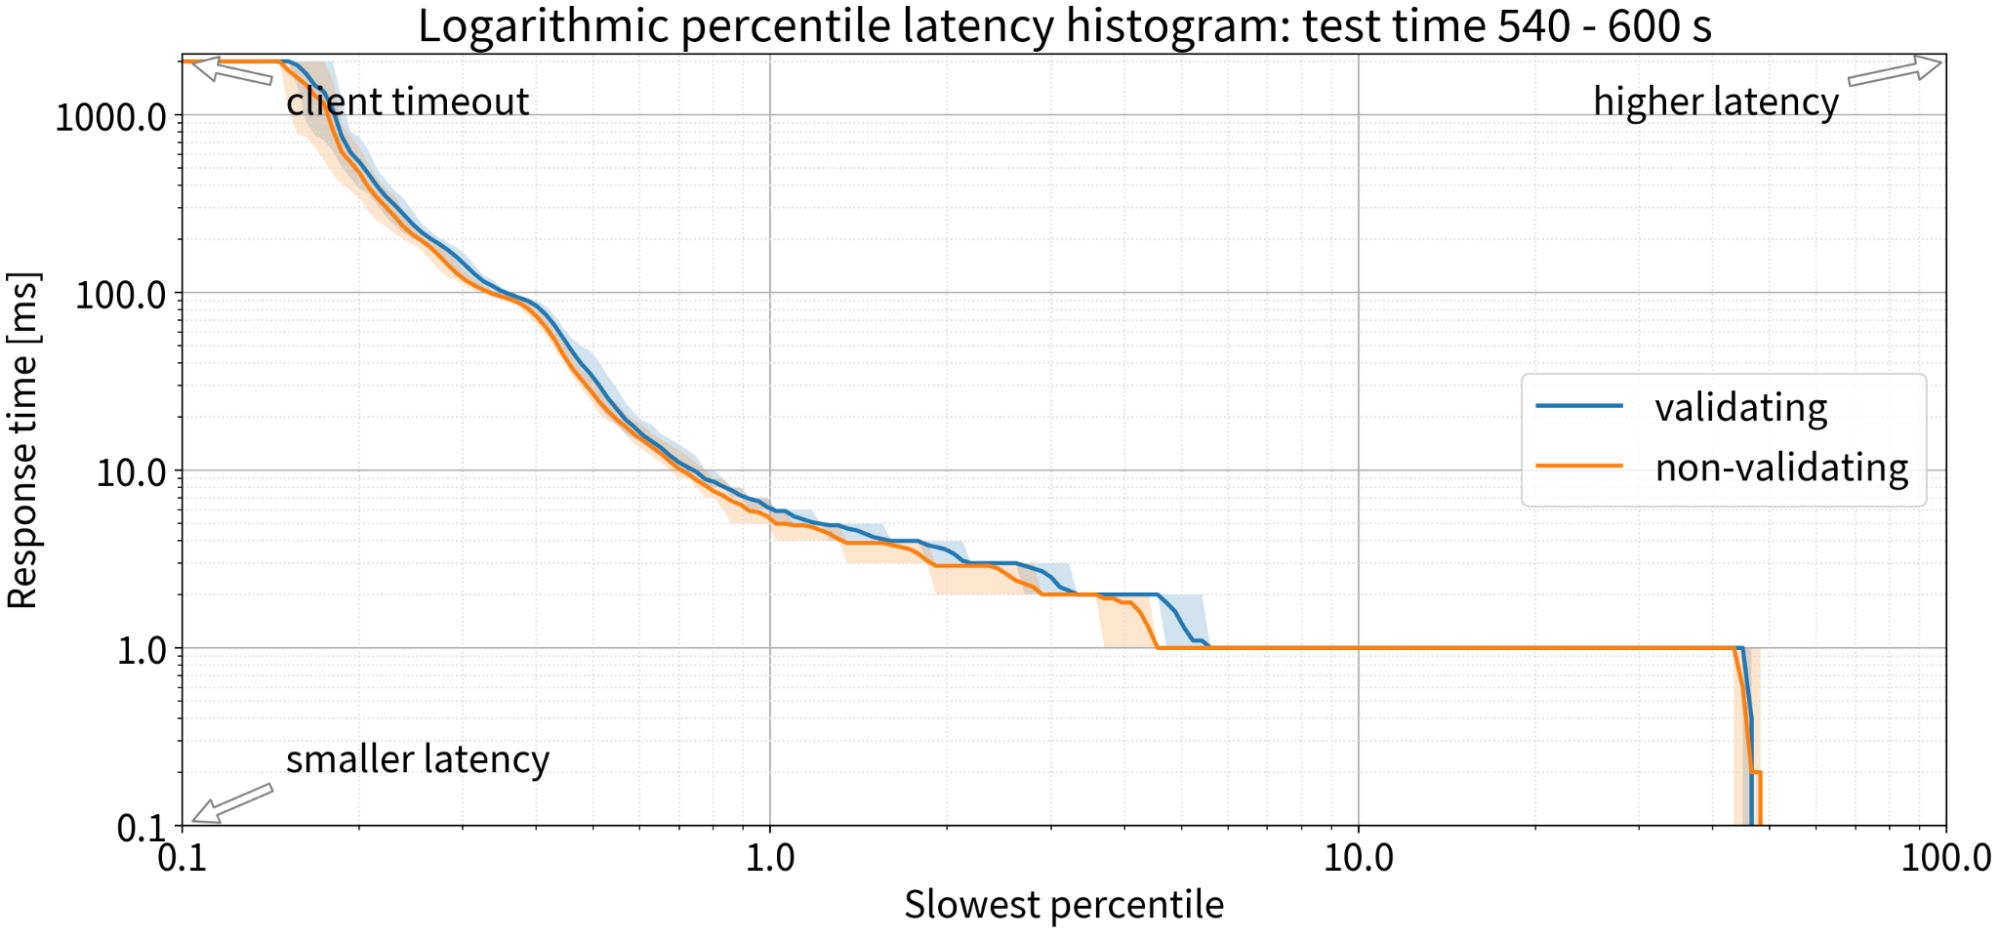
We can conclude that if there is any difference at all, it’s an approximate 1 ms penalty for 1-2% of queries. That’s the only impact of DNSSEC validation on latency for a busy resolver handling 135,000 QPS.
Number of OS sockets
Looking again at TCP sockets, is there any difference on the resolver with lots of queries and validation enabled? There is, but it’s very small: Only five more sockets in use, on average, on a resolver handling 135,000 QPS.

If we look at TCP sockets in the time-wait state, there were about 200 more TCP sockets in use on the validating resolver. Again, this is not a significant number and does not require any OS configuration changes to enable more open file descriptors at the same time.
As for UDP sockets, we again saw only a very small difference between the validating and non-validating resolvers.
Bandwidth
When we look at the number of packets being sent out with 135,000 QPS, we saw a small difference — approximately 50 packets per second more were being sent from the validating server than from the non-validating server, which is not even noticeable.
The difference in the number of bytes received by the server between the validating and non-validating scenarios was not measurable.
CPU consumption
Surely, the CPU must be burning now, right? Again, that was not the case. We saw a slight difference in CPU usage in the first couple of minutes of our tests, but after that, the two sets of data quickly converged. By the tenth minute, we saw only a 22% increase in CPU time consumption by the validating resolver, which is one-quarter of one CPU core — nothing you would notice in practice.
Memory use
Once again, this is the only chart where we saw any significant difference between validating and non-validating. With 135,000 QPS, memory use increased by approximately 9% for validating servers, averaged over the last minute of the test. Of course, it requires more memory to store the larger amount of data, but not a very significant amount.
So, is DNSSEC validation a performance killer? No
DNSSEC validation has a negligible impact on server latency, bandwidth usage, CPU time consumption, and the number of OS sockets. The only area of our tests in which we saw a significant impact from DNSSEC validation was memory consumption, which increased by about 10% with validation.
For those who still think this too hard to believe, it’s worth considering that:
- DNSSEC validation costs are paid only on cache misses — and DNS cache is incredibly efficient! Even in the first minute of the test, more than 90% of queries are answered from cache and the ratio increases as time progresses.
- DNSSEC metadata, which requires a separate round-trip to obtain (DNSKEY records), is very rare and shared on the DNS zone level, which makes the DNS cache even more efficient.
If you are after truth and not speculations you can also measure the impact yourself, using your own traffic capture. The measurement tools are open source! See this video and an earlier blog on how to do such measurements.
This article recaps the highlights of a presentation given at DNS OARC 38. The slides and a recording of the full presentation are available on the ISC presentations page. For more background on resolver performance testing and this test bed, see this earlier blog.
Adapted from the original post which appeared on the ISC Blog.
Petr Špaček devotes his professional life to DNS and is a Software Engineer at Internet Systems Consortium.
The views expressed by the authors of this blog are their own and do not necessarily reflect the views of APNIC. Please note a Code of Conduct applies to this blog.
Thank you for this nice study!
Arguably, these results are at least in part due to the fact that BIND 9 sets the DO bit in queries independently of whether responses are validated or not — in other words, bandwidth and memory usage are largely the same.
That’s not to say that the outcomes don’t apply: they do, for resolver operator using BIND 9. Operators using resolver software that doesn’t set the DO bit may see different results.