

The Dashboard for Autonomous System Health (DASH) is APNIC’s latest security product. It allows users to monitor malicious traffic going out of their network, and compare the daily hits on their network with those of their broader region or economy.
United we stand, divided we fall
The idea behind DASH is that by making one network healthier, networks across the broader region and world will all become healthier. By protecting one network, other networks are protected as well.
Take Distributed Denial of Service (DDoS) attacks, for example. A DDoS attack is where malware can take over thousands of devices on a network and use them to launch attacks on other networks. The network with the infected devices is not necessarily the focus of the attack, but by remediating the compromised devices on that network, you can help secure your customers and infrastructure as well as prevent attacks on other networks. In addition, you are helping to disrupt the activities of cyber criminals.
Read: The DDoS threat landscape in 2017
Improving the health of networks across the Asia Pacific requires multiple networks to actively try to limit malicious traffic. DASH aims to make this easier.
What does DASH do?
DASH draws upon an existing network of honeypots around the Asia Pacific to gather data on malicious traffic. Included in this network is APNIC’s Honeynet project, as well as other participating honeypots.
Read: The APNIC Community Honeynet Project
By analysing the level of malicious activity in their own network, network operators can determine how serious a problem it is for their network and start doing something about it. DASH also has functions to help network operators receive assistance directly from APNIC. This means DASH is not only a tool that can be used for diagnosis but also provides avenues for following up on problems if needed.
What can DASH tell network operators?
DASH helps give the operator an idea of how their Autonomous System (AS) looks, relative to other networks. Consider the following questions, which are some of the first questions a network operator might ask themselves:
- How does my AS look compared to the broader economy it is in?
- What about the broader region?
- Does my network have a history of malicious activity?
- Are things getting better or worse?
Let’s look at a fictional example case to see if we can answer these questions.
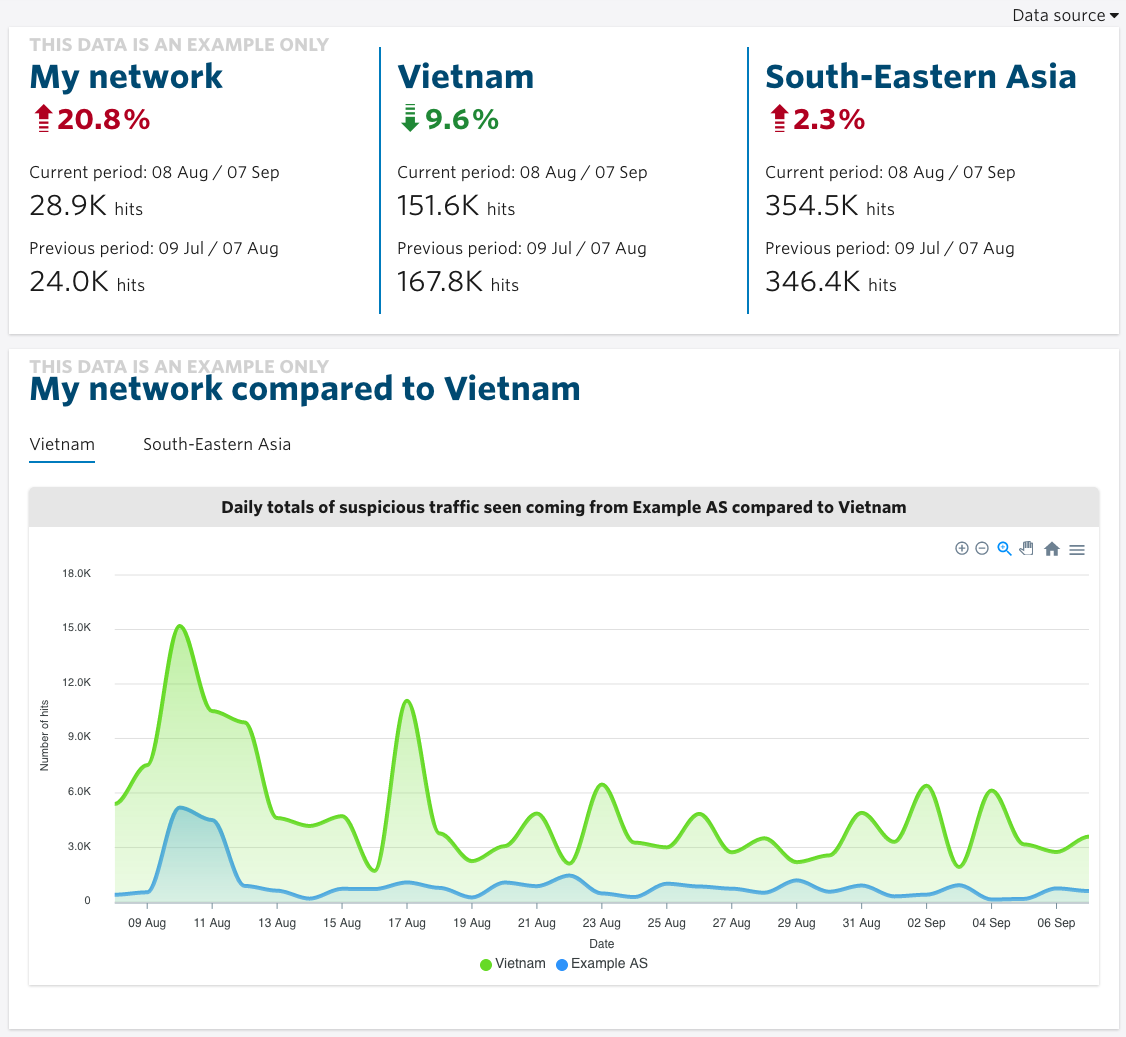
Right away, we can clearly see that, unfortunately, malicious activity has increased since the previous recorded period. Much of that seems to be due to a spike in activity around 10 August, which also occurred in Vietnam more broadly. This AS was a contributor.
But around 17 August, we can see that while malicious activity in Vietnam spiked, for this AS it was relatively contained. That’s much more encouraging.
For this fictional AS, it looks like the period started out on a bad note, but improved. We can also see the situation in Vietnam improved over the previous measurement period, but it did not in the broader South East Asian subregion.
By keeping an eye on these figures over more measurement periods, operators could get a better idea of the longer-term trends in their region and economy.
What can be done when malicious activity is getting out of hand?
If the AS experiences malicious activity that looks far out of proportion to its economy, there are various steps the operator can take. Firstly, DASH has the ability to generate a PDF report of the malicious activity, so the operator has data it can take to discuss the issue with colleagues. There may be other things going on in the network that the team is already aware of, but now they have more hard data that can provide additional insights or facilitate development of policies for improving the security of the network.
If they’re not sure what else they can do, the next step would be the “request additional insights” function. This sends a request for further assistance to APNIC. The response will depend on the nature of the problem.
If you have an APNIC login, you can access DASH via this link, or you can register for a login here. The service is for APNIC Members that hold at least one Autonomous System Number.
APNIC would love to hear any feedback you might have about DASH, which can be provided via the feedback function directly in the app itself.
The views expressed by the authors of this blog are their own and do not necessarily reflect the views of APNIC. Please note a Code of Conduct applies to this blog.
Can you make it support out of region ASNs?
Thanks Yang for your comment and interest in DASH!
It is great to know the interest in this kind of service exists outside the AP region.
APNIC only offers DASH to Members (and therefore it is Asia Pacific region only) because we know whether a user manages an ASN or not. It would be difficult to implement a mechanism to confidently know if a user is responsible for an ASN that is not managed by APNIC.
Great Feature provided by APNIC much Appreciated
I need to discuss more about DASH and understand with APNIC Team, is there any contact details
Hello Vishal! Thanks a lot for your comment! I’m glad you like DASH!
I have sent you an email. Talk to you soon!
I’m interested to try DASH. Is it free? We have librenms only and I know we need more than this to monitor our big network. Keen to hear from you guys.
Hi Lemafoa, yes it’s free and valuable for APNIC Members that hold at least one ASN or IP address range. Log in with your APNIC account at https://dash.apnic.net/ or register for a login at https://www.apnic.net/manage-ip/myapnic/