

On the third week of May 2020, APNIC welcomed its 8,000th direct Member.
It’s a significant milestone given it’s been more than nine years since APNIC began handing out IPv4 addresses from its last /8 block. This has had no impact on membership growth. The last one thousand Members joined over the past 20 months.
In this post, I want to shed some light on the difference, if any, between the new Members from the current growth period (from 7,000 to 8,000 Members) and the previous period (from 6,000 to 7,000 Members).
Industries and economies
In the current period, we have seen a rebound in Internet Service Provider (ISP) Member growth, followed by Hosting/Data centre membership, which had been growing faster in the previous two periods.
These two industries have been the primary drivers of APNIC membership growth (Figure 1) for several years now.

In both periods, the number of new Members is quite balanced across the sub-regions, with South Asia seeing the highest growth during the current period, followed by East Asia (Table 1). We will need to look at the economy level to see the drivers of this growth.
| Sub-region | Previous period (6,000-7,000 Members) | Current period (7,000-8,000 Members) | Difference |
| South Asia | 412 | 491 | +79 |
| East Asia | 247 | 289 | +42 |
| Out-of region | 46 | 70 | +24 |
| South East Asia | 234 | 223 | -11 |
| Oceania | 385 | 332 | -53 |
| Total | 1,324 | 1,405 | +81 |
Table 1 — New Members by sub-region.
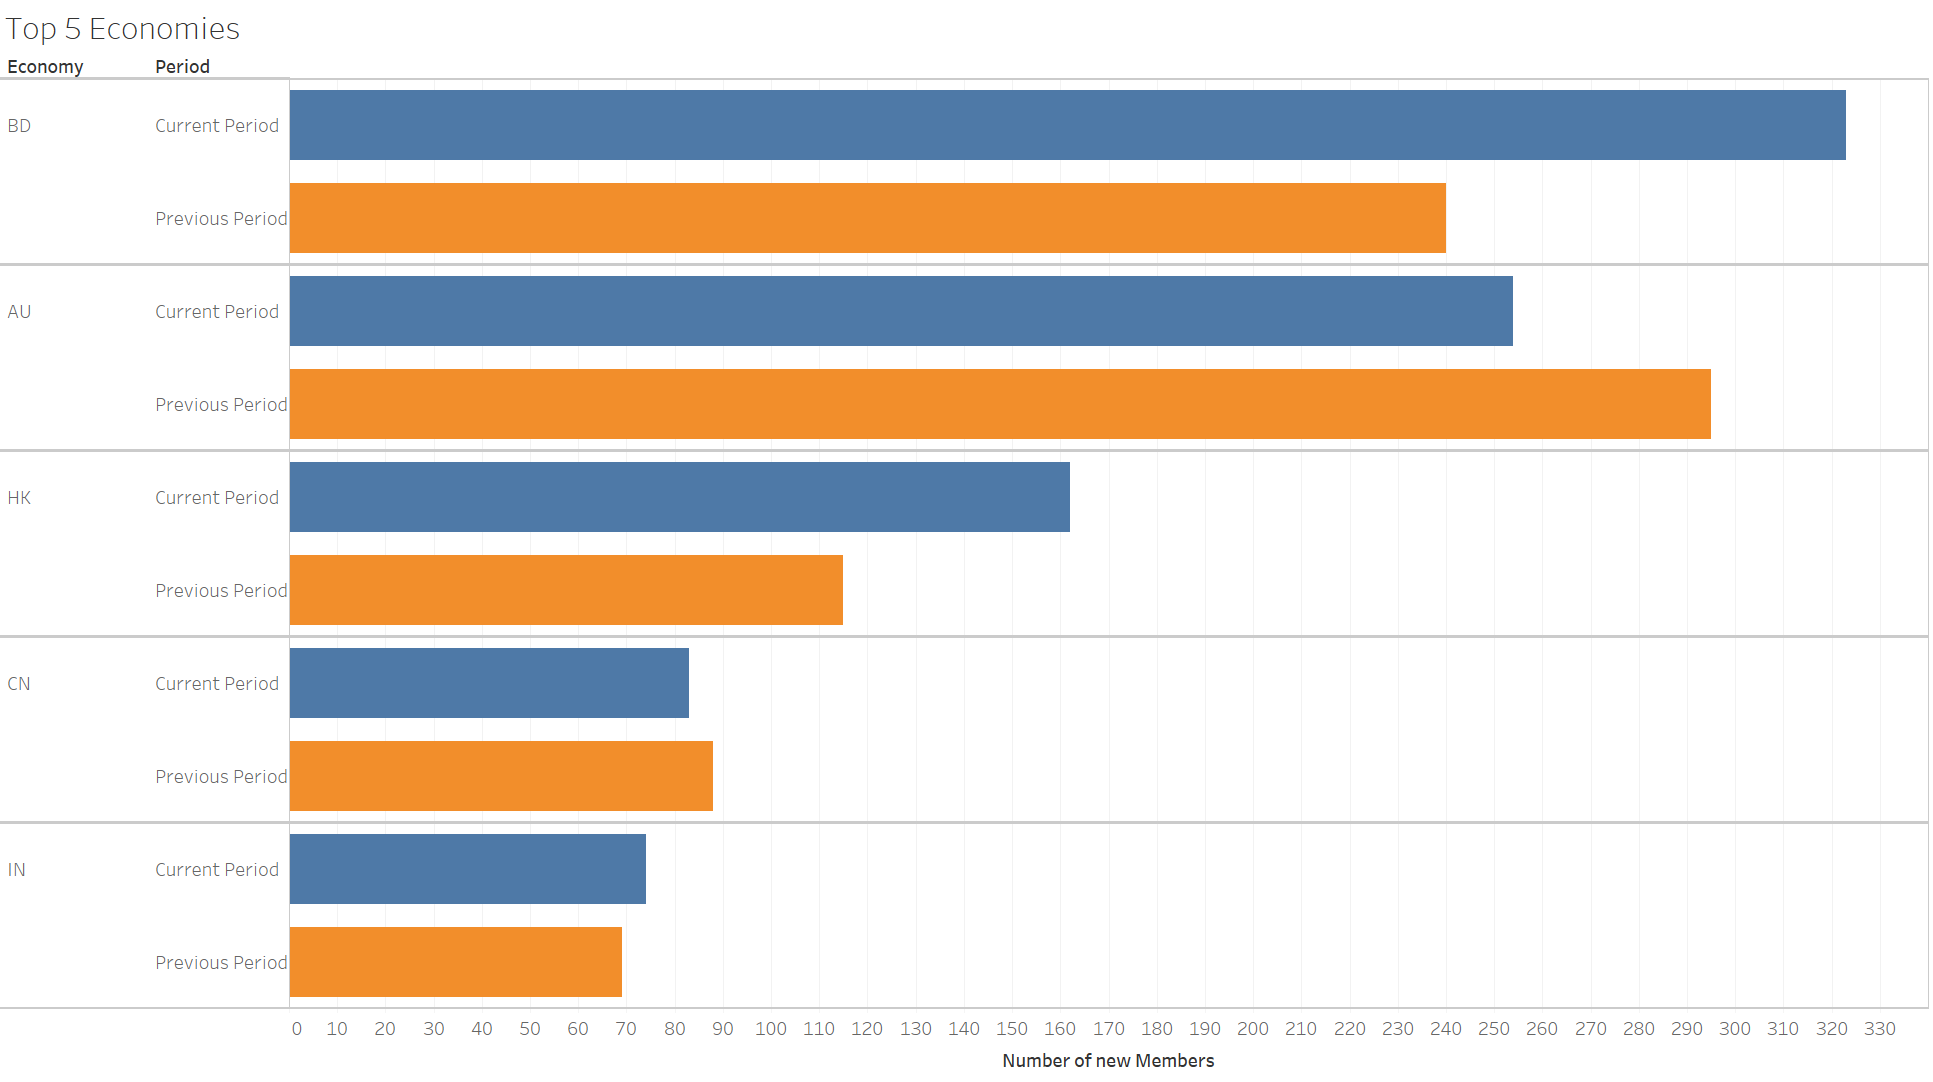
It turns out that Bangladesh has been the primary driver for this growth and in the process has taken over the top spot from Australia as the largest source of new APNIC direct Members.
The strong growth in Hong Kong contributed to the current period being higher than the previous period in East Asia, while China and India also contributed significantly to increases in East Asia and South Asia, respectively. Note that China and India have National Internet Registries (NIRs) that also grew quite significantly during this period.
Looking at the combined view by industry and economy (Figure 3), it’s clear that the strong growth of ISP membership during this period is attributed primarily to Bangladesh (population of 164 million). This is the outcome of light regulation in ISP licensing, supported by a strong ISP industry association in Bangladesh (ISPAB).
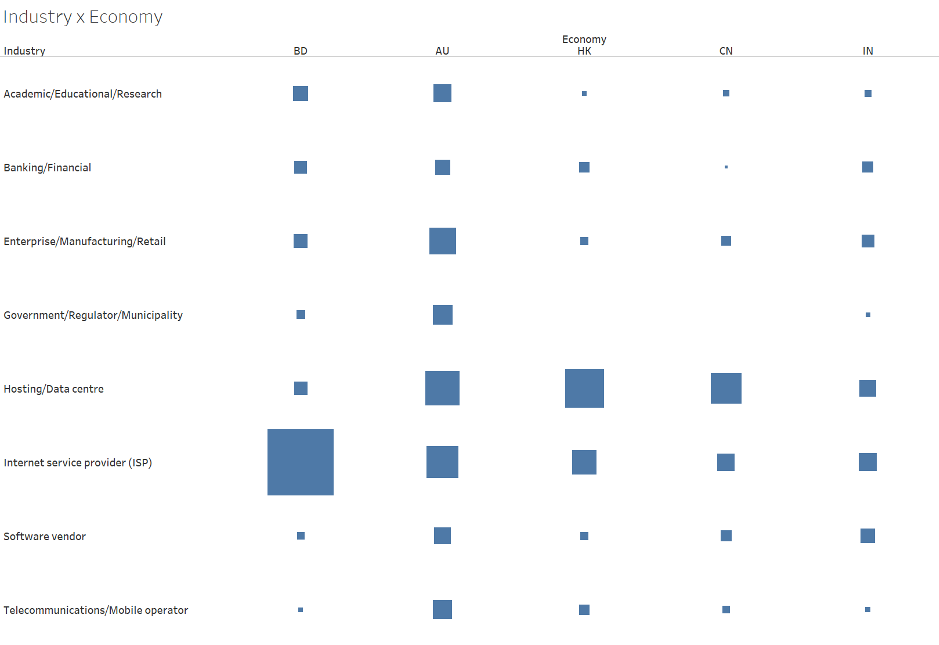
For the remaining top four economies, the percentage of new Hosting/Data centre members was close to or even higher than ISPs. It’s also worth noting that Australia was showing a more balanced industry mix compared to others, likely due to the maturity of its Internet infrastructure.
Resource distribution
The impact of the policy change in February 2019 (prop-127) that limits the IPv4 delegation size to a maximum of /23 can be seen in Table 2. Note the change from predominantly /22 in the previous period to /23 delegations in the current period.
| IPv4 prefix size | Previous period | Current period |
| None | 35 | 40 |
| /9 | 0 | 1 |
| /10 | 0 | 1 |
| /11 | 0 | 1 |
| /16 | 15 | 10 |
| /17 | 4 | 8 |
| /18 | 5 | 16 |
| /19 | 12 | 25 |
| /20 | 15 | 23 |
| /21 | 25 | 27 |
| /22 | 870 | 350 |
| /23 | 306 | 740 |
| /24 | 541 | 429 |
| Total | 1,828 | 1,671 |
Table 2 — IPv4 delegations to new Members.
Larger-sized delegations (/21 and above) in both periods indicate that new Members that need more IPv4 addresses than what APNIC can delegate from its limited pool have also received transfers from other organizations.
The very large delegation of a /9, a /10 and a /11 was the transfer from WIDE Japan to the Asia Pacific Internet Development Trust (APIDT).
Read: Announcing the Asia Pacific Internet Development Trust (APIDT)
Looking at IPv6 (Table 3), while /32 (default size to service providers) and /48 (default size to end-user organizations) prefixes remained the most common size in both periods, we saw less /32s and more /48s being delegated in the current period.
| IPv6 prefix length | Previous period | Current period |
| None | 361 | 404 |
| /21 | 1 | 0 |
| /22 | 1 | 0 |
| /23 | 1 | 0 |
| /24 | 2 | 0 |
| /30 | 1 | 1 |
| /32 | 625 | 432 |
| /33 | 0 | 1 |
| /34 | 0 | 1 |
| /35 | 0 | 2 |
| /41 | 1 | 0 |
| /42 | 1 | 0 |
| /43 | 1 | 0 |
| /44 | 0 | 1 |
| /46 | 1 | 2 |
| /47 | 5 | 6 |
| /48 | 387 | 590 |
Table 3 — IPv6 delegations to new Members.
This may be caused by the same policy change (prop-127) where the maximum IPv4 delegation was reduced to a /23, which also included a decrease in the annual membership fee if, at the same time, a new Member applies for and gets a /48 of IPv6 addresses, rather than a /32.
We observed no significant difference in Autonomous System Number (ASN) delegations (Table 4).
| Industry | Previous Period | Current Period |
| ISP | 459 | 580 |
| Hosting/Data centre | 278 | 241 |
| Enterprise/Manufacturing/Retail | 80 | 79 |
| Banking/Financial | 77 | 74 |
| Telecommunications/Mobile operator | 63 | 59 |
| Government/Regulator/Municipality | 52 | 39 |
| Software vendor | 44 | 41 |
| Academic/Educational/Research | 42 | 45 |
| Media/Entertainment | 14 | 32 |
| Other | 29 | 24 |
| Internet Exchange Point (IXP) | 12 | 13 |
| Infrastructure (transport/hospital) | 11 | 16 |
| Non-profit/NGO/Internet community | 9 | 12 |
| Industrial (construction, mining, oil) | 11 | 10 |
| Hardware vendor | 5 | 2 |
| Domain name registry/Registrar | 2 | 1 |
| NREN/Research network | 0 | 1 |
| Total | 1,188 | 1,269 |
Table 4 — ASN delegations to new Members.
It is good to see non-provider networks such as Enterprise, Banking, and Government continue to get their own ASNs to strengthen their Internet connectivity via a Border Gateway Protocol (BGP) multi-homing setup.
This is a good reminder for ISPs and telcos to provide BGP transit services in addition to their conventional Internet access services, and for Internet Exchange Providers to open access to these edge networks.
RPKI adoption
The adoption of Resource Public Key Infrastructure (RPKI) has been increasing globally over the last 12 months thanks largely to several Level 1 transit providers starting to validate their routes to mitigate against prefix hijacking.
We are seeing a steady number of new Members in both periods signing their Resource Origin Authorizations (ROAs) (Table 5). While not all of them do this, it is encouraging to see the level of awareness across industries, and the slight increase in the numbers overall.
| Industry | Previous Period | Current Period |
| ISP | 248 | 269 |
| Hosting/Data centre | 62 | 68 |
| Enterprise/Manufacturing/Retail | 19 | 13 |
| Banking/Financial | 15 | 15 |
| Telecommunications/Mobile operator | 10 | 14 |
| Software vendor | 11 | 9 |
| Academic/Educational/Research | 15 | 21 |
| Government/Regulator/Municipality | 7 | 5 |
| Other | 7 | 9 |
| Media/Entertainment | 5 | 5 |
| Industrial (construction, mining, oil) | 1 | 2 |
| Non-profit/NGO/Internet community | 2 | 0 |
| Internet Exchange Point (IXP) | 7 | 1 |
| Hardware vendor | 2 | 1 |
| Domain name registry/Registrar | 1 | 0 |
| Total | 1,188 | 1,269 |
Table 5 — ISPs were the most likely of new Members to sign their ROAs.
An important reminder to those who have signed their ROAs, though, is that this is only the first step towards securing your routes from misuse and hijacks.
Steady as she goes
By comparing the current period’s new Members against the previous period, we can conclude that APNIC membership is still growing steadily.
Growth is driven by high population economies (Bangladesh, China, and India) where access and content service networks are still growing and spreading, and economies with relatively mature Internet infrastructure adding more edge networks (Australia).
The views expressed by the authors of this blog are their own and do not necessarily reflect the views of APNIC. Please note a Code of Conduct applies to this blog.
I think you should also publish similar data for members including NIR members also, as NIR members also part of APNIC (may be not directly but they are also paying fees).
Thanks for the comment Gaurav! NIR accounts count is always included in the membership service section of APNIC Annual Report (https://www.apnic.net/about-apnic/corporate-documents/annual-reports/). At the end of 2021 the NIRs combined accounts is around 12,000.