
Network debugging is hard, for many reasons.
When dealing with protocols using the client/server model, the source of any problem can be:
- A buggy client
- A buggy server
- Both
If you have a specification, it can be wrong or unspecified, and you have to trust whatever your reference implementation is doing.
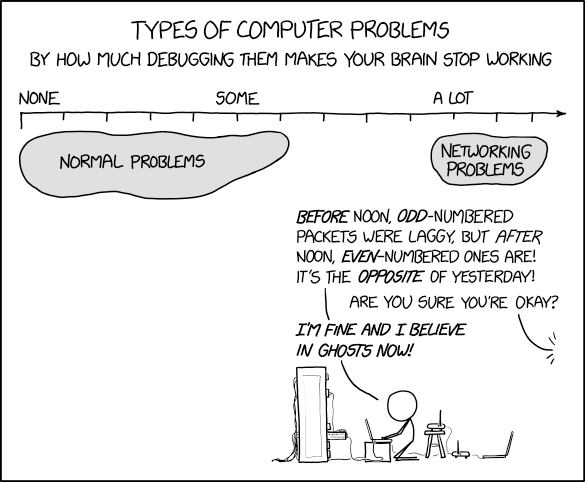
From xkcd by Randal Monroe.
Exploring all those possibilities takes a lot of time and effort so ideally, you want to reduce and narrow things down before you start a deep dive.
After debugging server message block (SMB) issues for a couple of years while working on the Linux kernel client and Samba server, I have found a couple of tricks and techniques that seem to work well for me and hopefully will work well for you. Some of the finer details are about SMB but the general idea is probably generic enough to be used for any protocol. The last section is about a new tool I wrote to diff network captures as if they were text files.
Source code bisection
If you have access to the source code of your client or server and are seeing some new buggy behaviour that wasn’t there a couple of versions ago, it means the bug was introduced somewhere in between.
You could painstakingly go through every single version stored in your Version Control System but this might take a while. In the case of the Linux kernel, the number of commits between two releases can go as high as hundreds of thousands.
The idea of source code bisection is to optimize the number of commits you have to test by checking them, like how you would look up a word in a dictionary.
- Let’s say you have a previous commit showing the correct behaviour ‘GOOD’ and the current bad one, ‘BAD’.
- The current search space is [GOOD…BAD]. By testing a commit ‘MID’ exactly in the middle you can obtain a new boundary and cut the search space in half.
- If MID is working properly, the bug was introduced in the latter half [MID…BAD].
- If MID is buggy, the bug was introduced in the former half [GOOD…MID]. You can just repeat this process recursively and cut your search space in half at each step (logarithmic approach).
- With an initial search space of 130,000 commits, you end up only having to test log2 (130,000) ≅ 17 steps!
This method was popularized by git, which ships with a built-in bisection tool aptly named ‘git bisect’. If you can script the actual testing of the buggy behaviour with a simple command that exits with a 0 or 1 the whole process can be fully automated. There are many examples of great tutorials and explanations online.
Different implementations
If you have different implementations of the client or server at your disposal, it is really useful to try those too, to see if they behave differently in the scenario you are working with. Using older or newer versions of your implementation counts as well.
If there is a lower-level library available for your protocol that allows you to craft and tweak packet fields it might also be very useful. You can mimic and reproduce exactly what one client does in a very minimal, compact code.
Debuggers
Surprisingly, debuggers haven’t been that useful for me as they are impractical to use most of the time. If you are debugging your client or server using breakpoints you end up making the debugged process unresponsive, which means timeouts on the other end of the connection.
If you still plan on using one on your server process, you will likely run into another issue — servers able to handle multiple clients concurrently will use some form of parallelism involving either forking processes or using a thread to handle a new client.
If you are using gdb, you might have noticed that it doesn’t follow the new thread of execution when your process ‘splits’ (by forking or creating a thread), rather it continues monitoring the main ‘parent’ process, and any breakpoints placed on the code the thread is running will never be hit. To instruct gdb to follow the child or thread to be able to break in the code dealing with your client you can use the following GDB commands:
set follow-fork-mode child
set detach-on-fork off
Log files
Watching log files of your server and client is also a great source of debugging information. They can produce a huge amount of output though, and watching multiple log files at the same time is not always practical.
There is a great open-source tool called LNAV that can help with this task. It can watch multiple files (similar to “tail -f”) at the same time by merging lines as they come and show them in the same stream of output. It also supports highlighting, filtering and searching. Highlighting multiple patterns of interest can be useful (such as an IP, a port, or some other value).
Network captures
Network captures are similar to wire log files. They store all the data going through a network interface. Those captures can then be looked at and decoded by tools such as Wireshark, NetMon.exe or MessageAnalyzer. The last two are developed by Microsoft and run on Windows but unfortunately both have been discontinued.
Looking at and capturing can all be made from Wireshark itself: you can tell it to do the capture and decode it. This is not always practical as you need to run Wireshark on the capturing host for that, which might be some small embedded system not capable of doing so, for example. In that case, you can do the capture on the host separately, copy it over to your system, and open it in Wireshark from there.
The most common lightweight tool to do the capturing step on Unix systems is tcpdump and works like so:
tcpdump -s 0 -i eth0 -w out.cap [OPTIONAL FILTERS]
This command will capture all traffic on eth0 and store it in the file “out.cap”. When you want to stop recording you can hit Control-C or kill the process. Alternatively, you can tell it to stop capturing after a certain number of packets have been captured with the -c option (for example -c 1000). Note that tcpdump can also capture UDP traffic despite its name.
The -s 0 option tells it to record each packet’s entire content. If you intend on recording hours of traffic the capture might get really big so if you are not interested in the payload but only some small header you could use -s 1024 to only store the first 1,024 bytes for example.
To narrow down the capture without truncating packets you can also use filters to limit the capture to certain hosts or ports like so:
 # capture traffic arriving or departing from 10.0.0.42
 tcpdump -s 0 -i eth0 -w out.cap host 10.0.0.42
 # capture traffic arriving or departing from port 445
 tcpdump -s 0 -i eth0 -w out.cap port 445
 # capture traffic arriving or departing from port 445 from or to host foo.example
 tcpdump -s 0 -i eth0 -w out.cap host foo.example and port 445
The filter expressions can be combined with parenthesis and logical operators (and, or). The available expressions are documented in the pcap-filter manual page and are rather basic. For more advanced filtering you will have to use Wireshark, which has its own different, advanced filtering expression syntax.
On Windows, starting from Windows 7, you can capture traces natively without installing any programs using the netsh built-in:
netsh trace start capture=yes report=yes traceFile=C:\temp\mytrace.etl
This will start capturing all traffic leaving/arriving the host interfaces to the file mytrace.etl. ETL traces currently cannot be opened in Wireshark, so you will need to convert them to PCAP via the etl2pcapng program (released by Microsoft, which only runs on Windows). The ETL format is not documented, and the etl2pcapng program uses Windows libraries to do the heavy lifting of decoding it. If this is a problem, I’ve reverse-engineered enough of it to write a simple python script etl2pcap, which you can run anywhere.
Wireshark tips
Basic filters
Wireshark display filters have a C-like syntax:
- Strings are between double quotes
- Numbers can be given in hexadecimal with a 0x prefix
- Boolean operators are ! (not), && (and), || (or), and can be grouped with parenthesis.
Some useful basic filters:
- Show packets starting from number 100: frame.number >= 100
- Show packets involving host 10.0.0.1 (to or from): ip.addr == 10.0.0.1
- Show TCP packets using port 445 (to or from): tcp.port == 445
By default, Wireshark will load your trace without any filter. If your protocol is supported and you are only interested in it I would recommend using the name of its dissector (‘dissectors’ are the names of protocol decoders in Wireshark). For example, I often use the filter “smb2 || dns” when debugging SMB things. It will remove a lot of noise already.
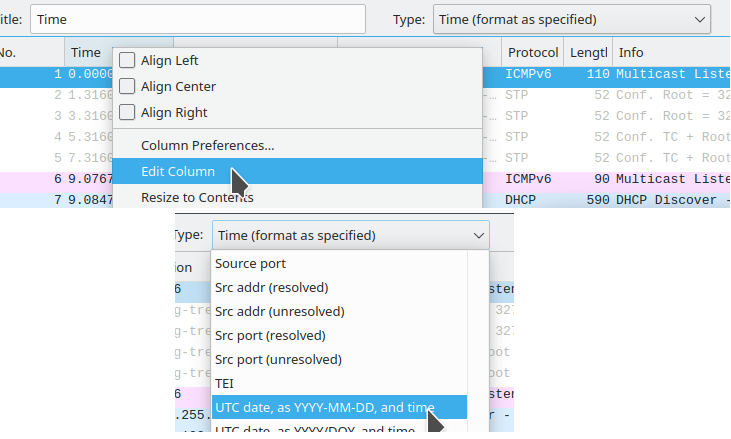
Time format
By default, Wireshark shows the time since the start of the capture. When matching packets with log files it is sometimes more practical to show the Coordinated Universal Time (UTC). This can be done by right-clicking the “Time” column header > “Edit Column” and Selecting UTC date.
Leveraging colours
When dealing with multiple clients or multiple IPs, it can be useful to display them in different colours. To colourize all packets belonging to the same TCP session, you can right-click on a packet belonging to that session and go to Colorize Conversation > TCP.
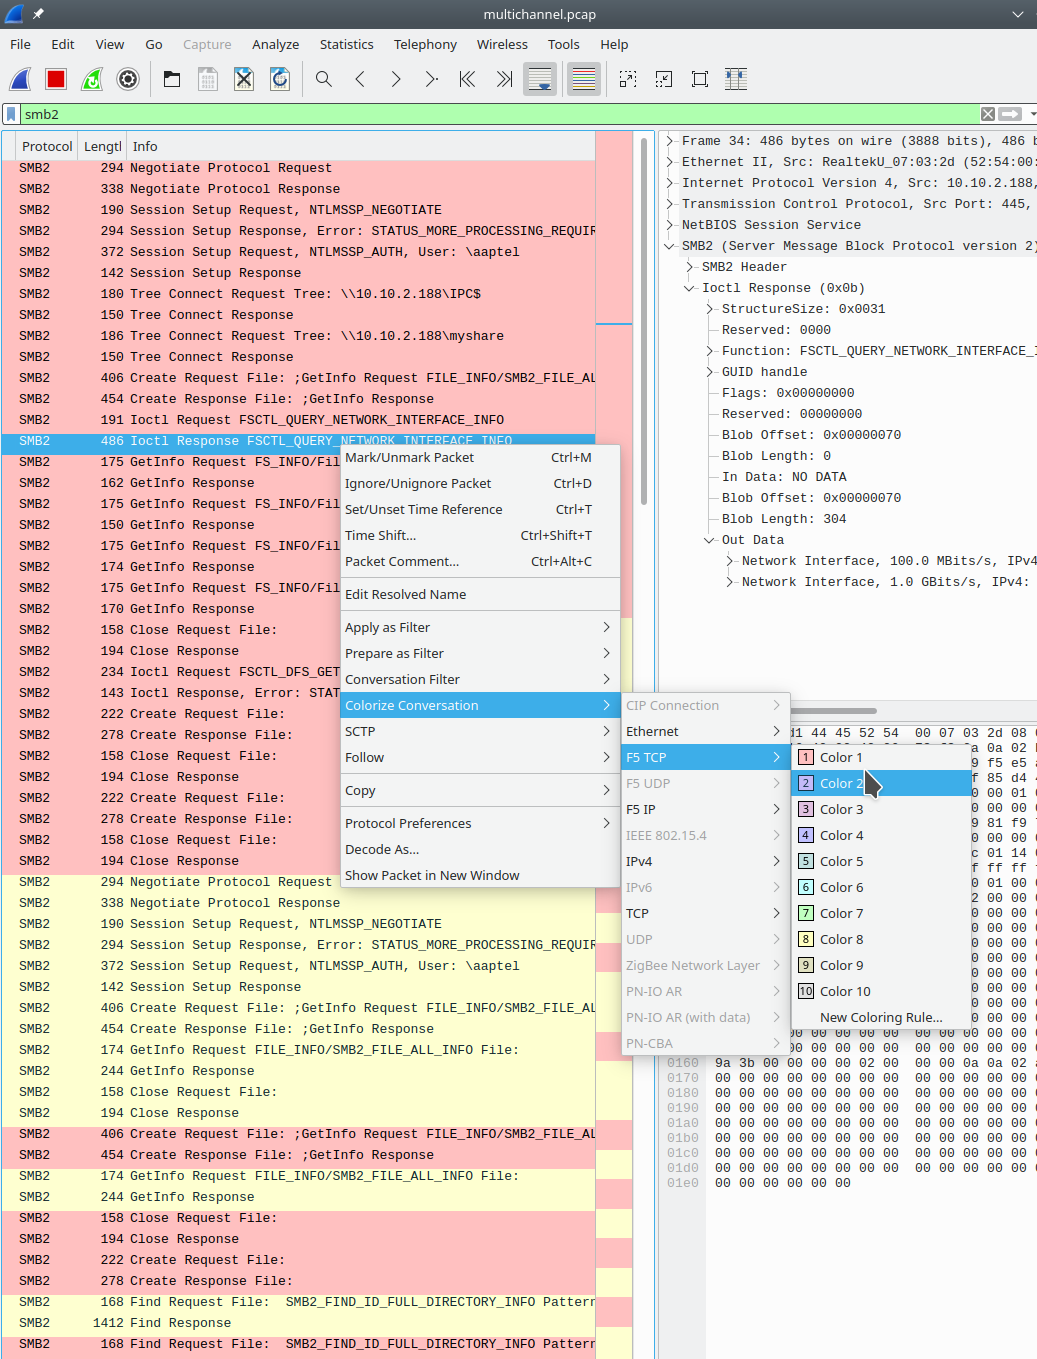
Making filters out of fields
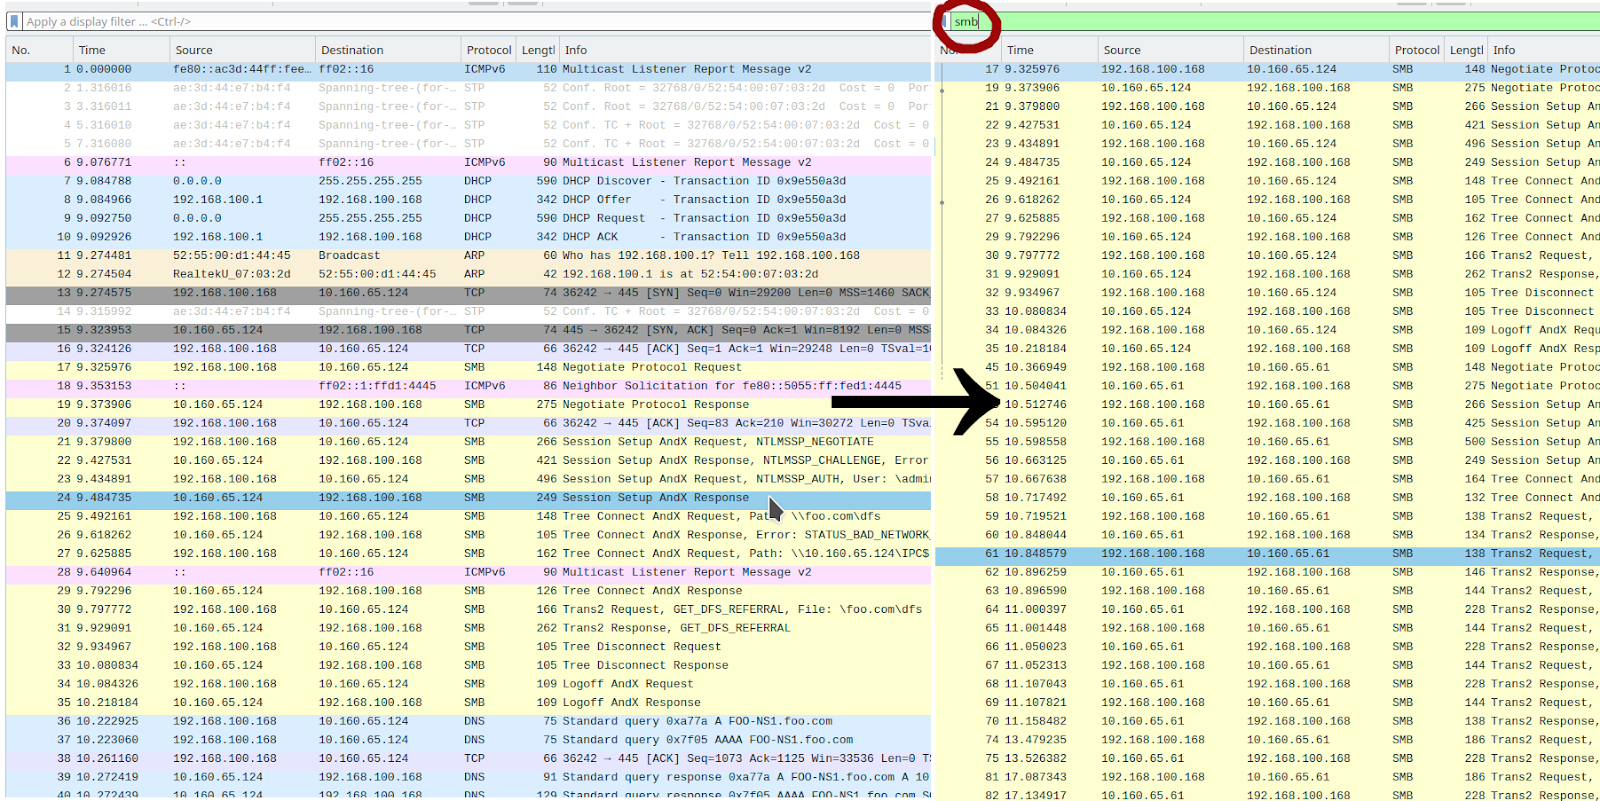
The filter input box might have autocompletion but finding what you want is not always easy. Fortunately, you can create filters out of the fields in the detailed view.

To do that right-click on the field you want to filter from, “Apply as Filter” > “Selected”. In the screenshot below you can see it automatically set the display filter to “smb2.cmd == 5”.
Note, you can also apply a colour using this “Colorize with filter” from the menu which can be nice if you still want the other packets to be displayed.
Comparing network captures
When you are faced with a bug in your client that doesn’t manifest with other client implementations you can capture the traffic of both clients and compare them to see what yours is doing differently.
You can do this by opening two instances of Wireshark and looking at packet details for each. But this is impractical; you might have hundreds of packets and going back and forth between the two windows expanding and compressing twistees on both sides takes a lot of time. You might easily miss some differences (extra spaces, a “\” instead of a “/”, or ‘off-by-one’ numbers). At the same time, you might not care about some differences such as timestamps or cryptographic signatures. These are expected to be different between the two traces and have no effect on the behaviour you are debugging.
After doing this side-by-side manual diff for far too long I’ve come up with a tool that leverages Wireshark to automate it a bit. The first iteration of the project, smbcmp, focuses on the SMB protocol as that is what I work on day-to-day.
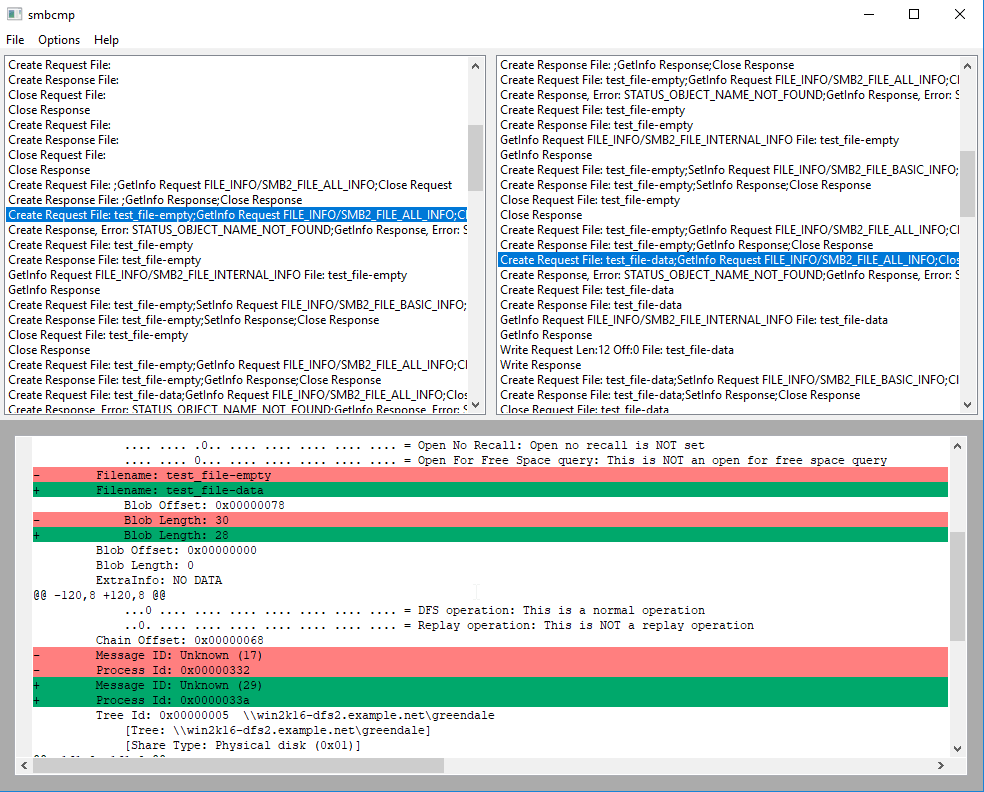
smbcmp loads two captures in the top-left and top-right panel. The bottom panel will dump and diff the SMB packets selected on each side. Using the arrow keys lets you move the selected packet cursors of both traces at the same time.
This proof-of-concept turned out better than I expected and so I started working on a protocol-generic version called WireDiff. It is still a work-in-progress but it can already do useful things.
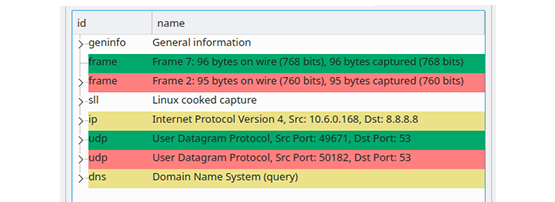
Here is a screenshot of WireDiff comparing two captures doing a DNS query. In one of the captures, we see some unexpected results. Let’s take a look at why.
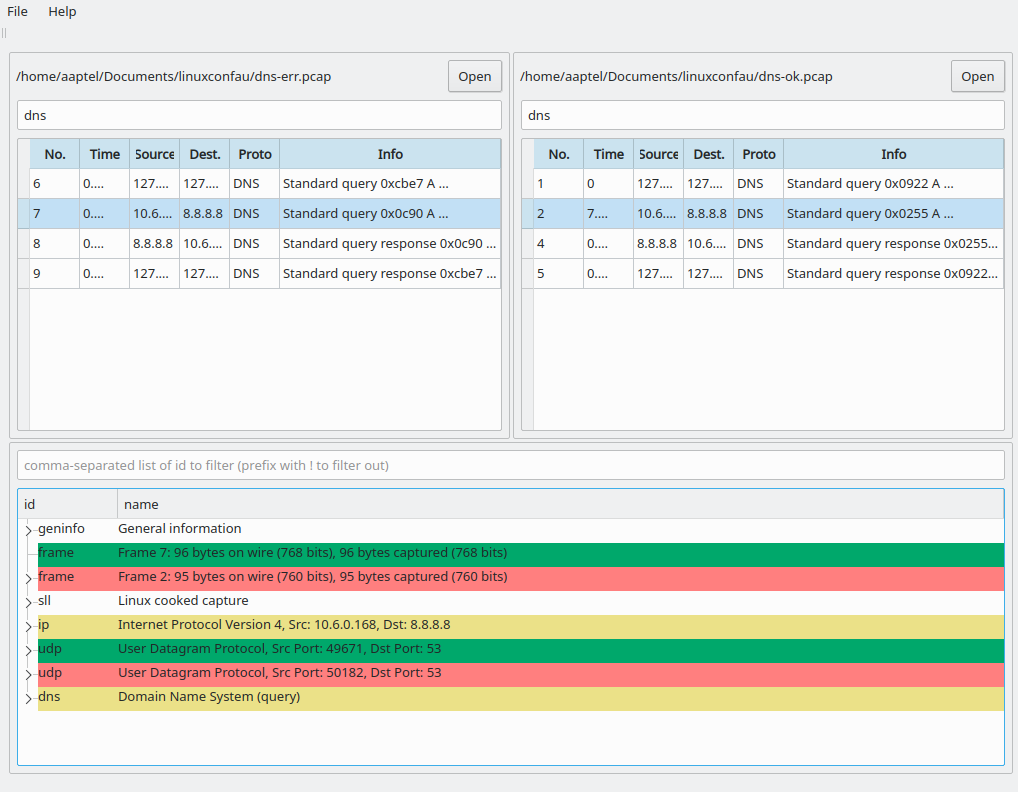
In the filter box above each trace listing, I’ve typed a Wireshark display filter to only display DNS packets.
In the bottom pane, we can see an expandable tree of differences across the whole network stack of the captured packets. The upper lines are lower on the OSI model, that is, closer to the wire. As you go down the list you reach higher-level protocols.
Each line has an “id” column, which is the name of the protocol dissector, and a “name” column, which is the summarized description of the payload it holds. If the line has an arrow on its left, it means it can be expanded as it contains more information. The colour yellow means that although the summarized description of the payload is identical on both sides, some of the inner details it holds are different.
In the screenshot above, frame, ip and udp headers are different but this is expected. What we are interested in is the differences in the DNS payload. We can instruct WireDiff to only show us DNS differences by typing the id (first column) of the protocol we want to display in the filter box on top of the bottom panel. We end up with this:
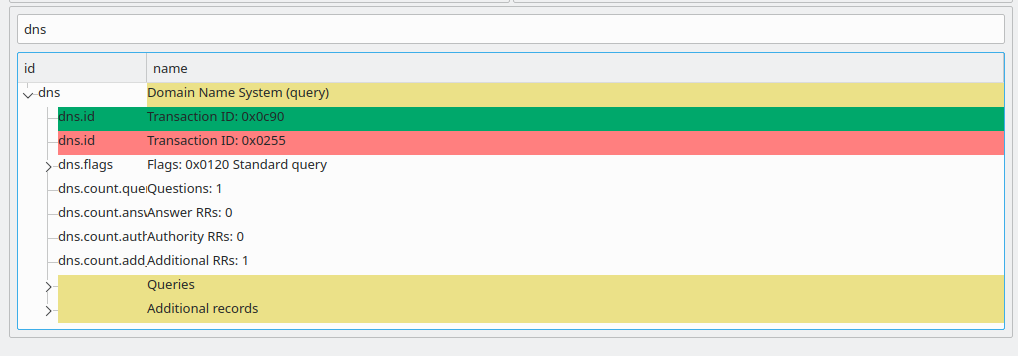
We can now see that
- The DNS transaction ID is different, but this is irrelevant to our issue.
- The Queries payload holds (hidden) differences.
Let’s instruct WireDiff to discard “dns.id” by filtering it out using the expression “!dns.id”, and let’s expand those Queries.
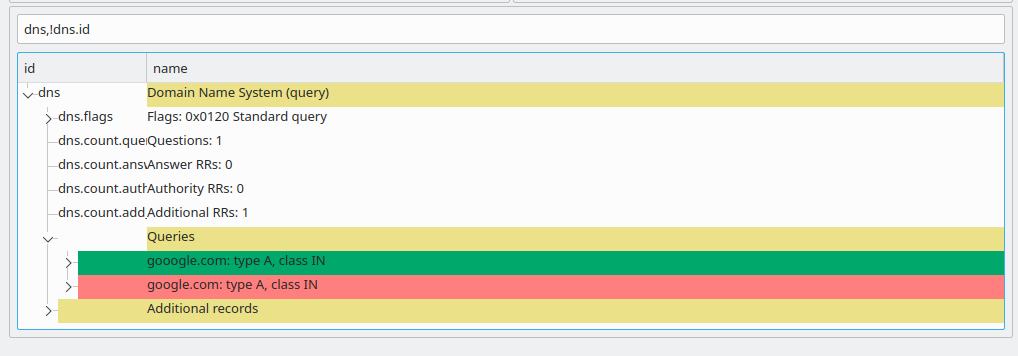
We can now see the root of the issue: in the non-working case we queried the host “gooogle.com”, with an extra “o”.
WireDiff is still in early stages of development. You will have to compile it yourself in order to use it. It is a free and open-source project so if you have ideas or code you would like to contribute you can get in touch with me or take a look at the GitHub project.
If you are interested in some finer details of smbcmp, WireDiff, live demos of both or other debugging techniques I use specifically for Linux kernel debugging, my linux.conf.au talk is available on YouTube: smbcmp: A new tool to diff network captures.
Aurélien Aptel is a software engineer working on open-source SMB-related things (cifs.ko kernel client, Samba server, Wireshark) at SUSE Linux in Nuremberg, Germany.
The views expressed by the authors of this blog are their own and do not necessarily reflect the views of APNIC. Please note a Code of Conduct applies to this blog.
Hi!
This looks like a nice tool, but are you aware that wireshark has the code for this, but the GUI has not been ported to QT from GTK? It was in older versions which used GTK, and was very useful.. I miss it!
Hi, is there a Windows version of WireDiff ?