Whether you work in IT security or networking you would have heard about, or maybe even had an experience with, IoT DDoS and Mirai botnet incidents. There are a lot of malicious devices out there that are continuously trying to scan your network, telnet/ssh to your network devices, or creating some GRE sessions with your routers.
There are a couple of open source tools you can use as network-based intrusion detection systems (IDS) or analysis frameworks, one of which is The Bro Network Security Monitor (Bro).
Bro’s powerful analysis engine makes it adept at high-performance network monitoring, protocol analysis, and real-time application layer state information.
In this post, I will explain how you can deploy Bro to monitor and analyze threat intelligence so you can fine-tune your security devices.
1. Install Bro
For the installation, I am using 64-bit Ubuntu 14.04.4 LTS.
# uname -a

Linux bro-sensor 4.2.0-27-generic #32~14.04.1-Ubuntu SMP

Fri Jan 22 15:32:26 UTC 2016 x86_64 x86_64 x86_64 GNU/Linux
Before installing Bro, make ensure that some dependencies are in place.
# sudo apt-get install cmake make gcc g++ flex bison libpcap-dev libssl-dev

python-dev swig zlib1g-dev swig libgoogle-perftools-dev
We will install Bro from the source. Download the source:
# sudo wget https://www.bro.org/downloads/bro-2.5.tar.gz

# sudo mkdir -p /opt/nsm/bro

# sudo tar -zxvf bro-2.5.tar.gz

# sudo cd bro-2.5

# sudo ./configure --prefix=/opt/nsm/bro

# sudo make

# sudo make install
Export the PATH environment variable:
# sudo export PATH=/opt/nsm/bro/bin:$PATH
Start the Bro service:
# sudo /opt/nsm/bro/bin/broctl deploy
Check that Bro is running properly:
# sudo /opt/nsm/bro/bin/broctl status

Name         Type       Host          Status    Pid    Started

bro          standalone localhost     running   1366   01 Feb 13:41:06
You will see a bunch of log files in /opt/nsm/bro/logs/current depending on how Bro is catching up all the packets.
You can tail the conn.log file and observe Bro logs streaming in real time:
# sudo tail -f /opt/nsm/bro/logs/current/conn.log
2. Adding threat intelligence
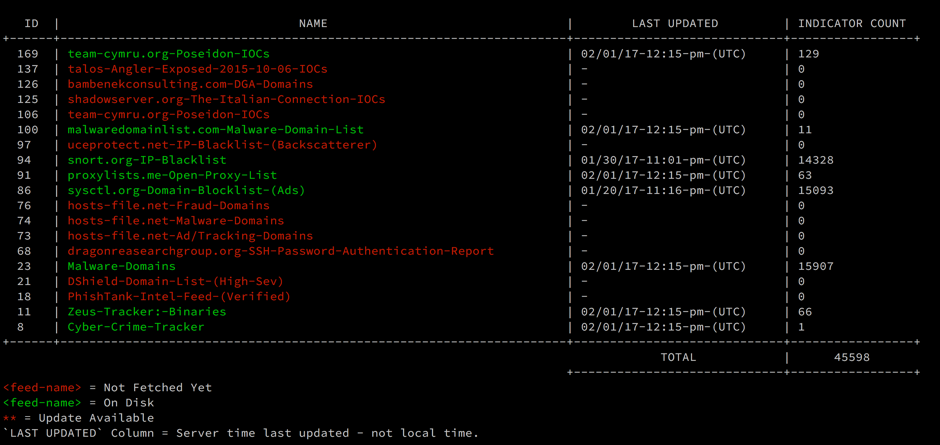
Intel Feed by CriticalStack is a free intel marketplace for Bro. Once you’ve created a free account, log in and create a ‘Collection’ and at least one ‘Sensor’ under the collection. Subscribe to feeds that are relevant for your network. Right now there are more than 100 feeds you can subscribe to. If everything is done, your dashboard will look something like this:
Write down the API key, which you’ll need to integrate critical-stack-intel with Bro.
In the Bro server, install critical-stack-intel:
# sudo curl

https://packagecloud.io/install/repositories/criticalstack/critical-stack-

intel/script.deb.sh | sudo bash

# apt-get install critical-stack-intel

# critical-stack-intel api YOUR-API-KEY-GOES-HERE
Check, install, and restart Bro:
# broctl check

# broctl install

# broctl restart
Use the command “critical-stack-intel list” to show the active threat intelligence feeds:
# critical-stack-intel list
Depending on the location of the sensor, it may already be seeing malicious traffic. The Critical Stack Intel Client may already be reporting malicious activity to Bro’s intel.log file. In our case, the file will be located in the /opt/nsm/bro/logs/current folder.
So our sensor is ready and is picking up all the logs. You can parse these logs from cli but I find it not user-friendly/comfortable. Next, we will include the ELK stack (ElasticSearch, Logstash and Kibana) to analyze these logs for information about network traffic.
3. Integrate ELK stack with Bro
ELK stack is a very good data visualization tool. You can find the installation process at the ElasticSearch, Logstash and Kibana websites. When your ELK stack is ready, it’s time to integrate Bro:
# cd /etc/logstash/conf.d/

# sudo wget https://raw.githubusercontent.com/fakrul/bro-elk/master/bro-conn_log.conf

# sudo wget https://raw.githubusercontent.com/fakrul/bro-elk/master/bro-dns_log.conf

# sudo wget https://raw.githubusercontent.com/fakrul/bro-elk/master/bro-files_log.conf

# sudo wget https://raw.githubusercontent.com/fakrul/bro-elk/master/bro-http_log.conf

# sudo wget https://raw.githubusercontent.com/fakrul/bro-elk/master/bro-intel_log.conf

# sudo wget https://raw.githubusercontent.com/fakrul/bro-elk/master/bro-notice_log.conf

# sudo wget https://raw.githubusercontent.com/fakrul/bro-elk/master/bro-ssh_log.conf

# sudo wget https://raw.githubusercontent.com/fakrul/bro-elk/master/bro-ssl_log.conf

# sudo wget https://raw.githubusercontent.com/fakrul/bro-elk/master/bro-tunnel_log.conf

# sudo wget https://raw.githubusercontent.com/fakrul/bro-elk/master/bro-weird_log.conf

# sudo wget https://raw.githubusercontent.com/fakrul/bro-elk/master/bro-x509_log.conf
The configs are forked from https://github.com/vicgc/logstash-dfir and https://github.com/timmolter/logstash-dfir and modified to suit my installation needs. These configs use logstash-filter-translate plugins – the following command will install it for you:
# cd /usr/share/logstash/bin/

# sudo logstash-plugin install logstash-filter-translate
Run the following command to check if everything is working fine:
# sudo -u logstash /usr/share/logstash/bin/logstash -f /etc/logstash/conf.d --debug
If everything is ok, restart the logstash service:
# sudo initctl restart logstash
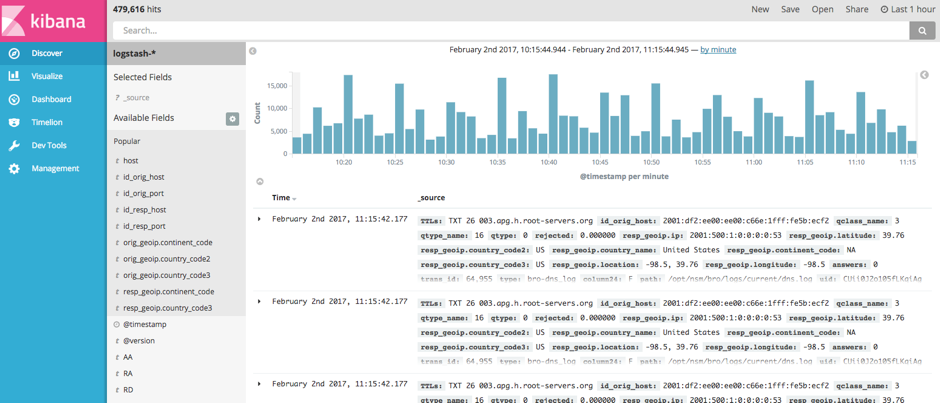
Access the Kibana interface (http://localhost:5601/), which runs on port 5601.
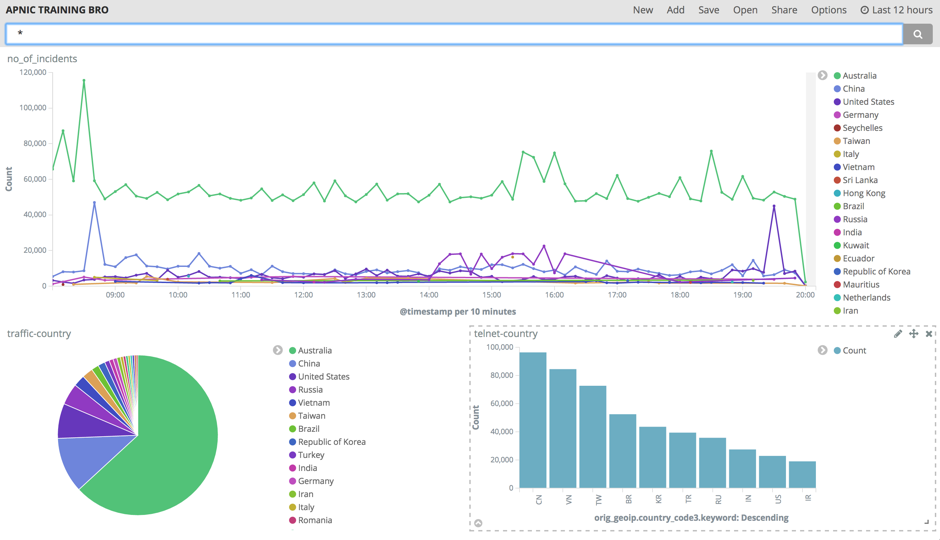
Now you can search specific incidents from this interface. You can even have specific filters and visualize them by creating graphs.
The data you get is mostly broadcast and unicast destined to the sensor. The next thing to do is to put some passive or active LAN tap, or do a port mirror, to get all the data within that broadcast domain.
This analysis gives you a real insight into your network and you can use this data to fine-tune your security devices.
Feel free to leave us your comments, suggestions or experience working with Bro and any other network-based analysis framework or tools.
The views expressed by the authors of this blog are their own and do not necessarily reflect the views of APNIC. Please note a Code of Conduct applies to this blog.


Hi its a very good article and useful one 🙂
But can we enable in bro ids itself to passive or active LAN tap, or do a port mirror
or is there any steps to do it ?
Thanks,
Raj
Hi Raj,
Port mirror is the easy and recommended solution. But you can also use Passive LAN Tap for example Knowm for monitoring packet flow on an Ethernet connection.
Thanks
Fakrul
We’ve run into an issue with these configs that I can’t seem to find anyone else having or fix myself. Basically, our LogStash instance creates 11 ElasticSearch entries for every bro log created (e.g. one trigger a CriticalStack IP creates 11 entries visible in Kibana that are identical, whereas the actual intel.log only has 1).
This number of duplicate entries corresponds directly to the number of LogStash configuration files (if I remove or add one, the number changes relative to the number in the folder). The files are copied exactly from above. I’ve tried a few different things, including modifications designed to present duplicates, but to no avail. For whatever reason, it seems LogStash is creating an entry for each configuration file present despite them coming from different input sources/files.
Any thoughts on how to fix this?
Nevermind, I was able to resolve it. Apparently, having an output block in every configuration file results in LogStash inserting an entry for each output block. Removing all but one of them fixed the issue.
Hi – I am very close to getting this to work. I do not have Kibana configured for anything else except for this instance. Kibana is asking me for a default index pattern which is populated with logstash-* and states ‘Unable to fetch mapping.’ Do you have any suggestions on how to map the bro log data from logstash in to an index that Kibana recognizes? Any gudiance would much greatly appreciated!!
I’m having the same issue as ML, have you found any solution?
Hi ML and TW,
Maybe you could configure bro to write logs in json instead of the default tab-delimited format:
@load tuning/json-logs
And change the codec to json in logstash config file:
codec=>”json”
Hope this helps.
Thanks for the article, it is very useful!
I have one problem, I created a sensor and associated a collection to it, somehow I can not subscribe the feeds into the collection, when click subscribe, nothing happens, do I need to do anything additional? I seem can not fin any information online,,,
Any advise?
TIA