

Unplanned outages due to cyberattacks can be catastrophic for cloud providers and those they serve; the most high-profile incident being the DDoS attack on Dyn in 2016, which interrupted the services of Netflix, Twitter, and PayPal.
Aside from recovery costs and business interruptions — the latter of which can cost as much as USD 22,000 per minute — the most damaging effect of such attacks can be reputational, specifically the loss of customers.
In this post, together with my collaborators from the University of Twente (UT) and CAIDA/UC San Diego, I’ll discuss the findings of our recent historical analysis of the Dyn attack to determine if the popularity and industry sector of Dyn customers impacted their reaction to the outage.
We used historical data from OpenINTEL, an active DNS measurement infrastructure, to observe the reaction of Dyn customers. Based on their nameserver (NS) records, we identified their relationship status with Dyn — whether they only used NSs from Dyn (exclusive customers) or also from other providers (non-exclusive customers).
Following the outage, we observed changes in this status — a customer either unsubscribed (stopped using Dyn NSs) or became non-exclusive (used redundant DNS services from other providers).
We also observed that some customers returned to Dyn after temporarily unsubscribing to its services.
Impact of customer characteristics on their reaction
From our observations, only a few customers reacted and changed their DNS management practices following the outage. Of those who did react, we noted the following behaviours:
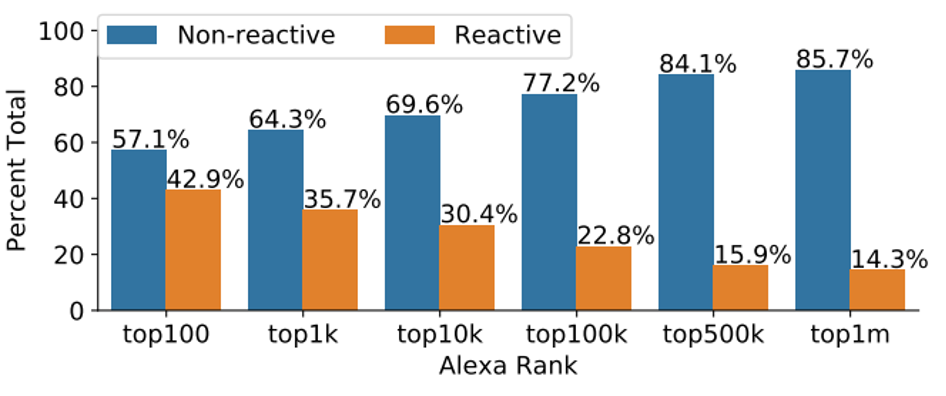
More popular websites are more likely to react to the attack
For example, 42.9% of the Dyn customers in the Top 100 Alexa ranks made changes to their NS records in the aftermath of the DDoS attack while only 14.3% of Dyn customers who belonged to the Top 1 million Alexa ranks showed this behaviour (Figure 1).
Customers in different industry sectors have different preferences in terms of the type of reaction observed
As shown in the top plot of Figure 2, customers that relied on the number of views and clicks as their revenue stream, such as news portals (General News), preferred to stay but became non-exclusive. This option reflects a more resilient strategy by creating redundancy or a backup service. In addition, malicious customers categorized as malware distribution, Potentially Unwanted Programs (PUPs), and phishing websites (Malicious Sites) also preferred this option, reflecting the high value of availability for their operations.
Meanwhile, customers who gained more revenue from web-based services such as Gambling, Streaming Media, and Social Networking, showed a significant preference to leave the provider (unsubscribe) in response to the attack. This reaction might indicate intolerance against downtime and a lower trust level in the provider.
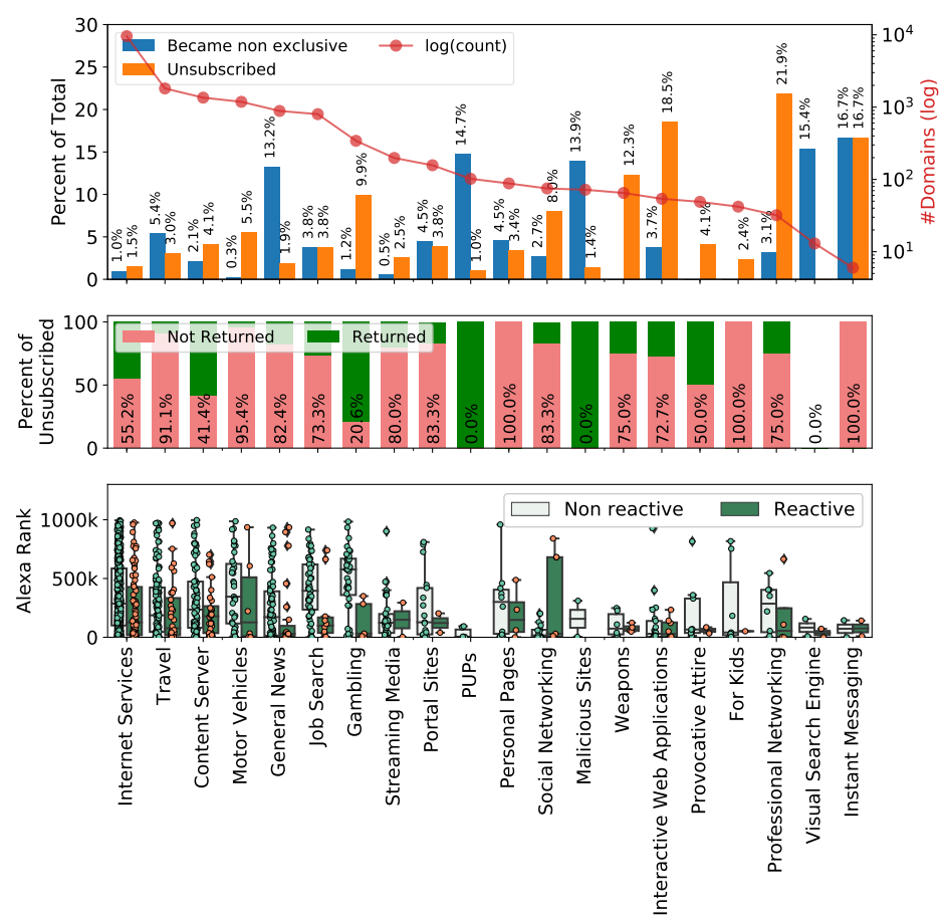
Most customers don’t return if they leave
On average, more than 75% of customers who left did not return. However, as shown in the middle plot of Figure 2, customers in some industry sectors, such as Gambling, show a different preference — they mostly returned after a couple of days.
Popularity plays a significant role in the behaviour of customers in some industry sectors such as Gambling and Job Search
As shown in the bottom plot of Figure 2, the difference between the Alexa ranks of reactive and non-reactive customers is significant. However, this difference is not obvious for customers in other industry sectors such as Travel and Motor Vehicles.
Customer characteristics have a strong influence on their reaction to an unplanned outage
Based on our findings, we recommend that DNS service providers and cloud providers implement a similar methodology to monitor and estimate the potential impact of unplanned downtime on their customer portfolio.
We recognize that this analysis is conducted on a single event and that further studies analysing similar events are needed to form more reliable conclusions. Feel free to reach out to us if you are interested in performing such an analysis on a different case.
Learn more about our study in our Workshop on Traffic Measurement for Cybersecurity 2022 paper.
Contributors: Mattijs Jonker (UT), Roland Martijn van Rijswijk – Deij (UT), KC Claffy (CAIDA), Bart Nieuwenhuis (UT), Abhishta Abhishta (UT).
M Yasir M Haq is a PhD candidate at the University of Twente.
The views expressed by the authors of this blog are their own and do not necessarily reflect the views of APNIC. Please note a Code of Conduct applies to this blog.